1846
Medium Term Reproducibility of 1H FID-CRT-MRSI at 7 Tesla
1Department of Neurosurgery, Medical University of Vienna, Vienna, Austria, 2Department of Biomedical Imaging and Image-guided Therapy, Medical University of Vienna, Vienna, Austria, 3Christian Doppler Laboratory for MR Imaging Biomarkers, Vienna, Austria, 4Department of Psychiatry and Psychotherapy, Medical University of Vienna, Vienna, Austria, 5Comprehensive Center for Clinical Neurosciences and Mental Health (C3NMH), Medical University of Vienna, Vienna, Austria, 6Institute for Clinial and Molecular MRI, Karl Landsteiner Society, St. Poelten, Austria
Synopsis
Keywords: Spectroscopy, Brain, 7T, Neuro, MRSI, Reproducibility
Motivation: 1H FID-CRT-MRSI at 7T is a promising approach for non-invasive quantification of metabolic processes in the brain. Its medium-term reproducibility has never been investigated even though it is a requirement for many potential study setups.
Goal(s): To evaluate the intersession reproducibility of 1H FID-CRT-MRSI at 7T.
Approach: We calculated metabolite concentration estimates in 55 brain regions for two measurement sessions one week apart, and determined coefficients of variations between them.
Results: We found good overall reproducibility, with CVs ranging from 7.5% to 12% for different brain regions, and concentration estimates matching our previous work.
Impact: We established good reproducibility of FID-CRT-MRSI at 7T, enabling longitudinal study setups e.g. for disease monitoring. Another potential follow-up of this work may be tracking the intra-day metabolite level variations in the brain in a non-invasive way.
Introduction
7T Magnetic resonance spectroscopic imaging using free induction decay along concentric ring trajectories (FID-CRT-MRSI) is capable of creating high resolution metabolic maps over the whole brain in relatively short acquisition times1. Previously, we published good inter-subject stability of metabolic concentration estimates2 and intra-session intra-subject reproducibility at last year's ISMRM, with coefficients of variation (CV) being <5% for “good” and <10% for suboptimal regions3. Another important aspect is the medium-term stability, as good medium-term stability is a necessity when follow-up examinations are performed in volunteers or patients. The purpose of this work was the evaluation of the inter-session intra-subject stability of 7T FID-CRT-MRSI, which we investigated in two scan sessions separated by approximately seven days.Methods
We acquired a protocol containing four MRSI acquisitions over two sessions (session 1: A1, A2, session 2: B1, B2) in a cohort of 17 consenting healthy volunteers with IRB-approval. All images covered the brain with a field of view of 220×220×130 mm3, 3.4 mm isotropic resolution and a matrix size of 64×64×39 voxels (TR=450 ms, AD=1.3 ms, TA=15 min). To enable internal water referencing, we also acquired an unsuppressed MRSI per session with identical geometric properties (TR=200 ms, AD=1.3 ms, TA=3:18 min). The protocol also contained B0 and B1 field maps and a T1w MP2RAGE (TR=5000 ms, TE=4.13 ms, TI1=700 ms, TI2=2700 ms, 0.8×0.8×0.8 mm3 resolution, 8:02 min with GRAPPA factor 3).After post-processing4, spectroscopic quantification was done in LCModel5 using a basis set of 15 metabolites, and their concentration estimates (CEs) were calculated and corrected for T1 and B1 inhomogeneity6,7. The results were segmented in gray and white matter (GM, WM) based on the T1-weighted images using BET8, and then further segmented in 55 different brain regions based on brain atlases using a MATLAB implementation of FreeSurfer9. Lastly, mean concentration values were calculated for each region2. This process was repeated for every acquisition.
For analysis, we averaged the mean metabolite CE from the first and second MRSI of each session, resulting in CEA=1/2×(CEA1+CEA2) and CEB=1/2×(CEB1+CEB2). We then calculated inter-session coefficients of variation (CVs), according to CV=σ/μ, with the sample’s standard deviation σ=σ(CEA,CEB) and the mean μ=1/2×(CEA+CEB). This process was repeated for every volunteer. While we analyzed all available metabolites for this work, we focussed especially on metabolites that have previously proven to be consistently fitted in healthy volunteers, namely N-Acetylaspartate (NAA), creatine and phosphocreatine (tCr), phosphocholine and glycerophosphocholine (tCho), glutamate (Glu), and myo-inositol (mIns)2. Figure 1 summarizes the methods of this work.
Results
The brain regions with the highest medium-term reproducibility over GM and WM across all metabolites were the temporal cortex (CV=7.54%), the auditory cortex (CV=8.32%), the frontal cortex (CV=8.63%), and the motor cortex (CV=9.82%). For 9 exemplary regions, CVs and CEs are noted in table 1.Figure 2 shows a visualization of CEA and CEB in all volunteers, together with the average CV, of eight regions. The data points tend to show higher variation in regions with higher CVs.
Figure 3 shows the CVs of all individual volunteers in four regions. There are some datasets with poor and others with exceptionally good reproducibility, with the former having a significant influence on the mean CVs.
Lastly, figure 4 shows example CE maps of volunteer 5. Overall, we see good consistency over the whole brain, but it is also evident that there are some small differences between sessions A and B, which may be in part explained by the lack of coregistration between them.
Discussion and Conclusion
Overall, we found good inter-session reproducibility. Our previous results, which compared back-to-back acquisition within a single session (without removing the participant from the scanner), found CVs between 0 and 5% for good regions. The inter-session reproducibility thus seems to be worse than intra-session, which is to be expected. Nevertheless, we believe that the inter-session stability might further be improved through controlling for factors like the time of day as well as general data quality improvements of MRSI. As previous research has shown varying metabolite changes throughout the day10, further investigating intraday changes of metabolite levels in the brain may be interesting and would enable time-of-day-corrections. Furthermore, simplifying and accelerating the evaluation process with tools like SynthSeg11, improving the data quality by applying higher-order B0 shims and implementing parallel transmission, as well as expanding to multiple research centers to achieve a higher data diversity and a larger cohort would be worthwhile goals in the future.Acknowledgements
We gratefully acknowledge the support of the Austrian Science Fund (projects KLI 1089 and KLI 1121).
References
[1] L. Hingerl, W. Bogner, P. Moser, et al. (2018) Density-weighted concentric circle trajectories for high resolution brain magnetic resonance spectroscopic imaging at 7T, Magnetic Resonance in Medicine. DOI: 10.1002/mrm.26987.
[2] G. Hangel, B. Spurny-Dworak, P. Lazen, et al. (2021) Inter-subject stability and regional concentration estimates of 3D-FID-MRSI in the human brain at 7 T, NMR in Biomedicine. DOI: 10.1002/nbm.4596.
[3] P. Lazen et al. B1+ Correction for 7T FID-CRT-MRSI. Proceedings of the International Society for Magnetic Resonance in Medicine, 2022. Digital poster, program number 2534.
[4] L. Hingerl, B. Strasser, P. Moser, et al. (2020) Clinical High-Resolution 3D-MR Spectroscopic Imaging of the Human Brain at 7 T, Invest Radiol. DOI: 10.1097/RLI.0000000000000626.
[5] S.W. Provencher (1993) Estimation of metabolite concentrations from localized in vivo proton NMR spectra, Magn Reson Med. DOI: 10.1002/mrm.1910300604.
[6] C. Gasparovic, T. Song, D. Devier, et al. (2006) Use of tissue water as a concentration reference for proton spectroscopic imaging, Magn Reson Med. DOI: 10.1002/mrm.20901.
[7] M.A. Bernstein, K.F. King, X.J. Zhou Handbook of MRI Pulse Sequences, Elsevier Inc., 2004. DOI: 10.1016/B978-0-12-092861-3.X5000-6.
[8] S.M. Smith (2002) Fast robust automated brain extraction, Hum Brain Mapp. DOI: 10.1002/hbm.10062.
[9] B. Fischl (2012) FreeSurfer, Neuroimage. DOI: 10.1016/j.neuroimage.2012.01.021.
[10] C. Volk, V. Jaramillo, R. Merki, R. O’Gorman Tuura, R. Huber (2018) Diurnal changes in glutamate + glutamine levels of healthy young adults assessed by proton magnetic resonance spectroscopy, Hum Brain Mapp. DOI: 10.1002/hbm.24225.
[11] B. Billot, D.N. Greve, O. Puonti, et al. (2023) SynthSeg: Segmentation of brain MRI scans of any contrast and resolution without retraining, Med Image Anal. DOI: 10.1016/j.media.2023.102789.
Figures
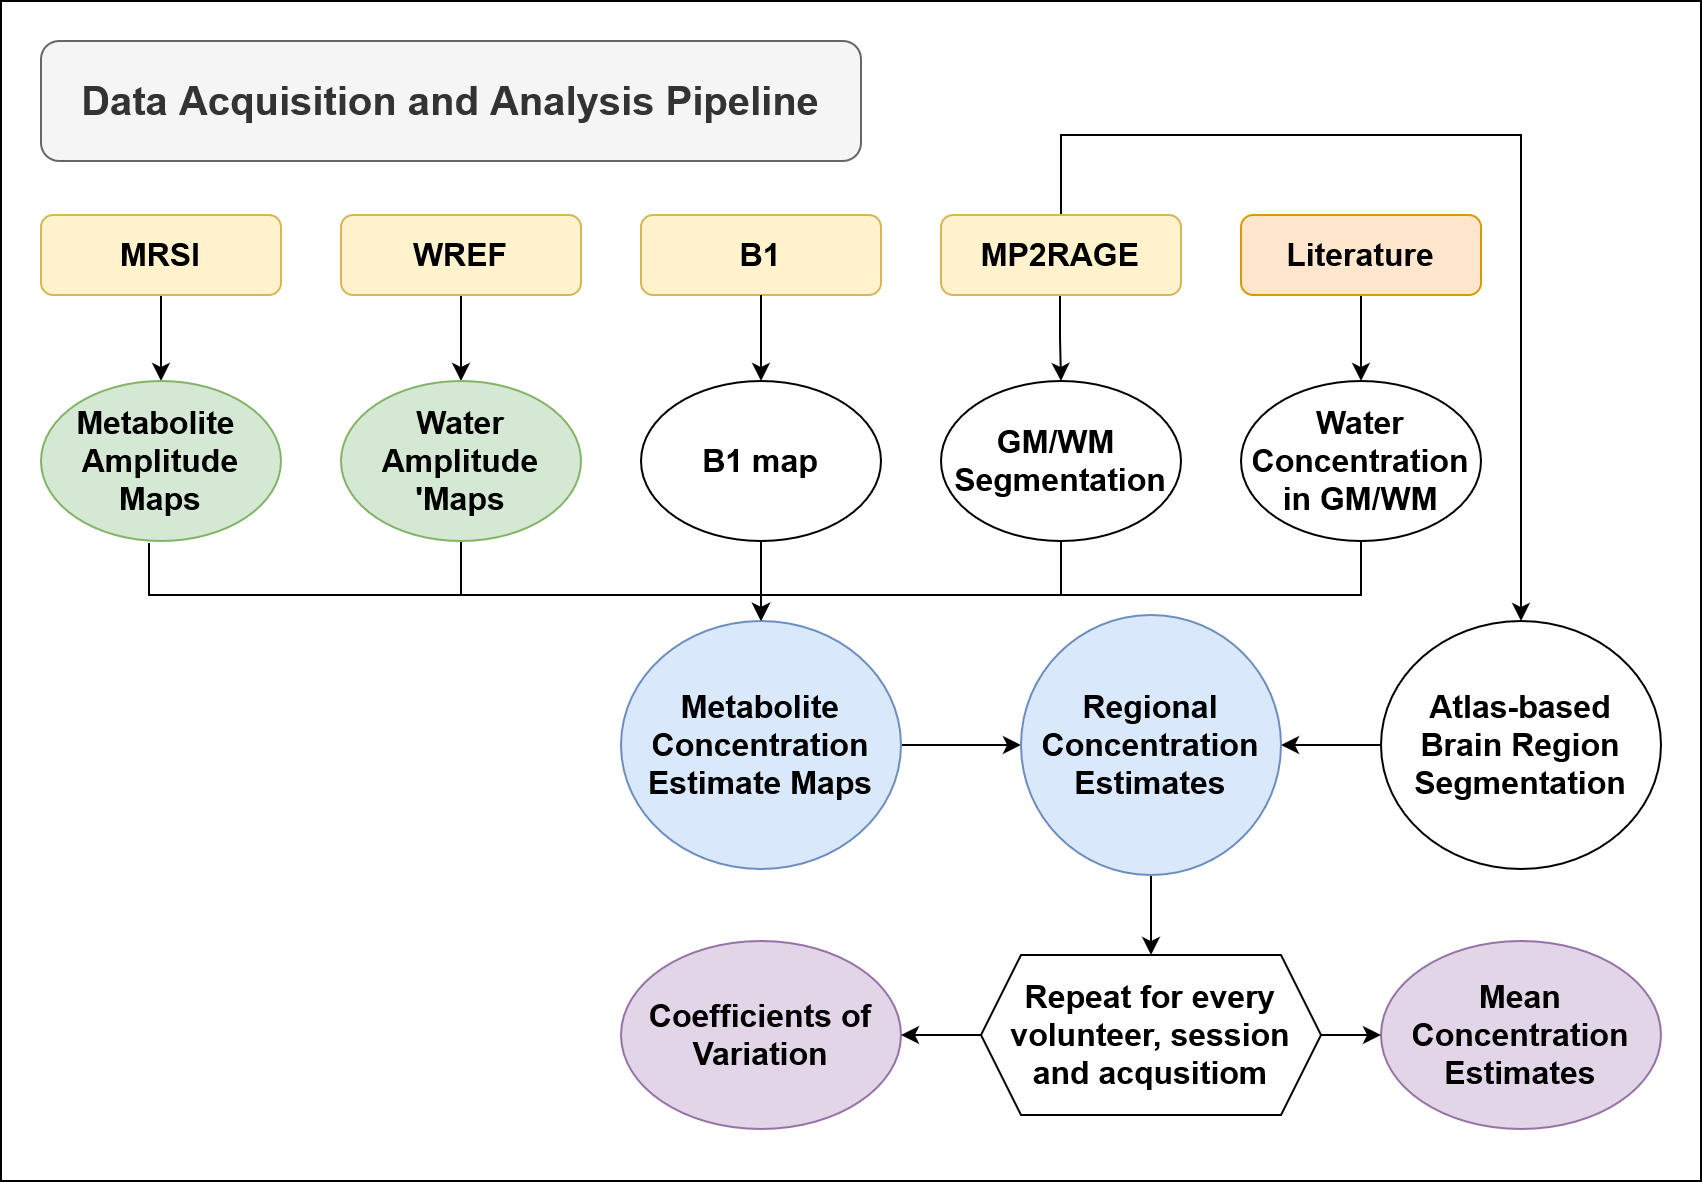
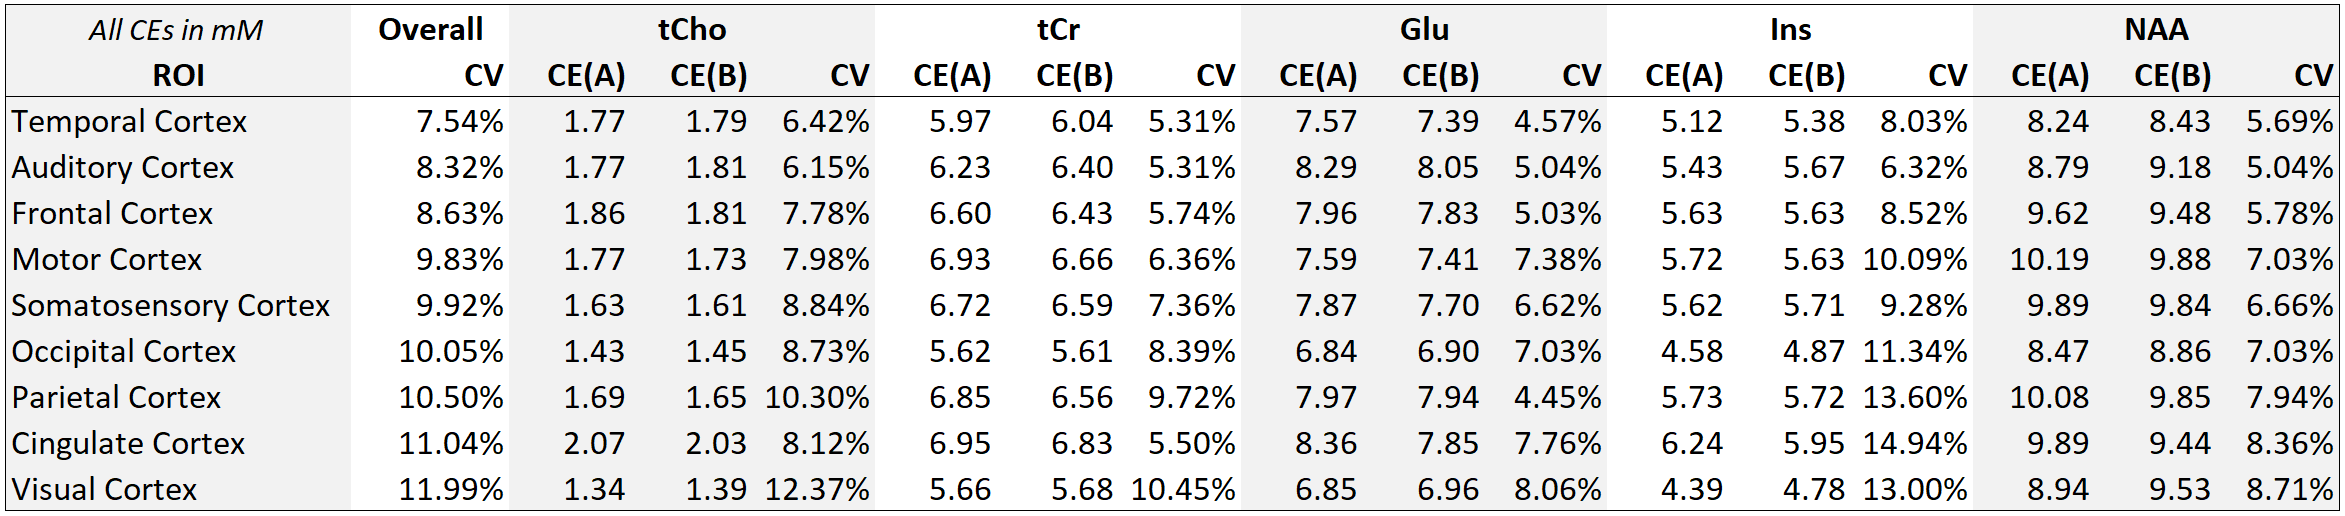
Table 1: Average concentration estimates and coefficients of variation in different brain regions. For nine regions, the average CV of all 12 metabolites is reported. Additionally, for five metabolites, the cohort-average CEs of sessions A and B and the cohort-average CV are shown. It should be noted that this cohort-average CV is not the CV between the cohort-average CEs, but instead it is the average over all CVs, which are based on the individual A and B scans of each volunteer.
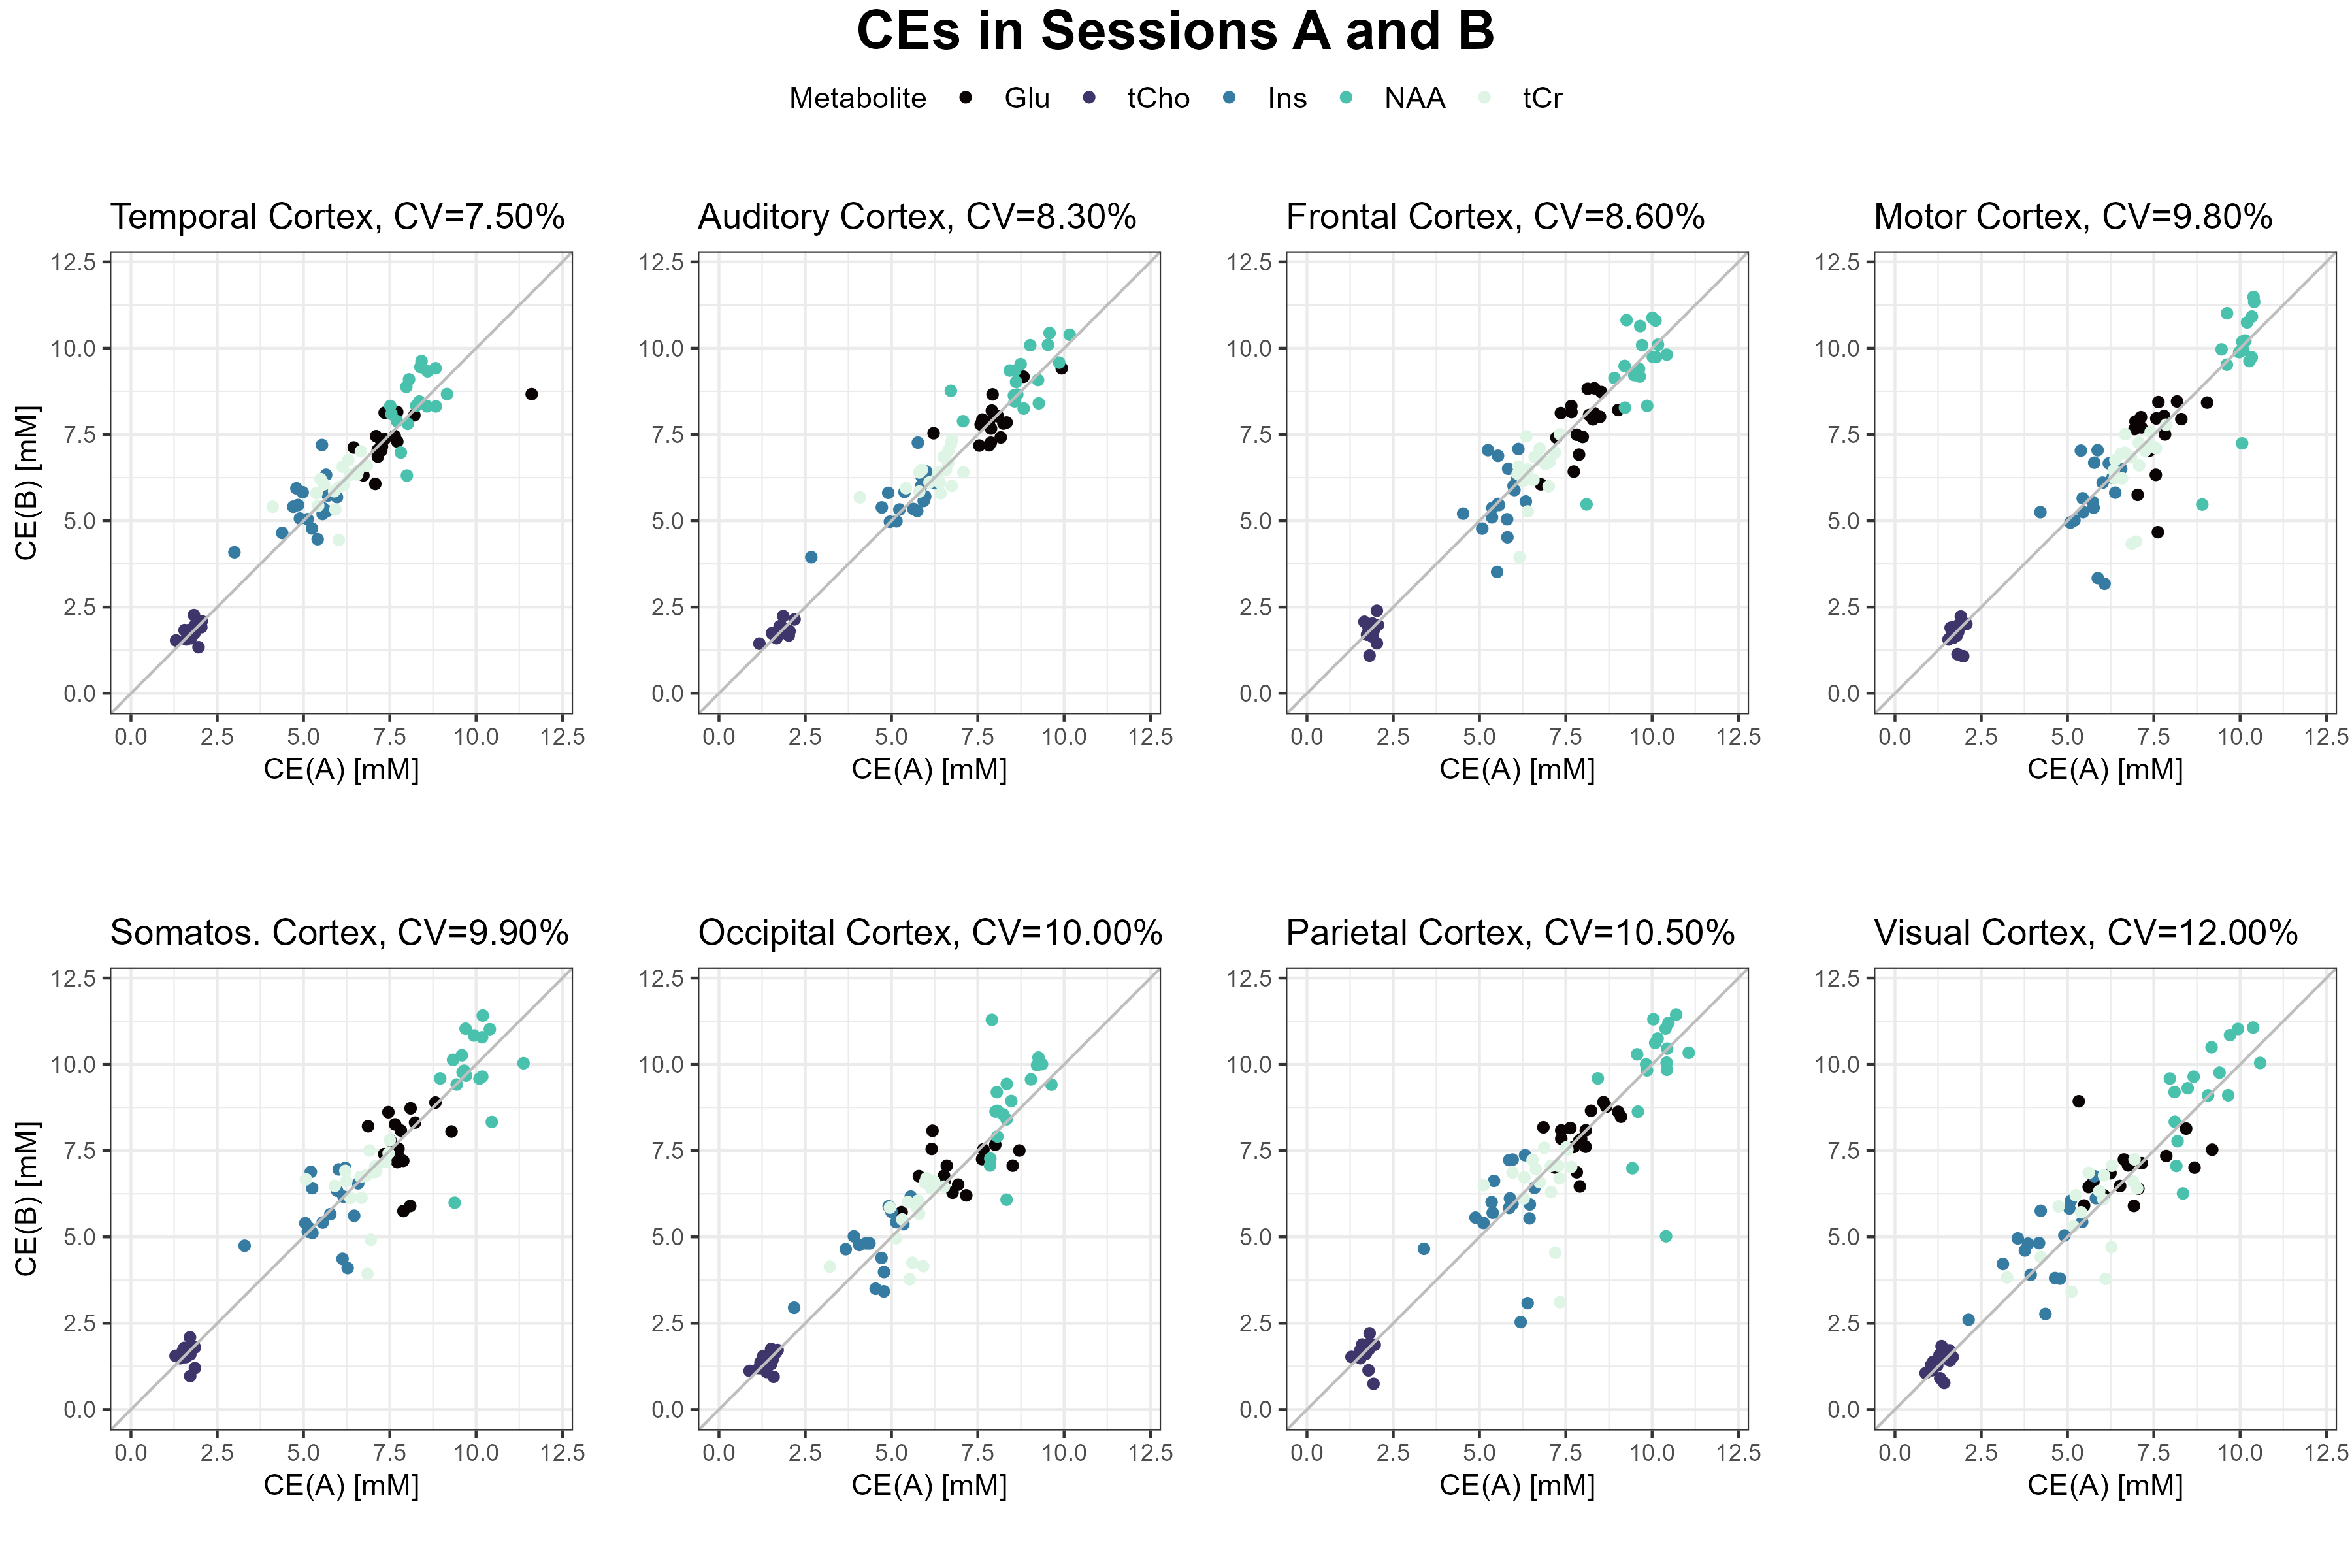
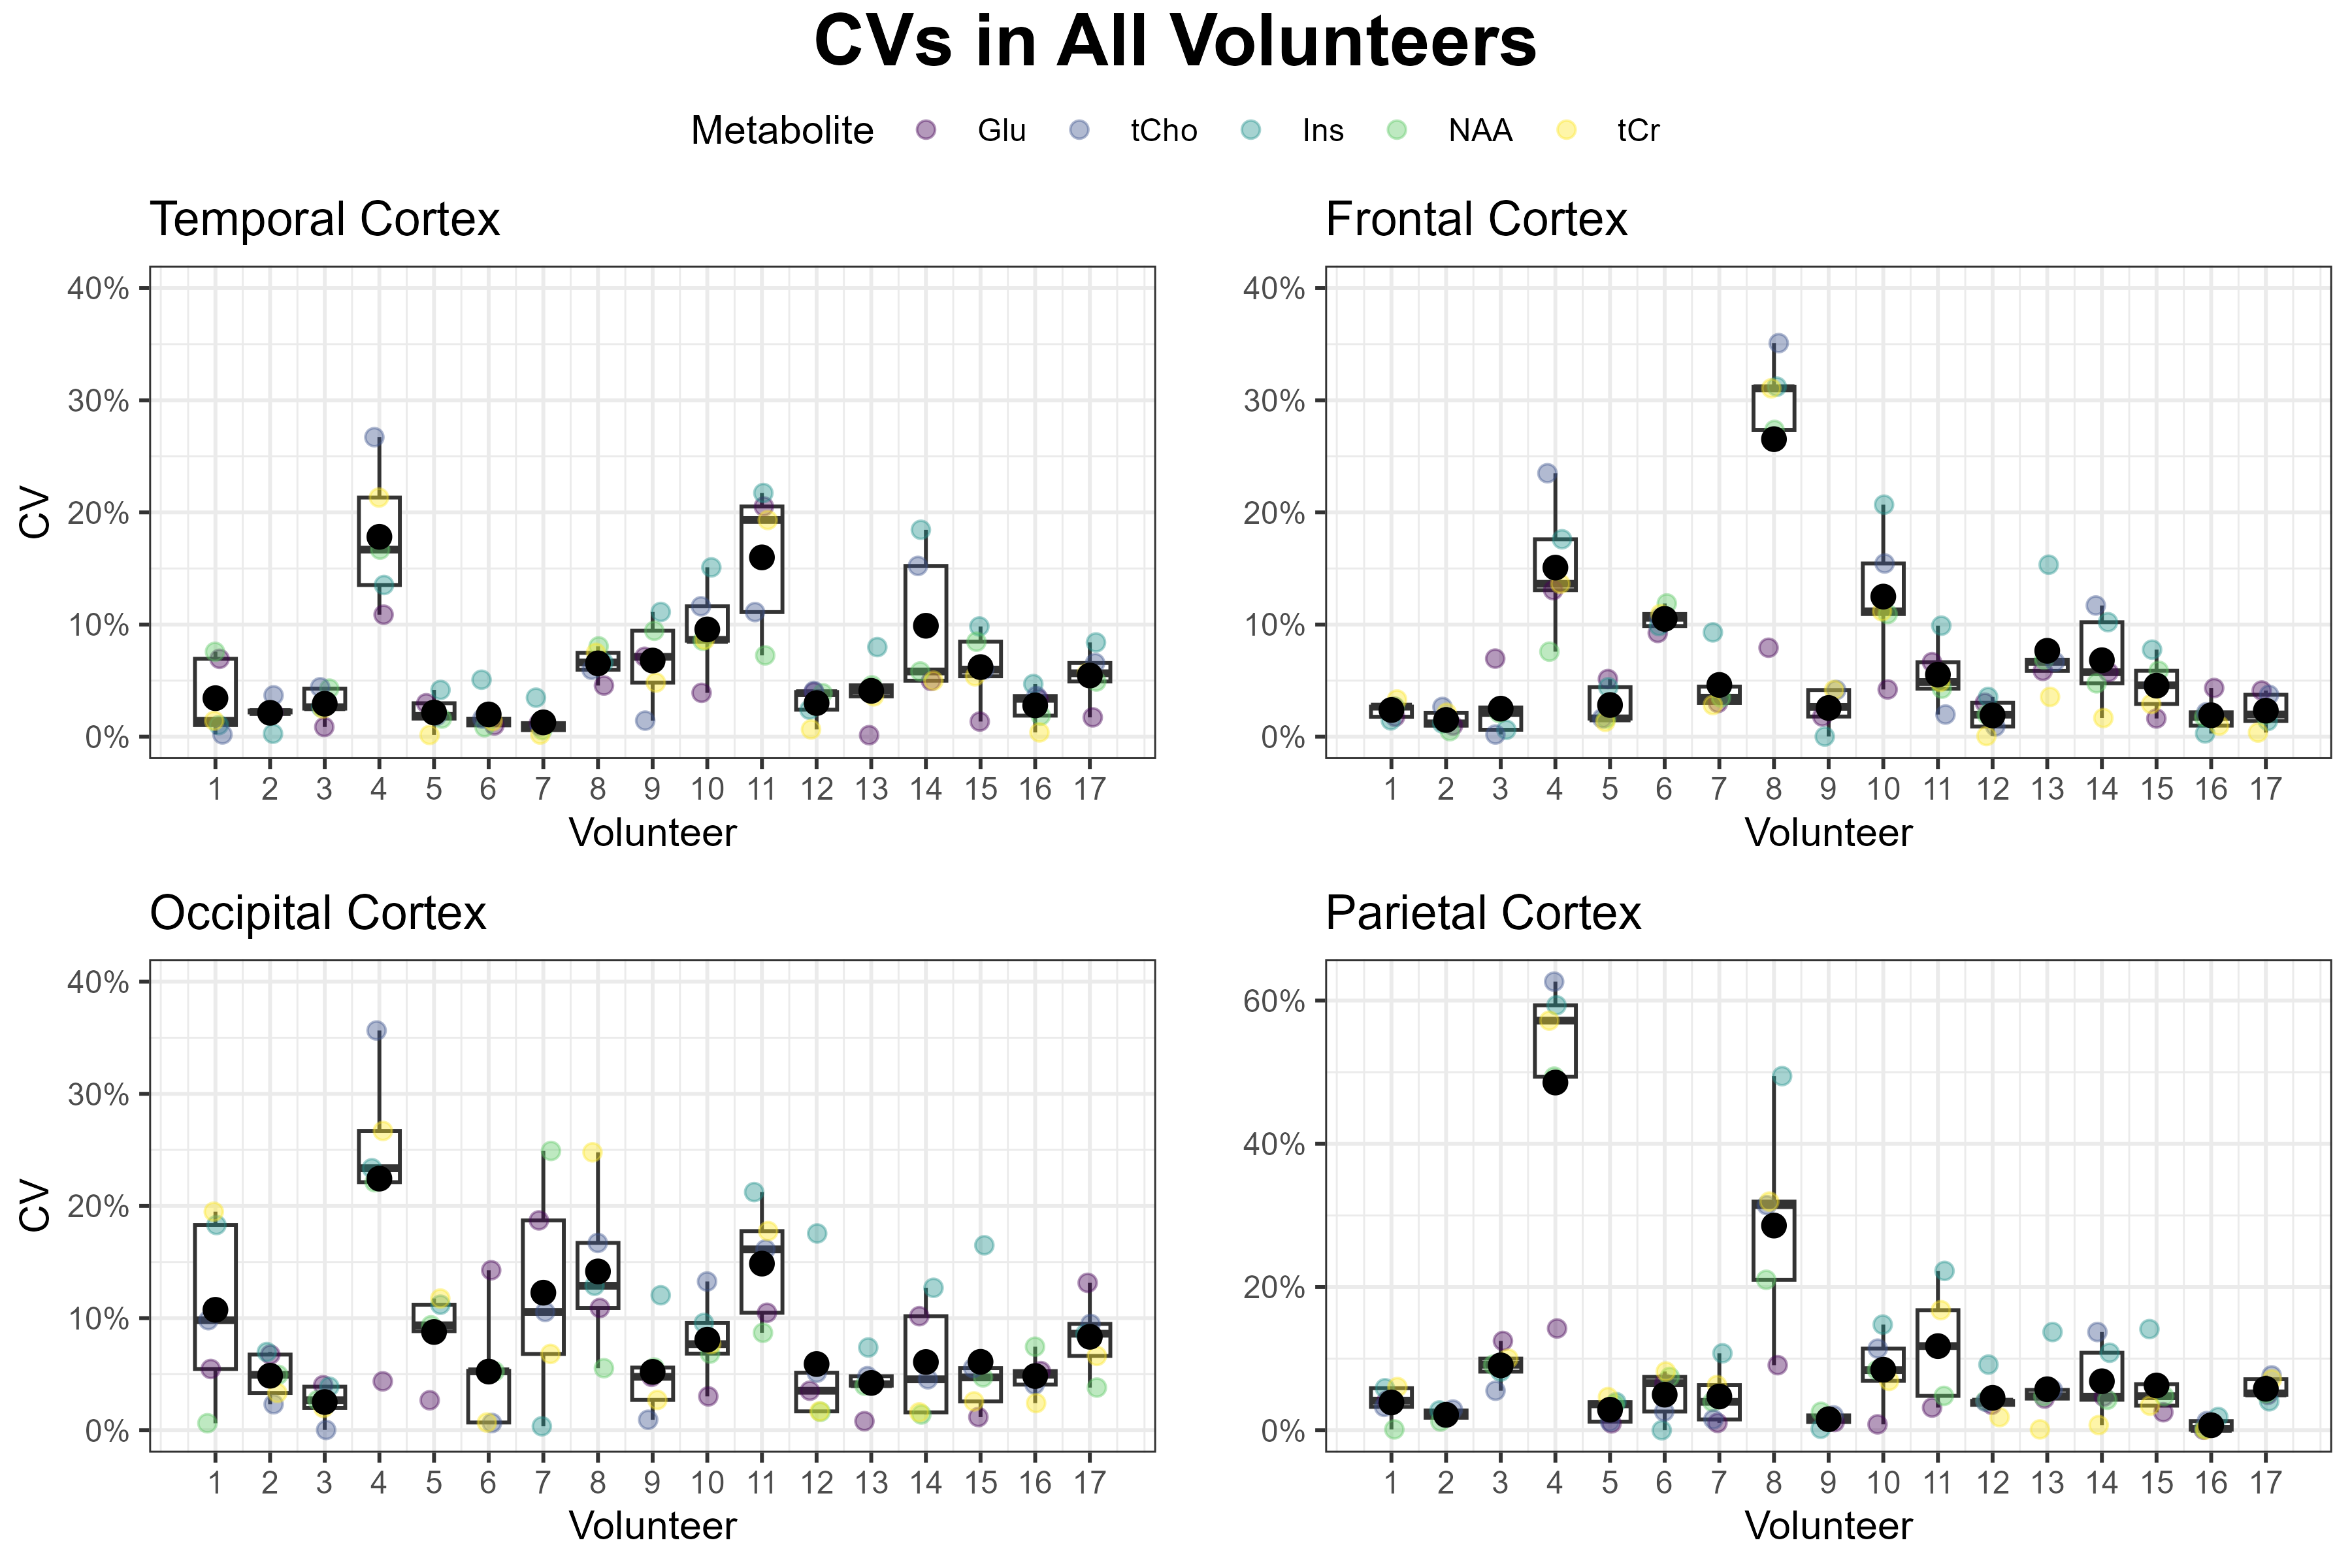
Figure 3: CVs in four exemplary brain regions containing five metabolites. One can see that the CVs are somewhat inconsistent between volunteers. For some, such as volunteers 4 or 8, there was high variability in the scans, which may have been caused by motion artifacts, and for others, CVs could be as low as 5% over all five metabolites in e.g. the temporal cortex.
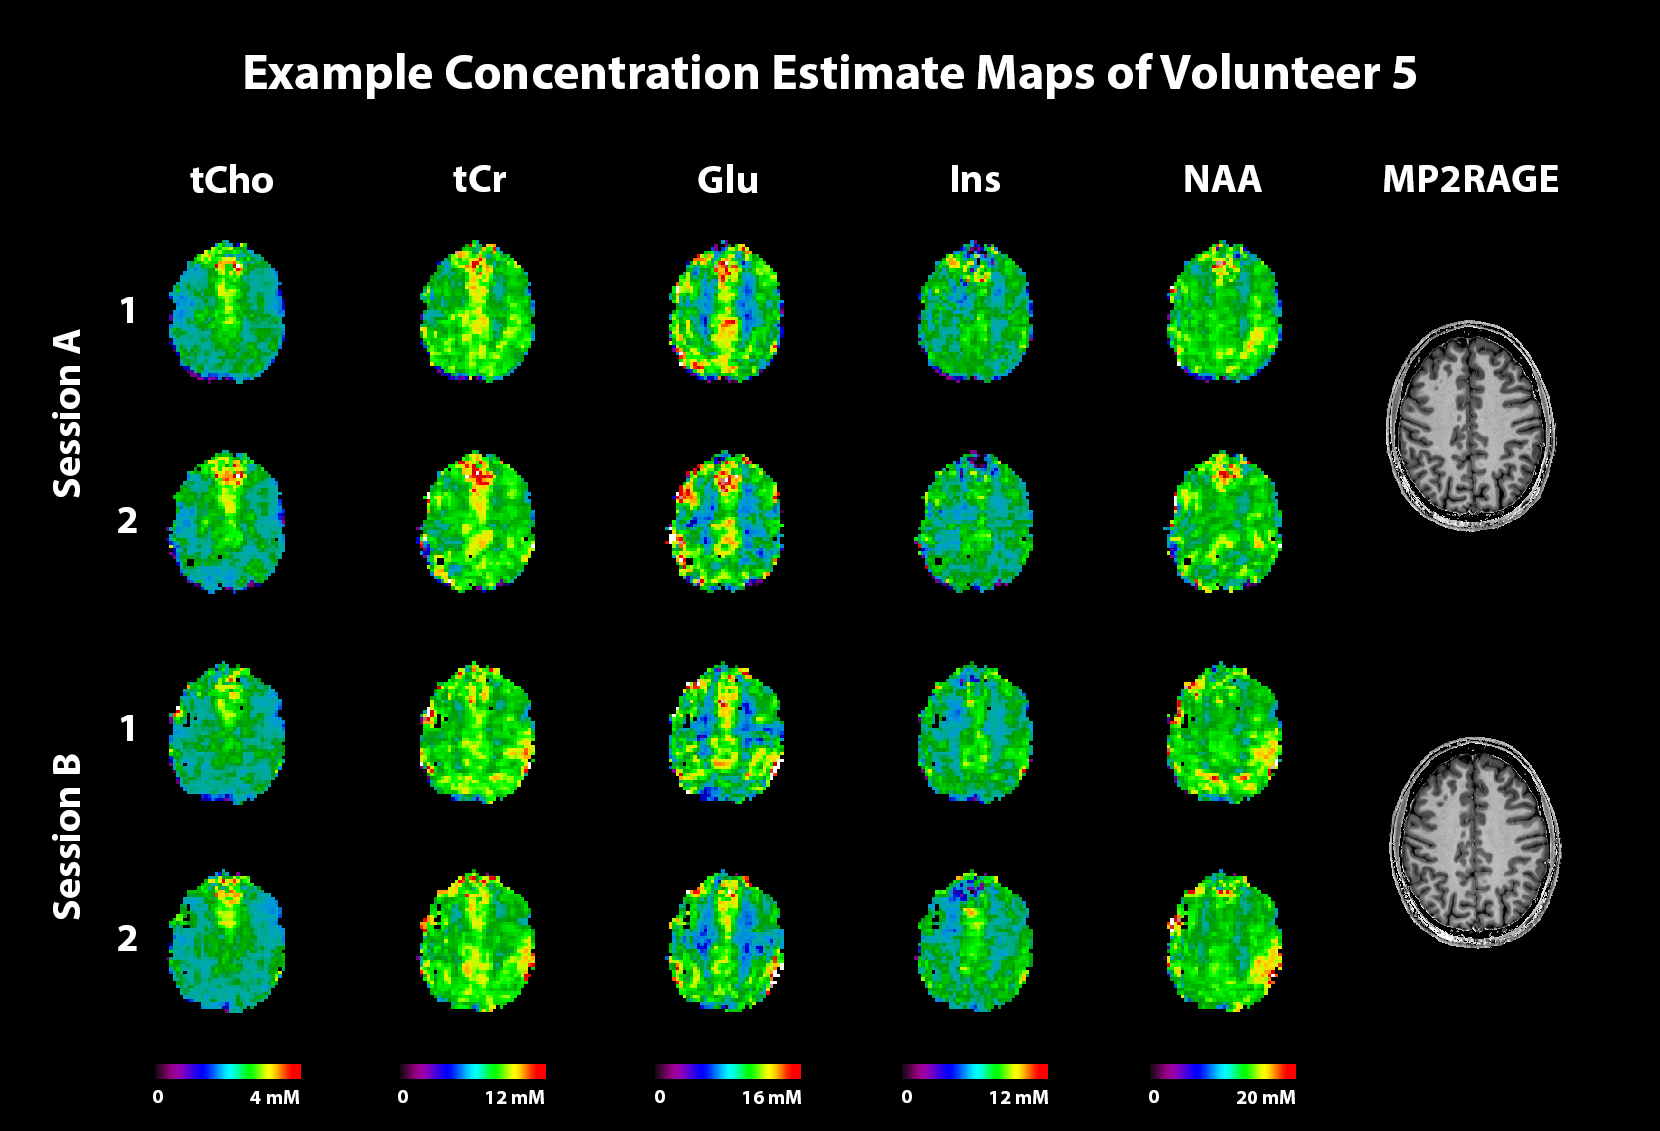
Figure 4: Example concentration estimate maps of volunteer 5. The four rows correspond to acquisitions A1, A2, B1 and B2, and show good overall consistency. It should be noted that sessions A and B are not coregistered, resulting in some misalignment between their respective slices. This, however, does not affect the brain atlas-based regional analysis.