1844
Simultaneous frequency and phase corrections of single-shot MRS data using cross-correlation1Radiology, University of Minnesota, Minneapolis, MN, United States
Synopsis
Keywords: Spectroscopy, Spectroscopy
Motivation: Preprocessing of MRS data is important in order to improve the spectral quality.
Goal(s): Here we propose a novel approach to simultaneously correct for frequency and phase drifts using cross-correlation technique.
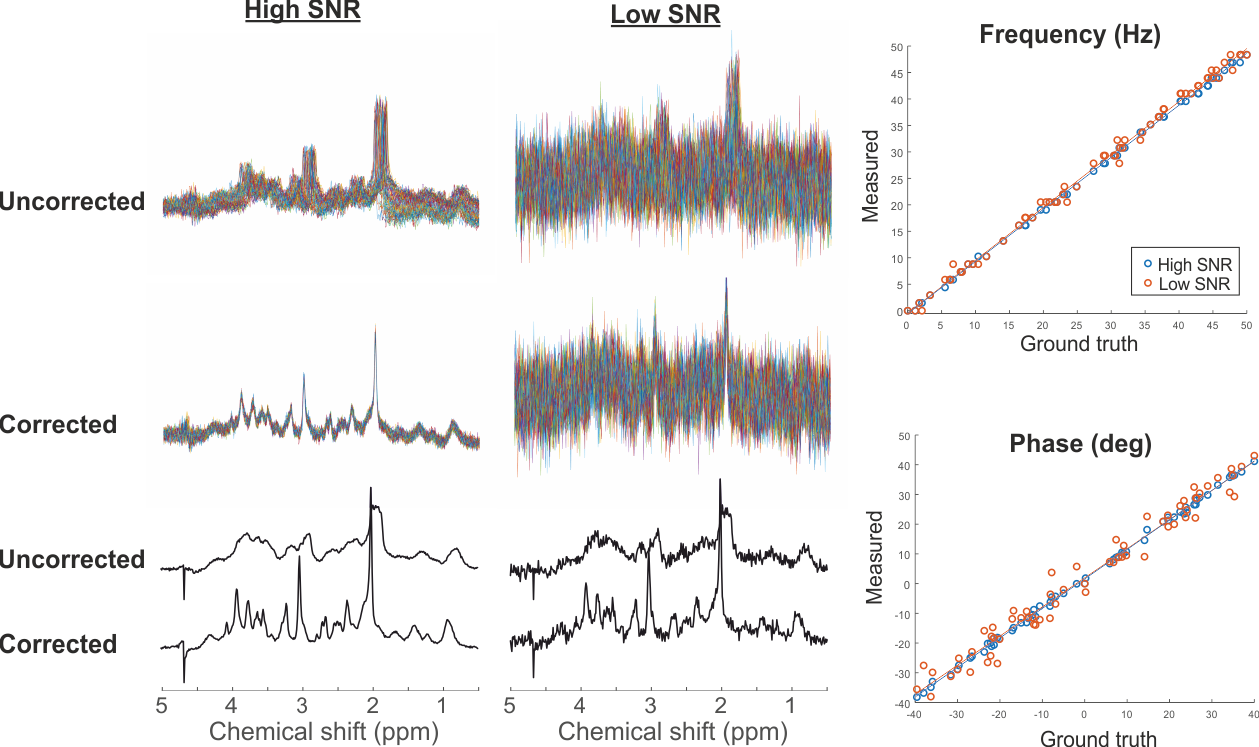
Approach: Random frequency and phase offsets were added to a previously acquired STEAM human data at 7T at two different noise levels.
Results: Results show that the proposed technique can accurately correct for both small and large frequency (<50 Hz) and phase drifts (±40 deg) even at low SNR levels. The technique was successfully demonstrated in a noisy MRS dataset acquired from a small volume-of-interest in the mouse brain.
Impact: A fast and robust technique which accurately correct for both small and large frequency and phase shifts in MRS data.
Introduction
During an MRS measurement, various imperfections are present which affects the frequency and phase of the spectroscopic data. These artifacts arise from physiological motion, subject motion, or system drift/instability. Preprocessing of MRS data is an important step to remove these artifacts before quantification as recently documented in the experts’ concensus paper1. Preprocessing improves the spectral quality, i.e. increase in SNR and spectra linewidth. This in turn results in reliable estimation of metabolites concentration (whether be relative or absolute) in addition having better quantification precision (reflected in lower CRLB).Several methods exist for retrospective correction of frequency and phase drifts whether be in time or frequency domain. These include spectral registration2, RATS3, or correlation4 methods which use metabolite peaks to align each transient to a reference spectrum for estimation and correction of the frequency and phase offsets.
The purpose of the current study is to propose another approach for simultaneous frequency and phase correction using cross-correlation technique. The technique termed spectral cross-correlation (SC) is successfully demonstrated on human and animal MRS data.
Methods
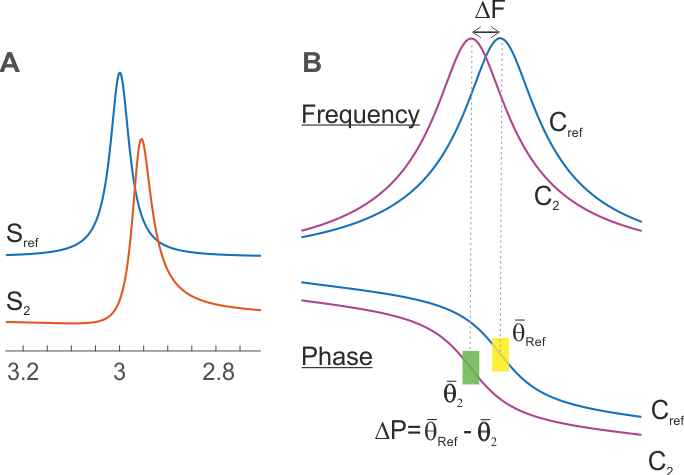
The proposed simultaneous frequency and phase alignment technique is based on cross-correlation which compares the similarities between two MRS spectra. Let’s consider Sn as the complex spectrum at transient n during the MRS measurement and SRef as the reference spectrum to which all spectra will be aligned. Here, SRef is the first transient in the scan. The reference cross-correlation signal (CRef) is first calculated using two identical spectra of SRef over a defined chemical shift range. Then the cross-correlation signal between SRef and Sn is computed at each transient (Cn). The frequency shift is determined by the shift in magnitude between the two cross-correlation signals (CRef and Cn). On the other hand, phase offset can be derived from the phase information of complex CRef and Cn signals. The phase offset is calculated as the difference of the mean phase over a few points where each magnitude signal is maximum. Note that only one cross-correlation is required per transient to calculate both frequency and phase offsets. SC was implemented in Matlab. Figure 1 demonstrates the principle of cross-correlation approach on a singlet peak.To validate the method, STEAM (TE/TM=8/32ms, 64 averages) MRS data from 7T was used. The data was processed using MRspa5 to remove any frequency and phase artifacts. Then random frequency (0 to 50Hz) and phase (±40°) offsets were added to each transient to generate a dataset. The mean SNR for each transient was 34±3 where SNR is defined as the ratio of the NAA amplitude to the RMS noise. The SNR of the dataset was further reduced by adding random Gaussian noise (individual SNR=6±1). Proposed SC approach was validated on these two datasets. The estimated frequency and phase offset errors were compared the ground truth values. LASER spectra (TE/TR=12.3/5000ms, 128 averages) from the mouse striatum was also used to demonstrate that the technique worked in a small VOI of 6μL.
Results
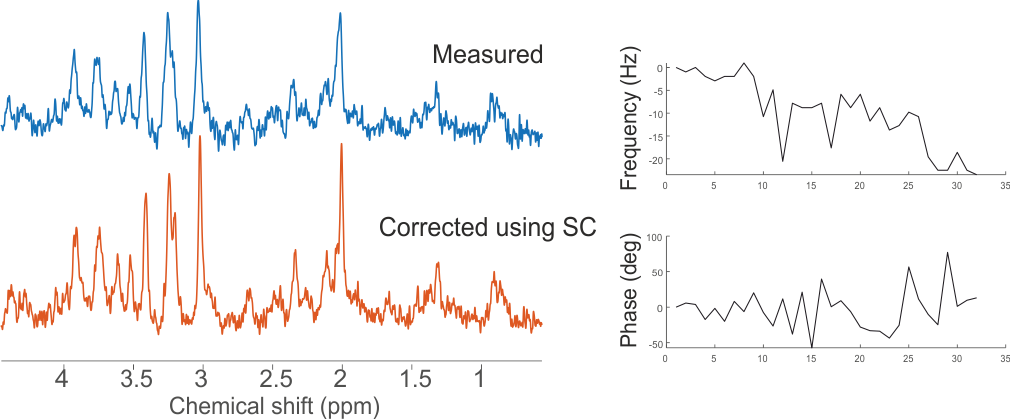
Figure 2 shows the STEAM data with imposed offsets before and after correcting for frequency and phase shifts using SC at two different SNR levels. In this case, the spectral region used by SC was between 1.8 to 3.5ppm. In the uncorrected cases, broad spectral pattern with unrecognizable metabolite signals are observed. After correction, high-quality MRS spectra were visible with narrower linewidth in the two datasets suggesting good frequency and phase alignments with SC. High correlation (r=0.99) was found between the ground truth and the estimated frequency and phase values when using low and high SNR single-shot data. Estimated frequency and phase errors were 1.0±0.5Hz and 1.6±0.8deg respectively for the high SNR and 0.8±0.7Hz 3.5±2.5deg respectively for the low SNR data.Figure 3 shows that the proposed SC approach also works on MRS data measured in the mouse brain with low SNR. An improvement of ~50% in SNR was found after SC with shifts of up to ~20Hz plus large phase offsets.
Discussion and Conclusion
The current study shows a novel approach to perform both frequency and phase correction using spectral cross-correlation. The technique can accurately correct for both small and large drifts in phase and frequency, even in noisy MRS data. Another study4 used correlation method where the normalized scalar product between the two spectra are maximized. Their method was iterative and as such slower than the currently proposed SC approach.In conclusion, SC is a robust and fast method which is insensitive to large offsets and can be incorporated in the preprocessing pipeline to improve spectral quality.
Acknowledgements
This work was supported by funding from the National Institutes of Health (NIH) R01 EB030000, P41 EB027061, and S10 RR025031.References
1. Near J. et al Preprocessing, analysis and quantification in single-voxel magnetic resonance spectroscopy: experts' consensus recommendations NMR Biomed . 2021 May;34(5):e4257. doi: 10.1002/nbm.4257. Epub 2020 Feb 21.
2. Near J. et al. Frequency and phase drift correction of magnetic resonance spectroscopy data by spectral registration in the time domain. Magn Reson Med. 2015 Jan;73(1):44-50. doi: 10.1002/mrm.25094. Epub 2014 Jan 16.
3. Wilson M. Robust retrospective frequency and phase correction for single-voxel MR spectroscopy. Magn Reson Med. 2019 May;81(5):2878-2886. doi: 10.1002/mrm.27605. Epub 2018 Nov 12. PMID: 30417937
4. Wiegers E.C. et al. Automatic frequency and phase alignment of in vivo J‑difference‑edited MR spectra by frequency domain correlation MAGMA. 2017 Dec;30(6):537-544. doi: 10.1007/s10334-017-0627-y. Epub 2017 Jun 1.
5. Deelchand DK. MRspa: Magnetic Resonance signal
processing and analysis. August 2018 version https://www.cmrr.umn.edu/downloads/mrspa/
Figures