1843
Linewidth and lineshape bias in modelled outcomes from GABA-edited 1H MRS1Department of Biological and Medical Psychology, University of Bergen, Bergen, Norway, 2Department of Clinical Engineering, Haukeland University Hospital, Bergen, Norway, 3Department of Radiology, University of Calgary, Calgary, AB, Canada, 4Hotchkiss Brain Institute, University of Calgary, Calgary, AB, Canada, 5Alberta Children's Hospital Research Institute, University of Calgary, Calgary, AB, Canada, 6Division of Psychiatry, Haukeland University Hospital, Bergen, Norway, 7Department of Radiology, Haukeland University Hospital, Bergen, Norway, 8Russell H. Morgan Department of Radiology and Radiological Science, The Johns Hopkins University School of Medicine, Baltimore, MD, United States, 9F. M. Kirby Research Center for Functional Brain Imaging, Kennedy Krieger Institute, Baltimore, MD, United States
Synopsis
Keywords: Spectroscopy, Spectroscopy
Motivation: The study addresses a gap in literature concerning the impact of spectral linewidth and lineshape differences on GABA+ estimates.
Goal(s): To assess the degree to which differences in linewidth/lineshape may confound GABA+ estimates.
Approach: In-vivo GABA+-edited spectra (N=222) were quantified with six modelling algorithms after applying varying degrees of Lorentzian and Gaussian linebroadening.
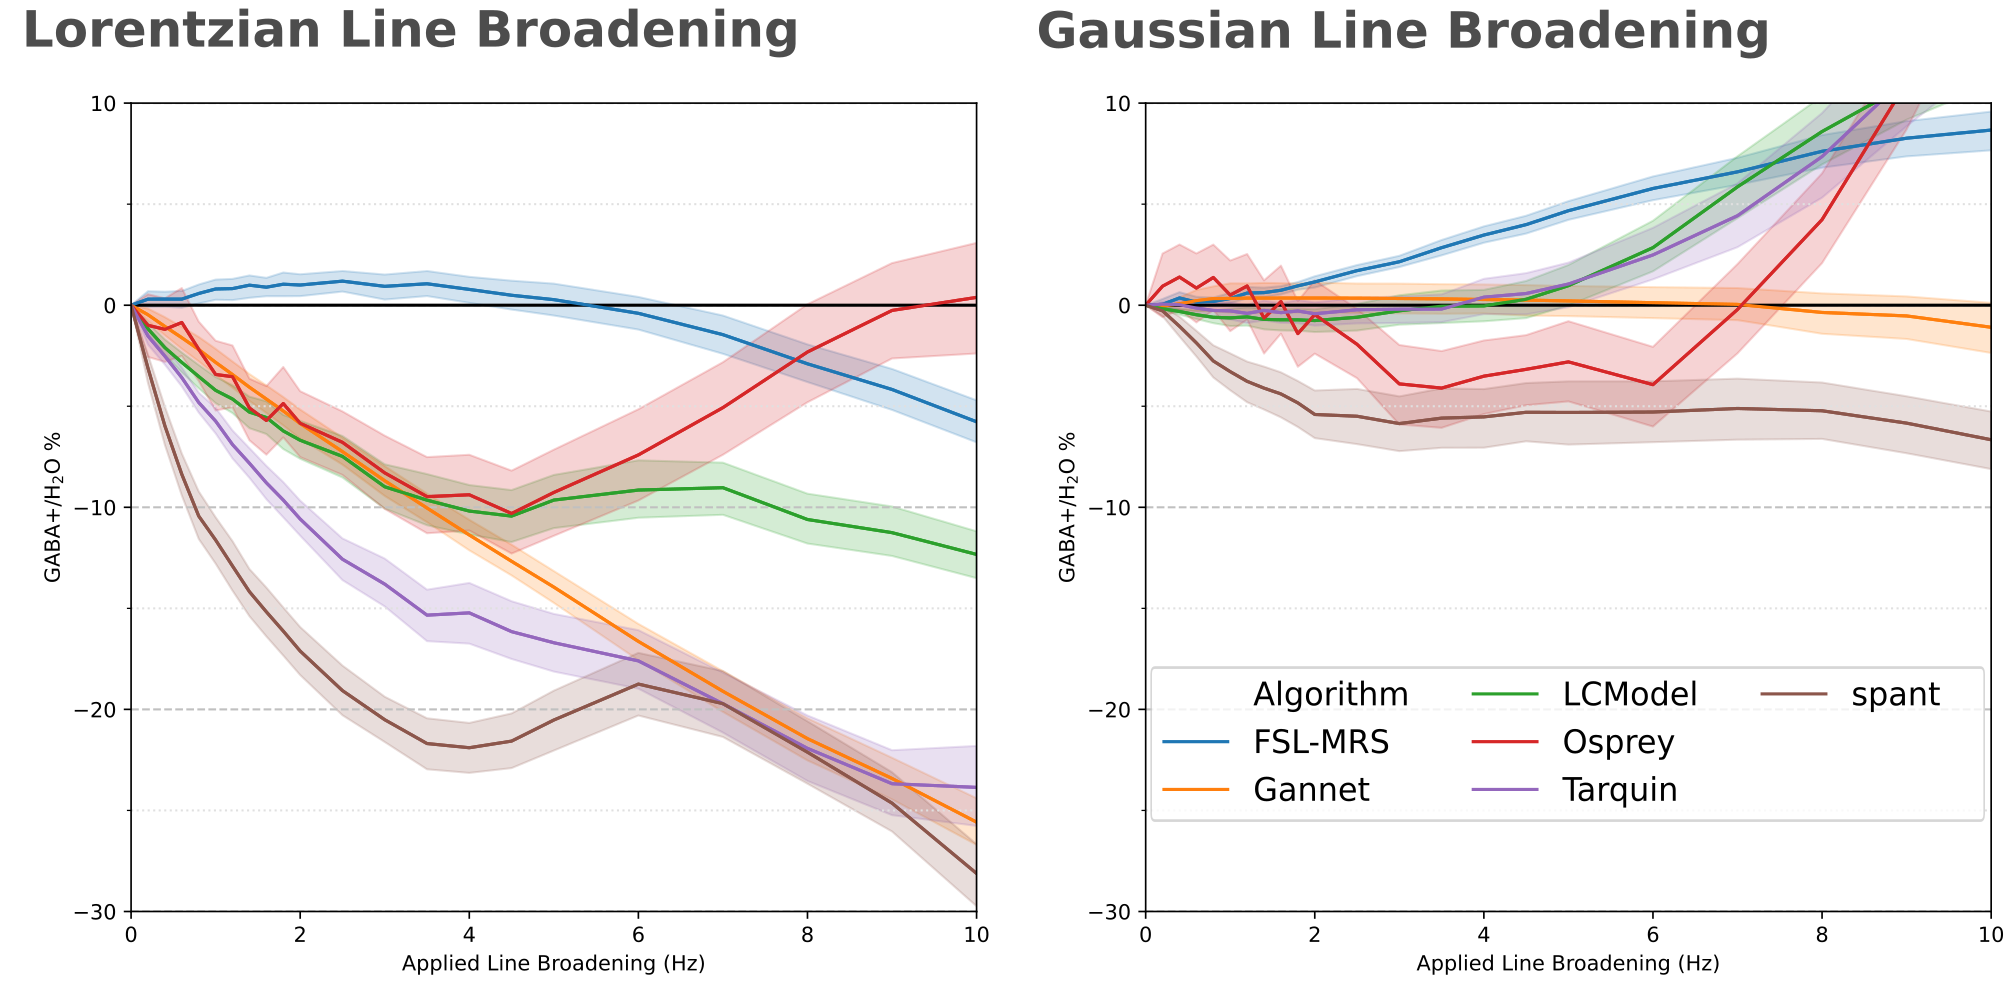
Results: Most algorithms showed strong negative associations between amount of Lorentzian linebroadening and GABA+ estimate (2-5% per Hz LB), consistently across datasets. Gaussian linebroadening showed contrasting, substantially weaker associations.
In functional applications and cases of differing T2 relaxation between regions or subject groups, these results indicate a potentially significant confound.
Impact: Comparing metabolite concentration estimates across different anatomical regions, subject groups or experimental conditions requires appropriate handling of differences in linewidth and linebroadening mechanisms. We demonstrate that several modelling algorithms have linebroadening biases, differing by lineshape, that may confound findings.
Introduction
J-difference edited MRS is widely used to study GABA levels in the human brain. Differences in (effective) relaxation rates may be expected across brain regions, groups (age/pathology), or, in functional MRS (fMRS) studies1, in relation to blood-oxygen level dependent (BOLD) response to a task. While pure T2 effects give Lorentzian broadening, T2* effects associated with B0 inhomogeneity have differential effects on lineshape, which contemporary modelling algorithms account for with convolution kernels and/or Gaussian linebroadening (LB), assuming normally-distributed B0 in the MRS voxel.Linewidth- and lineshape-related effects have been demonstrated previously2,3, albeit mostly for pure Lorentzian effects on conventional PRESS data. A systematic investigation for GABA-edited spectra (also considering inhomogeneity effects) quantified with contemporary algorithms is lacking.
Methods
We pre-processed GABA+-edited 1H-MRS data from 222 healthy controls across 20 sites4 before filtering to simulate varying degrees of Lorentzian and Gaussian line broadening (LB): from 0 to 2 Hz in steps of 0.2 Hz, 2 to 5 Hz in steps of 0.5 Hz, and 5 to 10 Hz in steps of 1 Hz. SNR effects were not considered. Filtered metabolite spectra were modelled with six different algorithms: FSL-MRS, Gannet, LCModel, Osprey, spant and Tarquin. Primary outcome measures were the relative differences in concentration estimates compared to the unfiltered estimate (scaled to unfiltered water, per subject, per algorithm), along with their rate-of-change with respect to linewidth.Results
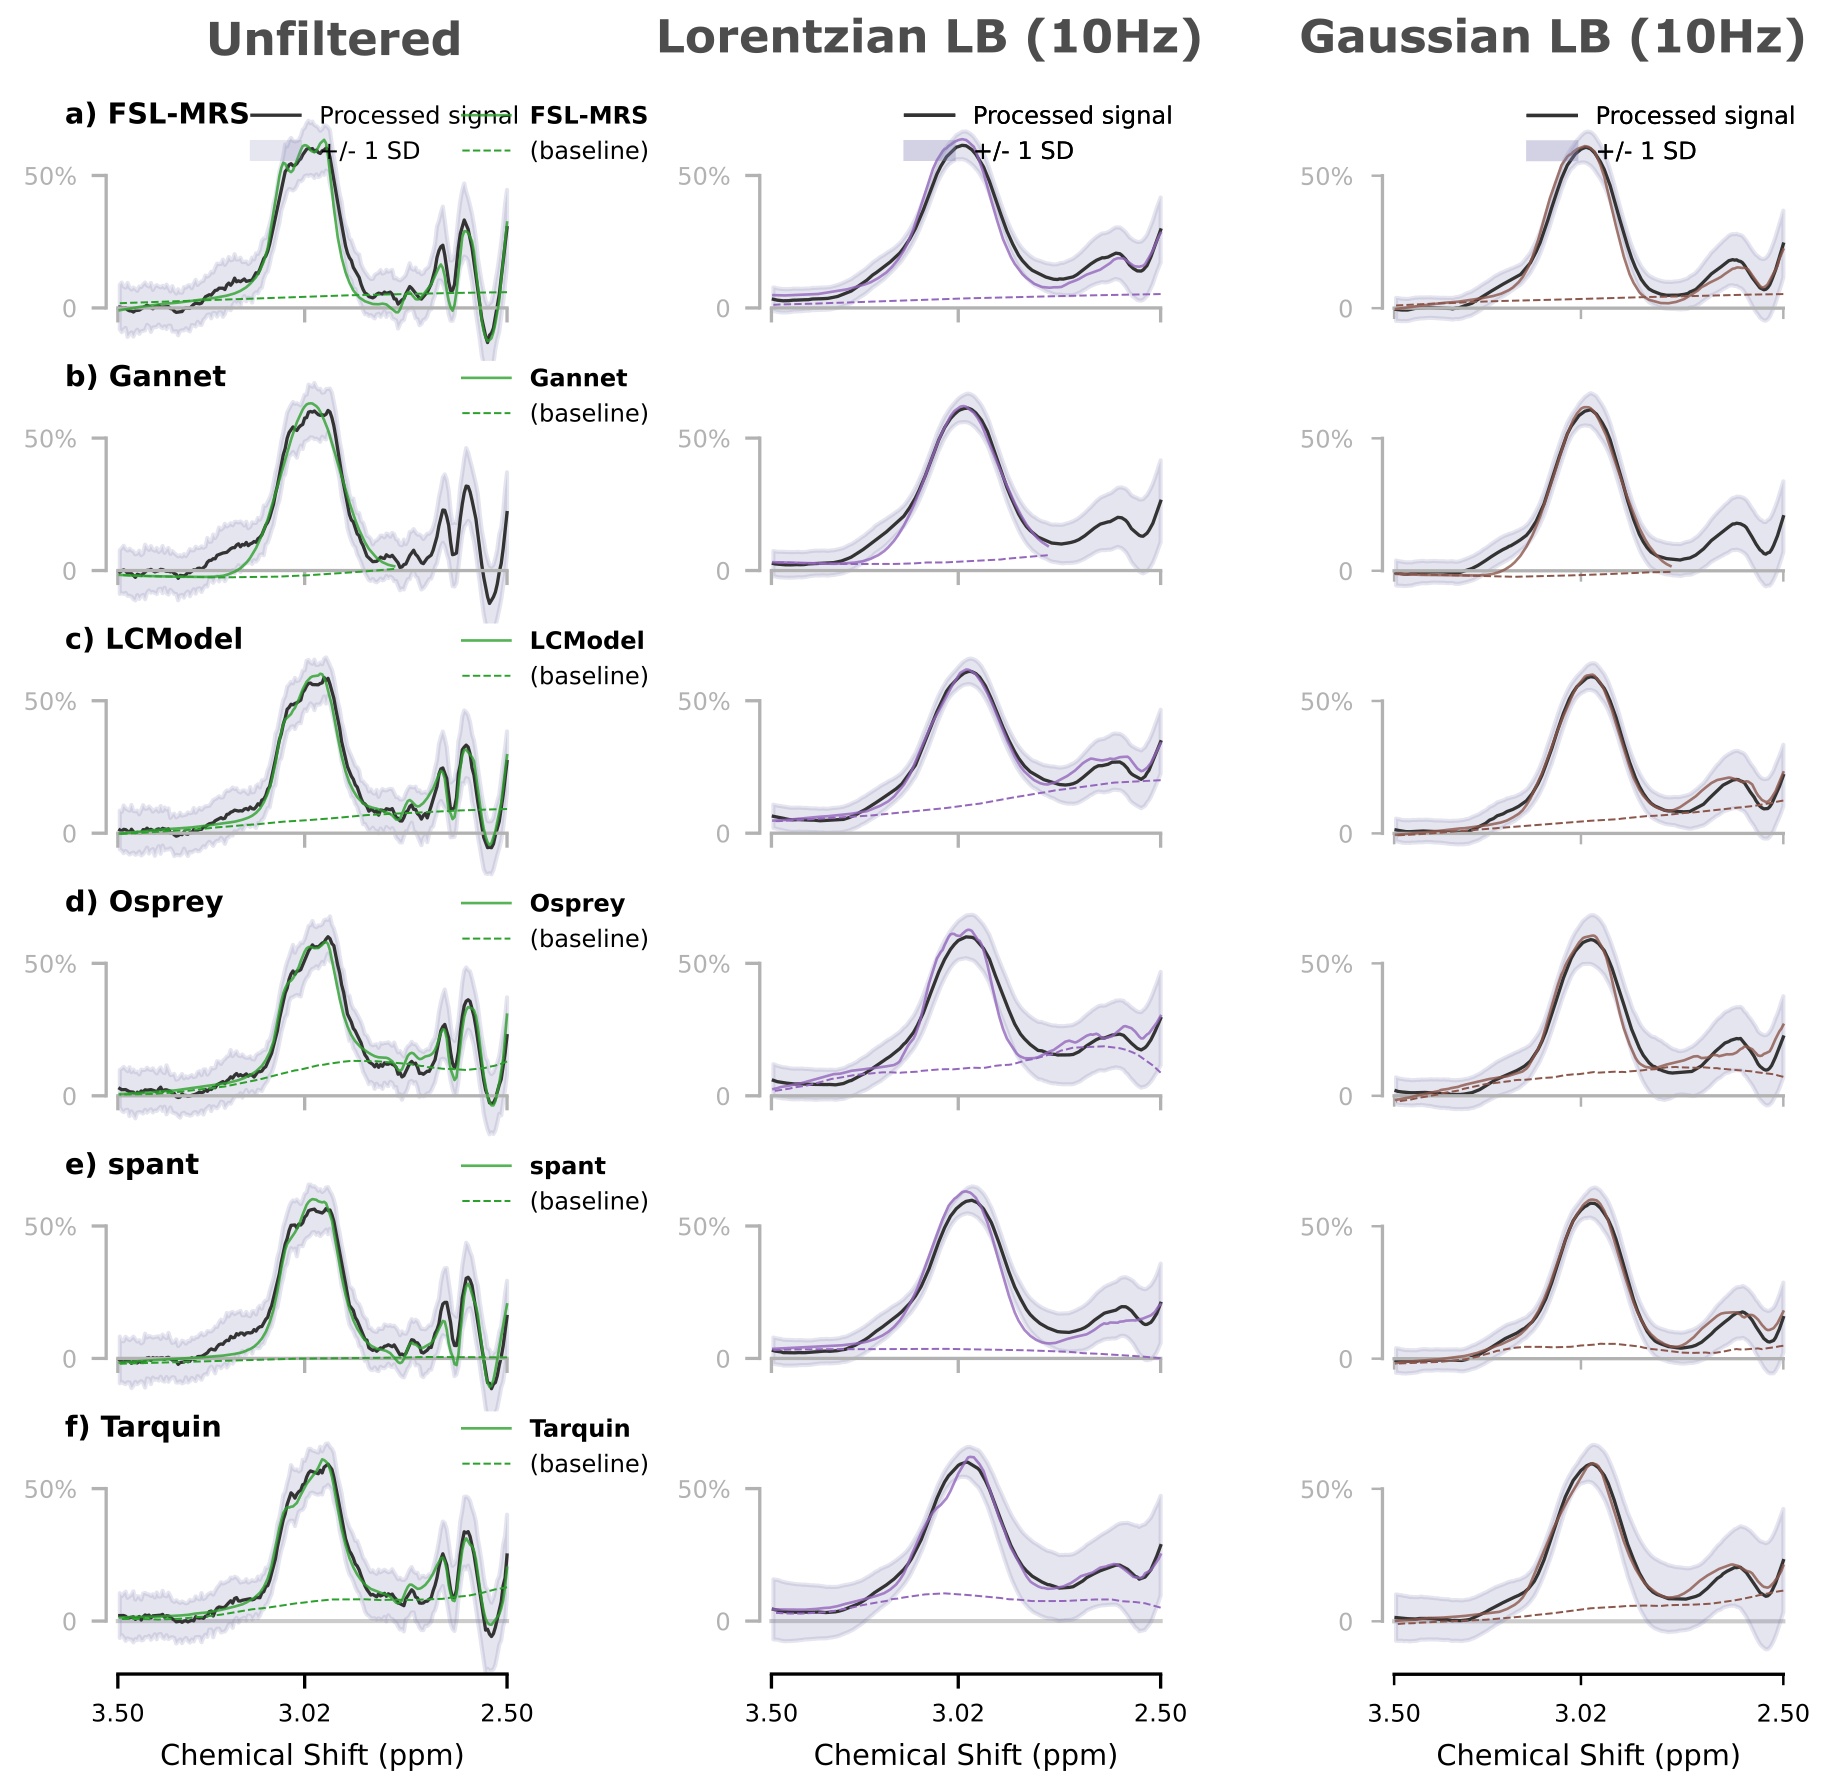
Fit outcomes are illustrated in Figure 1 for unfiltered and high-LB cases. Baseline estimates after Gaussian LB show less variability compared to the Lorentzian LB case, for several algorithms.Figure 2 shows strong negative associations between GABA+ estimates and Lorentzian linewidth (2-5 % per Hz LB) across most algorithms, even for small changes in linewidth. In contrast, the association between Gaussian LB and GABA+ was often positive, but substantially weaker (<1 % per Hz LB), particularly for moderate (<4 Hz) LB.
Discussion and Conclusions
We show that fitting algorithms exhibit strong associations between linewidth and concentration estimate in response to Lorentzian LB (T2 differences). Gaussian LB (T2*/inhomogeneity) shows less impact on quantification results, particularly for moderate LB. These findings highlight the ongoing need to account for potential linewidth differences between samples or conditions – and furthermore highlight the importance of identifying appropriate strategies to achieve this.Interestingly, Gaussian and Lorentzian broadening appear to have contrasting effects on GABA+ estimation. We suggest that (a) differentiating between metabolite and background components is more difficult for the broad “wings” of a Lorentzian distribution, causing part of that metabolite signal to be incorrectly ascribed to baseline, and (b) that Gaussian filtering better normalises higher-order effects (asymmetry) in the metabolite spectrum.
A specific case when linewidth matching will impact results is fMRS, where the BOLD effect will impact the spectral lineshape between conditions. A common approach in the literature is exponential multiplication in the time domain: a pure Lorentzian filter. This work demonstrates that this approach is problematic if the effects to be corrected for are mixed T2/T2* (as in the fMRS case) or predominantly Gaussian (tissue/B0 inhomogeneity) in nature. In fact, we show the Lorentzian filter may introduce a stronger estimation bias than the one it is intended to correct.
We suggest if matching is to be performed, a judicious choice of filter is essential – either based on theoretical expectations or preferably experimental modelling (Voigt fit parameters5 or a deconvolution approach6). Note that linebroadening of experimental data must be used with caution, as it may violate the i.i.d. noise assumptions of least-squares modelling algorithms and invalidate uncertainty estimates (CRLB) (although the severity of these violations is currently unknown), and does not account for different relaxation parameters across model components. Linewidth- and lineshape-matching of the (noise-free) basis sets7,8 has been proposed to address these concerns.
A more generalisable solution would be to routinely incorporate linewidth into statistical analysis of modelling outcomes.
In conclusion, we highlight the need for rigorous consideration of linewidth differences between samples or conditions, and for ensuring that appropriate strategies for accounting for these differences are adopted.
Acknowledgements
No acknowledgement found.References
1. Zhu XH, Chen W. Observed BOLD effects on cerebral metabolite resonances in human visual cortex during visual stimulation: A functional 1H MRS study at 4 T. Magn Reson Med. 2001;46(5):841-847. doi:10.1002/mrm.1267
2. Marjańska M, Deelchand DK, Kreis R, et al. Results and interpretation of a fitting challenge for MR spectroscopy set up by the MRS study group of ISMRM. Magnetic Resonance in Med. 2022;87(1):11-32. doi:10.1002/mrm.28942
3. Mangia S, Tkáč I, Gruetter R, et al. Sensitivity of single-voxel 1H-MRS in investigating the metabolism of the activated human visual cortex at 7 T. Magnetic Resonance Imaging. 2006;24(4):343-348. doi:10.1016/j.mri.2005.12.023
4. Mikkelsen M, Barker PB, Bhattacharyya PK, et al. Big GABA: Edited MR spectroscopy at 24 research sites. NeuroImage. 2017;159:32-45. doi:10.1016/j.neuroimage.2017.07.021
5. Marshall I, Higinbotham J, Bruce S, Freise A. Use of voigt lineshape for quantification of in vivo 1H spectra. Magn Reson Med. 1997;37(5):651-657. doi:10.1002/mrm.1910370504
6. Maudsley AA. Spectral Lineshape Determination by Self-Deconvolution. Journal of Magnetic Resonance, Series B. 1995;106(1):47-57. doi:10.1006/jmrb.1995.1007
7. Xiao Y, Lanz B, Lim S, Tkáč I, Xin L. Improved reproducibility of γ‐aminobutyric acid measurement from short‐echo‐time proton MR spectroscopy by linewidth‐matched basis sets in LCModel. NMR in Biomedicine. Published online October 15, 2023:e5056. doi:10.1002/nbm.5056
8. Hong D, van Asten JJA, Rankouhi SR, Thielen JW, Norris DG. Effect of linewidth on estimation of metabolic concentration when using water lineshape spectral model fitting for single voxel proton spectroscopy at 7 T. Journal of Magnetic Resonance. 2019;304:53-61. doi:10.1016/j.jmr.2019.05.002Figures