1842
Metabolic Atlas of the Human Cerebrum derived from 1H MRSI at 9.4T1UHF MRI, Max Planck Institute for Biological Cybernetics, Tuebingen, Germany, 2Max Planck Institute for Biological Cybernetics, Tuebingen, Germany, 3UT Southwestern Medical Center, Dallas, TX, United States
Synopsis
Keywords: Spectroscopy, Brain, MRSI
Motivation: To provide a metabolic reference atlas for brain metabolite concentrations.
Goal(s): Derive regional metabolite concentration estimates from the human brain.
Approach: Brain 1H MRSI data were acquired from 10 healthy controls and quantitative metabolite maps were combined via transformation into MNI space to derive median metabolite maps. Regional metabolite concentration estimates were derived.
Results: Brain metabolite maps and regional concentrations for 12 human brain metabolites have been derived.
Impact: A reference standard for metabolic brain MRI was established.
Introduction
Molecular imaging of the human brain using proton magnetic resonance spectroscopic imaging (1H MRSI) offers a unique opportunity to explore metabolite distributions across the human brain as well as estimate concentrations of these metabolites in multiple brain regions. Previous work using the ultra-high field (UHF) strength of 9.4 T has invested efforts to develop a reliable free induction decay (FID) 1H MRSI sequence (Nassirpour et al., 2016). Furthermore, 9.4 T studies have investigated full brain reproducibility (Ziegs et al., 2023) and single slice quantitative analysis (Wright et al., 2022). This work builds upon previous developments and combines 1H MRSI data sets from a cohort of healthy volunteers for the first time at 9.4 T to showcase how MRSI could be utilized in clinical studies where comparisons between healthy controls and diseased cohorts are researched and to derive a metabolic reference atlas of the healthy human brain.Methods
10 healthy volunteers were measured on a 9.4 T whole body scanner (Siemens Magnetom, Erlangen, Germany) after signed agreement in line with local IRB regulations. High-resolution (0.6 x 0.6 x 0.6 mm3) anatomical MP2RAGE images were acquired at the beginning of each scan session (TA = 11 min). Metabolite and water reference data were acquired with an FID MRSI sequence using an acquisition delay (TE*) of 1.3 ms, a TR of 300 ms, a flip angle of 47, and elliptical shuttering. Metabolite spectra utilized an optimized water suppression scheme with three unmodulated Hanning-filtered Gaussian pulses (BW = 180 Hz, duration = 5 ms) with flip angles of 90, 79.5, and 159; the inter-pulse delay between all pulses was 20 ms. MRSI and water reference data were acquired with a 6 x 6 x 6 mm3 resolution. For a slice dimension of 210 x 210 x 6 mm3 the acquisition time (TA) was approximately 4.5 min; resulting in approximately 9 min per slice.1H MRSI data were reconstructed and pre-processed with custom developed MATLAB scripts and fitted in LCModel (Provencher, 2001) from 0.8 to 4.2 ppm using a simulated basis set with 12 metabolites plus a simulated MM spectrum (MMAXIOM, (Wright, Murali-Manohar, et al., 2021) to account for MM contributions. After fitting, data were quantified using a voxel-specific correction method as described in (Wright et al., 2022) yielding metabolite maps in mmol kg-1 and mM (presented in Supporting Information).
Following quantification, data were written to the nifti file format (.nii) for linear coregistration calculations to be performed in FSL (Jenkinson et al., 2012). Quantified data were coregistered to the MNI152 Human Brain atlas (2mm resolution) using FSL FLIRT. Brain regions were partitioned using three atlases (Harvard-Oxford maximum probability cortical atlas [2 mm], Harvard-Oxford maximum probability subcortical atlas [2 mm], and Johns Hopkins University, International Consortium for Brain Mapping template [2mm], and used to calculate concentrations for eight regions in the brain.
Results
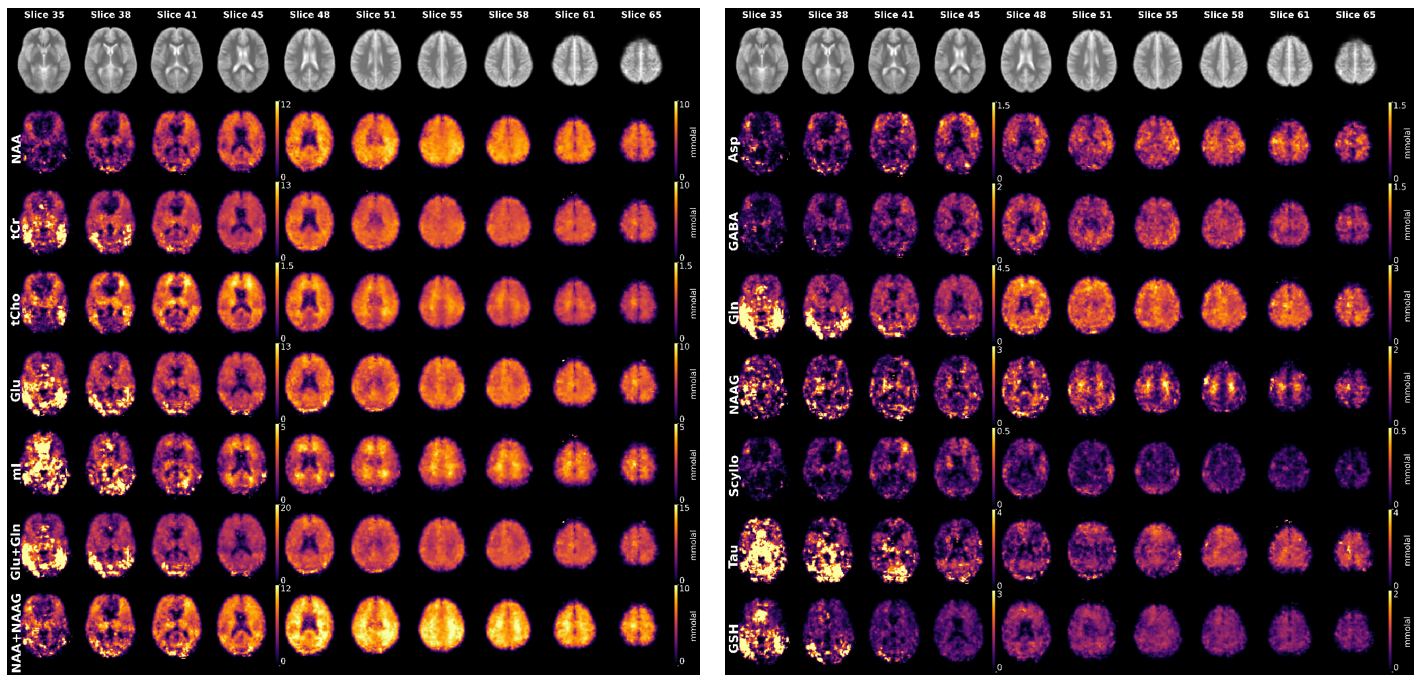
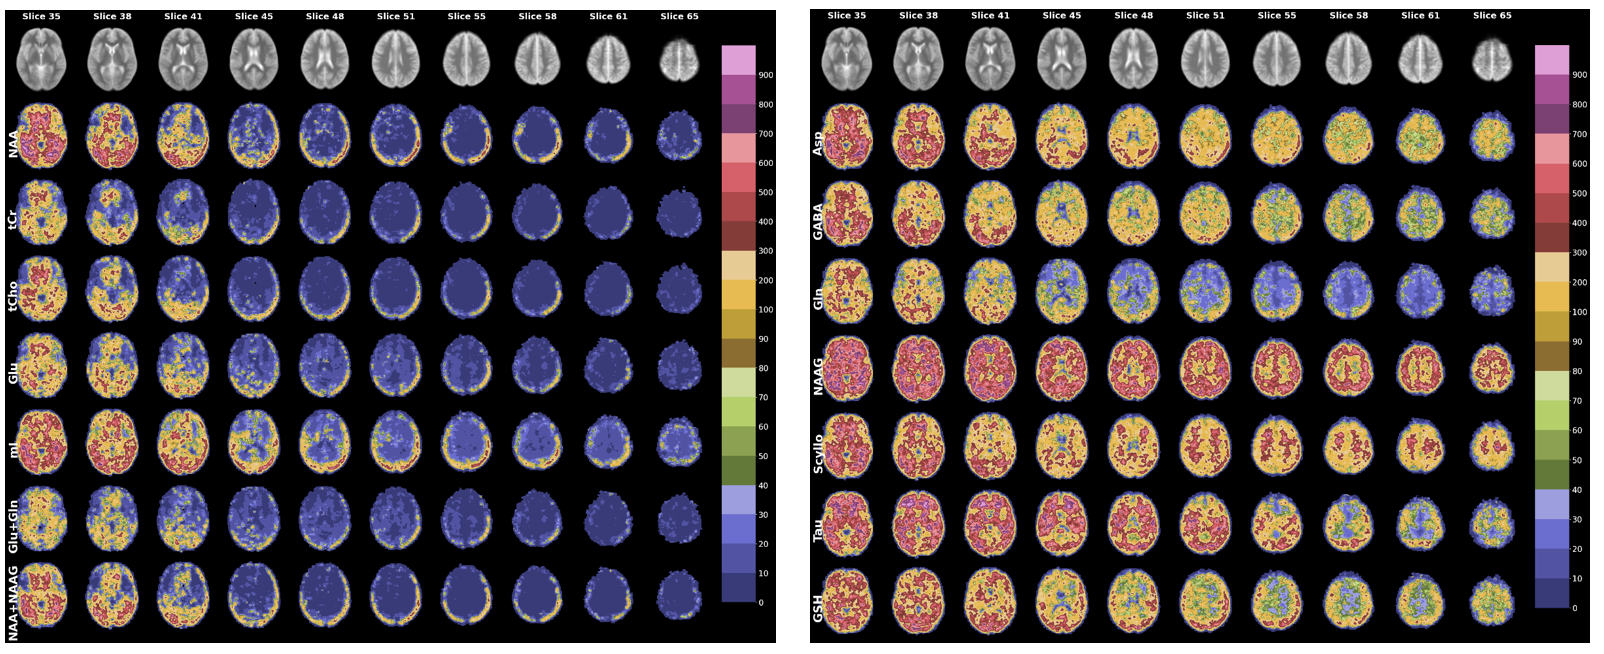
Median metabolite maps from the volunteer cohort with T1-corrected and quantitated data for 12 metabolites are reported in Figure 1. The metabolite maps are reported in MNI space with units of mmol kg-1. Observable tissue contrast is apparent for tCho, Glu, Gln, mI, NAAG, Glu+Gln, and NAA+NAAG maps and the distribution of metabolite concentrations is consistent with previous reports.Averaged CRLB maps are shown in Figure 2. As can be seen in Figure 1 and Figure 2, data in slices below slice 45 diminish in quality. CRLB maps show that the median CRLB in lower slices is much higher than acceptable for data reporting. This effect is seen clearly in Figure 1 by areas of signal dropout or overexposure.
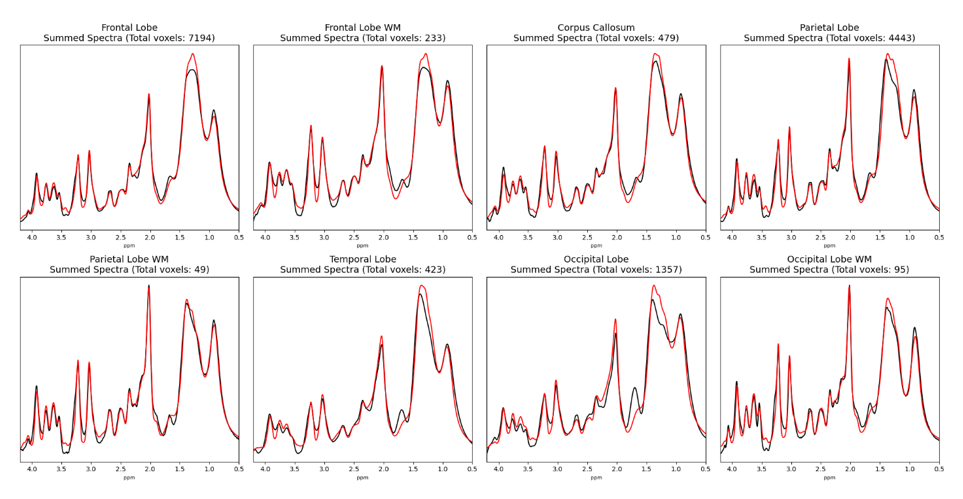
The LCModel fits of metabolites were combined to display regional sums for metabolite spectra (Figure 3). Estimated regional spectra and concentrations include the following anatomical regions: frontal Lobe GM, frontal Lobe WM, parietal Lobe, parietal Lobe WM, temporal lobe, insular cortex, corpus callosum.
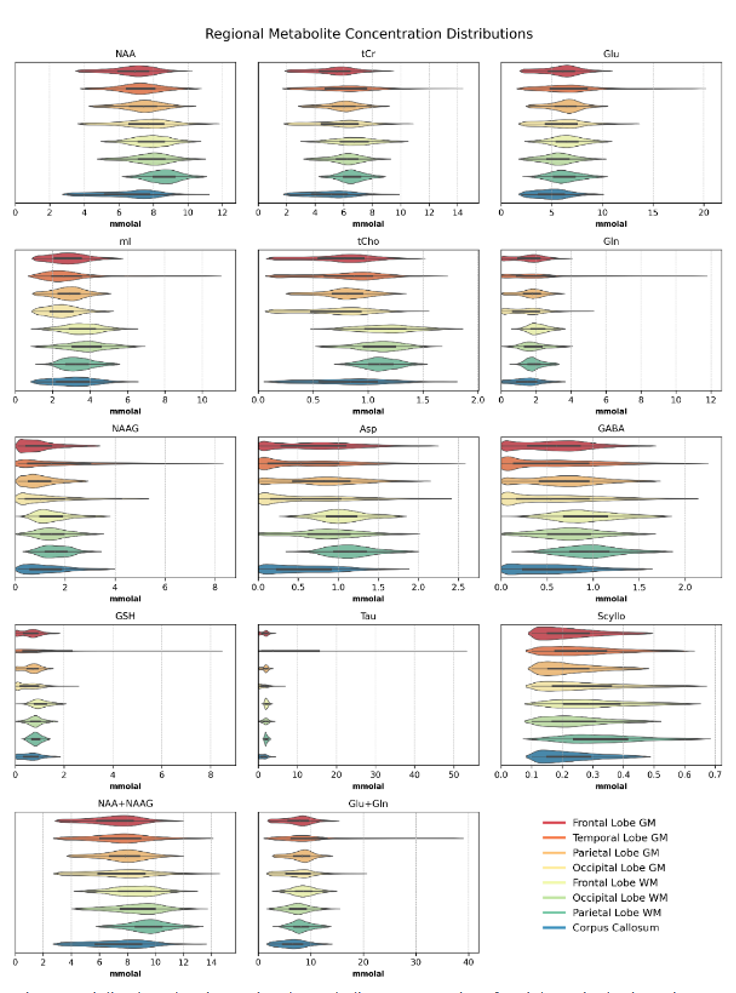
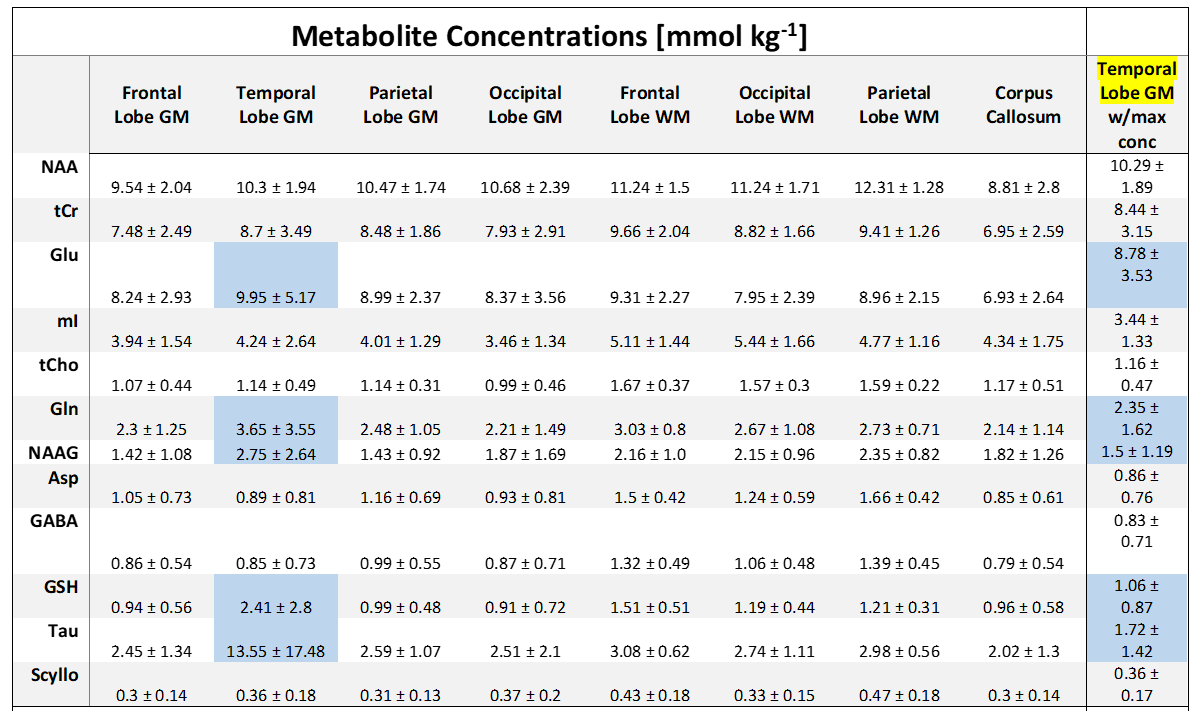
Metabolite concentrations [mmol kg-1] for eight brain regions are reported in Table 1. Metabolite concentrations were calculated in the MNI152 space by masking quantitative metabolite maps with a regional mask. Figure 4 shows respective violin plots for regional metabolite concentrations.
Discussion and Conclusion
Metabolite maps in the MNI space derived from 9.4T 1H MRSI data of a healthy volunteer cohort are presented herein and allow for quantifying concentrations for 12 metabolites in vivo with voxel-specific T1-weighting corrections to serve as a metabolic reference of the healthy human brain.Acknowledgements
Funding by the ERC Starting Grant (SYNAPLAST MR, Grant Number: 679927) of the European Union and the Cancer Prevention and Research Institute of Texas (CPRIT, Grant Number: RR180056) is gratefully acknowledged.References
Nassirpour, S., Chang, P., & Henning, A. (2016). High and ultra-high resolution metabolite mapping of the human brain using 1H FID MRSI at 9.4T. NeuroImage, December, 1–11. https://doi.org/10.1016/j.neuroimage.2016.12.065
Ziegs, T., Martin Wright, A., Henning, A., Theresia Ziegs, C., & Wright, A. M. (2023). Test–retest reproducibility of human brain multi-slice 1H FID-MRSI data at 9.4T after optimization of lipid regularization, macromolecular model, and spline baseline stiffness. Magnetic Resonance in Medicine, 89(1), 11–28. https://doi.org/10.1002/MRM.29423
Wright, A. M., Murali-Manohar, S., Borbath, T., Avdievich, N. I., & Henning, A. (2021). Relaxation-corrected macromolecular model enables determination of 1H longitudinal T1-relaxation times and concentrations of human brain metabolites at 9.4T. Magnetic Resonance in Medicine, 00, 1–17. https://doi.org/10.1002/mrm.28958
Wright, A. M., Murali-Manohar, S., & Henning, A. (2022). Quantitative T1-relaxation corrected metabolite mapping of 12 metabolites in the human brain at 9.4 T. NeuroImage, 263. https://doi.org/10.1016/J.NEUROIMAGE.2022.119574
Provencher, S. W. (2001). Automatic quantitation of localizedin vivo1H spectra with LCModel. NMR in Biomedicine, 14(4), 260–264. https://doi.org/10.1002/nbm.698
Jenkinson, M., Beckmann, C. F., Behrens, T. E. J., Woolrich, M. W., & Smith, S. M. (2012). FSL. NeuroImage, 62(2), 782–790. https://doi.org/10.1016/J.NEUROIMAGE.2011.09.015
Figures