1841
High-field downfield magnetic resonance spectroscopic imaging in the human brain1Russell H. Morgan Department of Radiology and Radiological Science, The Johns Hopkins University School of Medicine, Baltimore, MD, United States, 2Department of Obstetrics & Gynecology, Weill Cornell Medicine, New York City, NY, United States, 3Department of Psychiatry, Weill Cornell Medicine, New York City, NY, United States, 4F.M. Kennedy Krieger Institute, Baltimore, MD, United States
Synopsis
Keywords: High-Field MRI, Spectroscopy, Downfield, Human brain
Motivation: Downfield (DF) MR spectroscopic imaging (MRSI) is a promising new metabolic imaging technique that has previously been demonstrated in the human brain at 3T. This abstract describes initial results of 3D DF-MRSI at 7T.
Goal(s): To implement and test 3D DF-MRSI at 7T.
Approach: The 3D DF-MRSI pulse sequence was adapted for 7T and tested on 4 healthy volunteers.
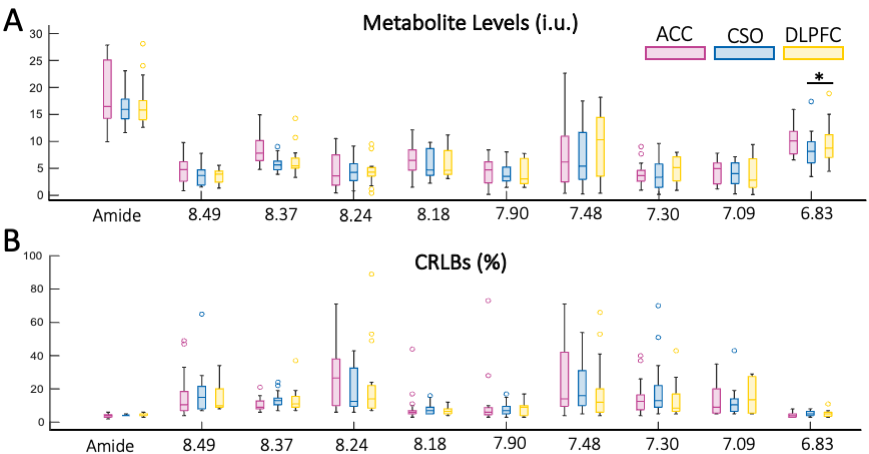
Results: High-field DF-MRSI with 0.7 mm3 nominal voxel resolution is feasible. Concentration and uncertainty estimates for the 9 downfield peaks and combined amide resonances from selected voxels were not significantly different, except for DF6.83 which was significantly lower in the CSO than DLPFC (p=0.007).
Impact: High-field DF-MRSI should now be able to spatially map the exchangeable protons in human brain within clinically acceptable times and accuracy to be used in future studies of brain tumors or other neuropathological disorders.
Introduction
Recently, the spatial distribution of DF resonances in the human brain was mapped using a 2D DF MR spectroscopic imaging (MRSI) technique optimized for exchangeable protons1, and further expanded to whole brain coverage using 3D phase encoding at 3T2,3.Methods
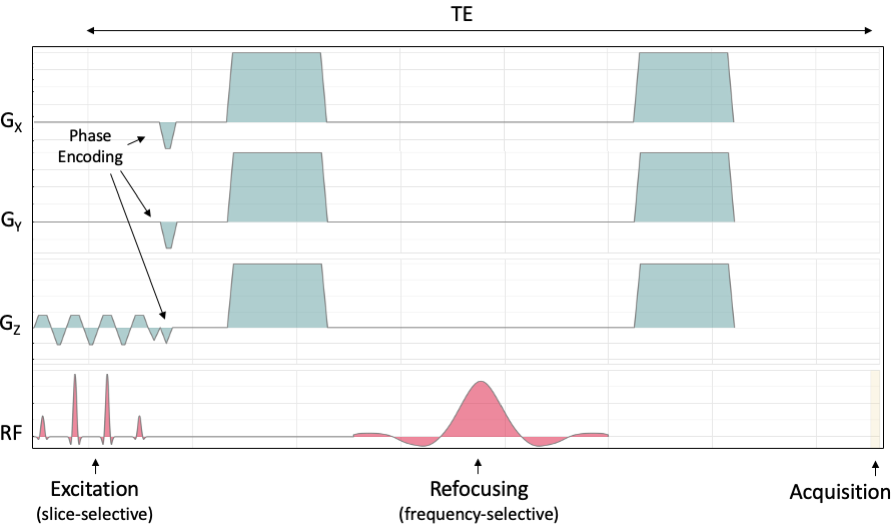
All scans were performed on a Philips 7T ‘Achieva’ scanner equipped with an 8-channel transmit/32- channel receive head coil (Nova Medical) and 16-channel local shim array (MRShim, GmbH, Tübingen, Germany). 3D DF-MRSI was implemented as described previously at 3T with $$$1\overline{3}3\overline{1}$$$ spectral-spatial excitation and frequency selective refocusing (Figure 1). Because of the greater chemical shift dispersion at 7T, the $$$1\overline{3}3\overline{1}$$$ inter-pulse delay was shortened from 1.45 to 0.62 msec (i.e. maximum excitation at 7.4 ppm), and the bandwidth of the selective refocusing pulse increased from 400 to 900 Hz (~3.0 ppm, centered on 7.8 ppm), which allows TE to be shortened to 15ms compared to 22ms at 3T. Other scan parameters were 1 transient, flip angle 45 ̊, circular phase-encoding, FOV 200x180x120 mm, 120 mm excitation slab thickness, TR 282 ms, matrix size 29x26x8, giving a nominal spatial resolution of ≈7x7x15 mm = 0.7 cm3 and a scan time was reduced to 10m:37s by using a SENSE acceleration factor of 1.5 both in anterior-posterior and left-right directions. 16-channel local coil and 3rd order spherical harmonic shimming was used prior to MRSI to achieve uniform B0 field. An unsuppressed water MRSI was also recorded with the same voxel size and geometry as the DF sequence, flip angle 30°, TR 208 ms, TE 1 ms. Proton density (PD) localizer images and a 3D T1w Magnetization Prepared - RApid Gradient Echo (MPRAGE) were also collected. Total scan time was approximately 23 minutes. The protocol was tested in 4 normal volunteers (2F, age 32±10 yrs).Results
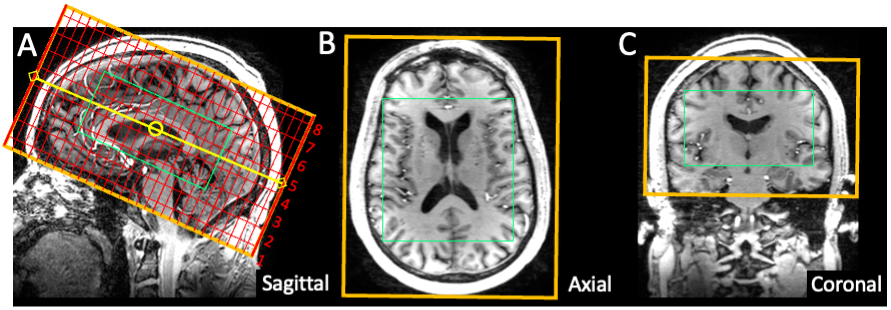
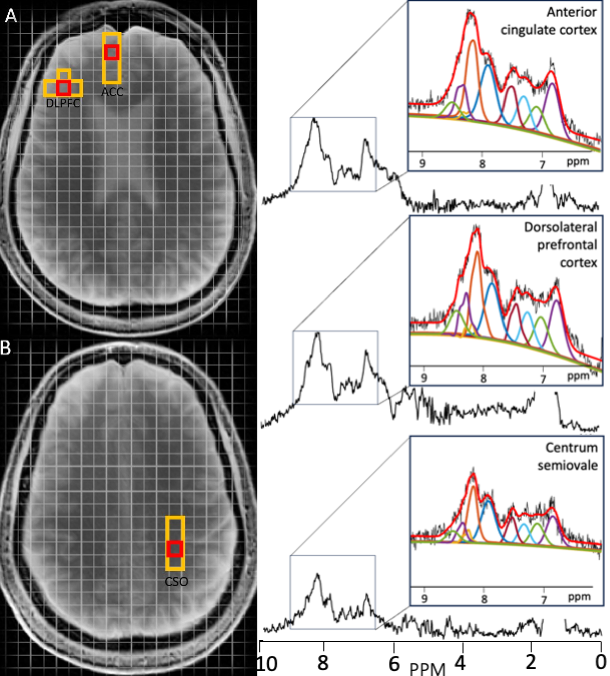
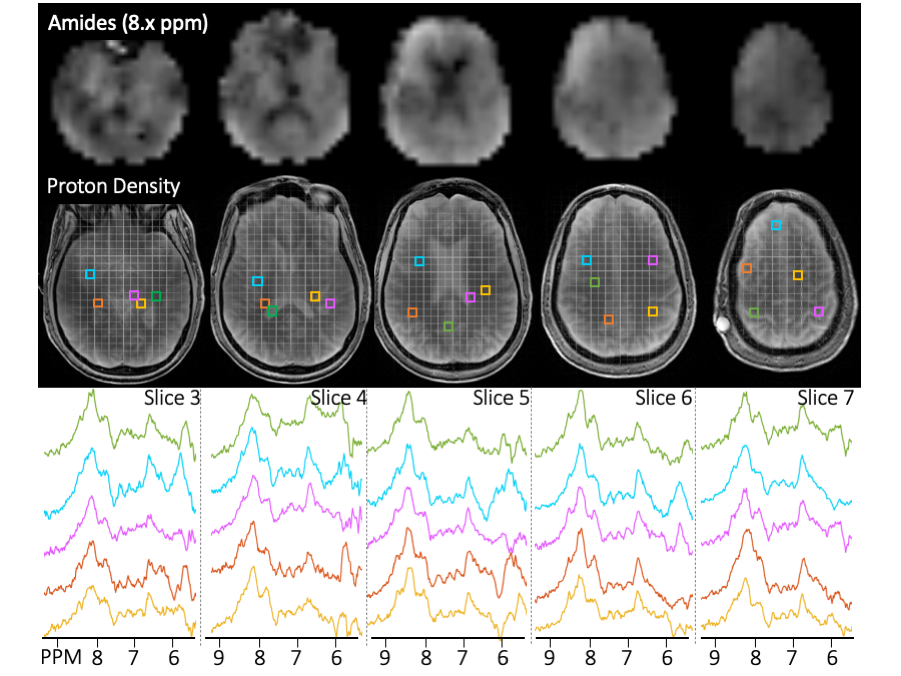
Figure 2 shows the slab location in three orthogonal imaging planes (A, B, and C). Figure 3 illustrates the voxel selection for statistical analysis. The yellow boxes indicate the region-of-interest consisting of four voxels, while the red boxes indicate the voxel for which the spectra are presented in (C) ACC, (D) DLPFC, and (E) CSO. Figure 4 shows representative DF concentration maps (A) for amides (8.x = 8.1-8.3 ppm) and PD images (B) together with color-coded spectra from depicted voxels. Figure 5 shows descriptive statistics for (A) concentration estimates and (B) CRLB values. There were no statistically significant differences between brain regions for any peak, except for DF6.83 which was significantly lower in the CSO than DLPFC (p=0.007).Discussion
3D DF-MRSI with 0.7 cm3 nominal voxel resolution was demonstrated at 7T. Regional brain analysis showed similar or lower CRLB values compared to the previous study at 3T for all DF metabolites except the DF8.24 and DF7.48. The limitations of the current study include the small sample size, and no reproducibility measurements. In the future, other acceleration methods such as sparse k-space sampling and low rank image reconstruction may also be useful in reducing scan time.Acknowledgements
Supported by NIH grants K99EB034768, R01EB028259 and P41EB031771.References
- Povazan M, Schar M, Gillen J, Barker PB. Magnetic resonance spectroscopic imaging of downfield proton resonances in the human brain at 3 T. Magn Reson Med. 2022;87(4):1661-1672. doi:10.1002/mrm.29142
- Özdemir İ, Ganji S, Gillen J, Etyemez S, Považan M, Barker PB. Downfield proton MRSI with whole-brain coverage at 3T. Magn Reson Med. 2023;90(3):814-822. doi:10.1002/mrm.29706
- Özdemir İ, Kamson DO, Etyemez S, Blair L, Lin DDM, Barker PB. Downfield Proton MRSI at 3 Tesla: A Pilot Study in Human Brain Tumors. Cancers. 2023;15(17):4311. doi:10.3390/cancers15174311
Figures