1840
In vitro and in vivo SLOW-editing with 3D EPSI-readout at 3T: Proof of Principle
1Institute for Diagnostic and Interventional Neuroradiology, Support Center for Advanced Neuroimaging (SCAN), University of Bern, Bern, Switzerland, 2Translational Imaging Center, sitem-insel, Bern, Switzerland, Bern, Switzerland, 3University of Miami, Miami, FL, United States
Synopsis
Keywords: Spectroscopy, Metabolism, GABA, Spectral editing, MRSI
Motivation: Developed initially for 7T scanners, the widespread inaccessibility of such MRI systems underscores the urgent need to adapt SLOW-editing for more commonly available 3T field strengths.
Goal(s): Our primary goal is to detect metabolites like 2HG, GABA, and Glx using SLOW-editing at 3T, effectively addressing water/lipid suppression challenge.
Approach: We utilized symmetric and asymmetric CHEmical-shifted selective Adiabatic Pulses (CHEAP) in conjunction with a 3D Echo-Planar Spectroscopic Imaging (EPSI) readout sequence.
Results: Our investigations confirm the feasibility of employing SLOW-editing in conjunction with the EPSI sequence for spectral editing of GABA+ and Glx, validated through in vitro and in vivo experiments.
Impact: This work demonstrates that SLOW-EPSI can be employed for spectral editing of low concentration metabolites, including 2HG, GABA and Glx, on a 3T MR scanner for 3D/whole-brain MRSI.
INTRODUCTION
J-difference spectral editing, specifically Mescher-Garwood (MEGA) editing, has been a longstanding method used for the detection of low concentration and overlapping metabolites in human subjects, such as 2HG, GABA, and Glx [1].Traditionally, this technique has been coupled with small volume-of-interest utilizing single-voxel spectroscopy (SVS) [2], [3] and single-slice MRSI [4], [5] at 3T and 7T. Recently, an alternative spectral editing, named SLOW-editing, showed to be a promising technique [6] for fast whole-brain spectral editing MRSI at 7T [7]–[9].
However, 7T MRI scanners are not readily accessible to many hospitals and institutions worldwide. Furthermore, due to concerns related to patient safety and regulatory approvals, individuals who have undergone surgery in many centers are not permitted to undergo measurements at 7T. Consequently, there exists a growing imperative to adapt and implement SLOW-editing at more widely available field strengths (3T).
The main challenge from 7T to 3T is that the chemical shift range, when expressed in Hz, decreases by a factor of 3T/7T=0.429. This necessitates the development of a steeper transition band for the editing/refocusing CHEmical-shifted selective Adiabatic Pulse (CHEAP) to effectively suppress water/lipid signals without excessively increasing pulse duration.
The objective of this study was to implement SLOW-EPSI on a 3T scanner, and to assess whether editing efficiency and spectral selectivity are still adequate.
METHODS
Hardware:All MRI and MRSI acquisitions were performed on a Siemens 3T MR scanner (MAGNETOM Prisma, Germany) using the Nova head/neck 64 coil (Siemens, Germany).
Pulse sequences:
SLOW-2HG: EPSI-readout sequence [6], [7] with asymmetric CHEmical-shifted selective Adiabatic Pulse (CHEAP) [9], [10] (Figure 1A).
SLOW-GABA: symmetric CHEAP [7] (Figure 1B).
Inv SLOW-GABA: SLOW-GABA sequence with chemical-shifted selective adiabatic lipid inversion suppression pulse (Figure 1C).
Examined subjects:
(1) Braino phantom (General Electric, USA), (2) spherical 2HG-phantom prepared in-house (∼7.8 mmol/L of 2HG and 18 mmol/L of glycine), (3) healthy volunteer : 32-year-old male.
Data processing
For the data reconstruction and pre-post-processing, the MIDAS [11], and MATLAB R2019b were used. The metabolites maps were generated by peak integration.
RESULTS and DISCUSSION
Figure 1 presents the sequence diagram illustrating (1) SLOW-2HG, (2) SLOW-GABA, and (3) inversion lipid suppression SLOW-GABA, hereafter referred to as inv SLOW-GABA.Figure 2 shows the corresponding CHEAP profiles associated with each sequence. (1) SLOW-2HG: The editing-full CHEAP features a passband bandwidth (PBW) spanning from 1.5-4.1 ppm, while the editing-partial CHEAP spans the range from 2.9-4.1 ppm. (2) (inv) SLOW-GABA: The editing-full CHEAP exhibits a PBW range of 1.7-3.9 ppm, whereas the editing-partial CHEAP spans from 2.8-3.9 ppm. (3) The inversion lipid suppression pulse covers a PBW range from 0.6-2.5 ppm.
Figure 3 illustrates in vitro measurements conducted utilizing the three aforementioned sequences. The editing spectrum, denoted as "SLOW-dif," is calculated as the difference between the editing-partial spectrum (SLOW-par) and the editing-full spectrum (SLOW-ful). Notably, no post-processing for water removal was applied, and the results unequivocally demonstrate the absence of any water signal. This observation underscores the excellent water suppression capabilities of CHEAP, as the water resonance is about 4.7 ppm within the stopband of the CHEAP pulse.
Moreover, the edited signals of 2HG and Glu were clearly observed, and it is noteworthy that the inversion pulse selectively affects the spectral range within its bandwidth, leaving other metabolites, such as Cr, Cho, mI, and Glu (at 3.75 ppm), unaffected.
Figure 4 presents the peak integration maps of the sum of Creatine (Cr) at 3.0 ppm and Choline (Cho) at 3.2 ppm obtained under various flip angles of the CHEAP pulse within the context of the SLOW-GABA sequence, using only editing-partial acquisition. In the upper-left panel, the mean and standard deviation values are displayed. only the map acquired with a 27% B1+ exhibits notably reduced signal intensity, as indicated by a lower peak integration value when compared to the other acquired data. The outcomes of this investigation reveal the remarkable adiabatic performance of CHEAP, notably demonstrating its robustness over a range of B1+ values spanning from 45% to 191%.
Figure 5 presents the in vivo measurements conducted on a healthy subject employing the inv SLOW-GABA sequence. The efficiency of the inversion lipid suppression method is strikingly evident, with virtually no discernible lipid contamination, even in close proximity to the skull (Figure 5E). This outcome yields spectra characterized by a remarkably flat baseline. Remarkably, the spectra show clearly identifiable peaks for edited GABA+ and Glx, whereas the NAA peak is inverted and reduced in intensity.
CONCLUSION
The utilization of SLOW-editing in conjunction with the EPSI sequence targeting GABA+ and Glx editing is feasible at 3T both in vitro and in vivo.Acknowledgements
Supported by the Swiss National Science Foundation (SNSF-182569, and SNSF-207997).
References
[1] M. Mescher, H. Merkle, J. Kirsch, M. Garwood, and R. Gruetter, “Simultaneous in vivo spectral editing and water suppression,” NMR Biomed, vol. 11, no. 6, pp. 266–272, Oct. 1998, doi: 10.1002/(SICI)1099-1492(199810)11:6<266::AID-NBM530>3.0.CO;2-J.
[2] D. Hong, S. Rohani Rankouhi, J.-W. Thielen, J. J. A. van Asten, and D. G. Norris, “A comparison of sLASER and MEGA-sLASER using simultaneous interleaved acquisition for measuring GABA in the human brain at 7T,” PLoS One, vol. 14, no. 10, p. e0223702, Oct. 2019, doi: 10.1371/journal.pone.0223702.
[3] T. Finkelman, E. Furman-Haran, R. Paz, and A. Tal, “Quantifying the excitatory-inhibitory balance: A comparison of SemiLASER and MEGA-SemiLASER for simultaneously measuring GABA and glutamate at 7T,” Neuroimage, vol. 247, p. 118810, Feb. 2022, doi: 10.1016/J.NEUROIMAGE.2021.118810.
[4] P. Moser et al., “Whole-slice mapping of GABA and GABA+ at 7T via adiabatic MEGA-editing, real-time instability correction, and concentric circle readout,” Neuroimage, vol. 184, pp. 475–489, Jan. 2019, doi: 10.1016/j.neuroimage.2018.09.039.
[5] J. E. Jensen, B. de B. Frederick, and P. F. Renshaw, “Grey and white matter GABA level differences in the human brain using two-dimensional, J-resolved spectroscopic imaging,” NMR Biomed, vol. 18, no. 8, pp. 570–576, Dec. 2005, doi: 10.1002/NBM.994.
[6] A. Ebel and A. A. Maudsley, “Improved spectral quality for 3D MR spectroscopic imaging using a high spatial resolution acquisition strategy,” Magn Reson Imaging, vol. 21, no. 2, pp. 113–120, 2003, doi: 10.1016/S0730-725X(02)00645-8.
[7] G. Weng et al., “SLOW: A novel spectral editing method for whole‐brain MRSI at ultra high magnetic field,” Magn Reson Med, vol. 88, no. 1, pp. 53–70, Jul. 2022, doi: 10.1002/mrm.29220.
[8] G. Weng et al., “Accurate prediction of isocitrate dehydrogenase -mutation status of gliomas using SLOW-editing magnetic resonance spectroscopic imaging at 7 T MR,” Neurooncol Adv, vol. 5, no. 1, pp. 1–14, Jan. 2023, doi: 10.1093/NOAJNL/VDAD001.
[9] G. Weng, P. Radojewski, and J. Slotboom, “α-D-Glucose as a non-radioactive MRS tracer for metabolic studies of the brain,” Sci Rep, vol. 13, no. 1, p. 6159, Apr. 2023, doi: 10.1038/s41598-023-33161-8.
[10] J. Slotboom et al., “Proton Resonance Spectroscopy Study of the Effects of L-Ornithine-L-Aspartate on the Development of Encephalopathy, Using Localization Pulses with Reduced Specific Absorption Rate,” J Magn Reson B, vol. 105, no. 2, Oct. 1994, doi: 10.1006/jmrb.1994.1114.
[11] A. A. Maudsley et al., “Comprehensive processing, display and analysis forin vivo MR spectroscopic imaging,” NMR Biomed, vol. 19, no. 4, pp. 492–503, Jun. 2006, doi: 10.1002/nbm.1025.
Figures
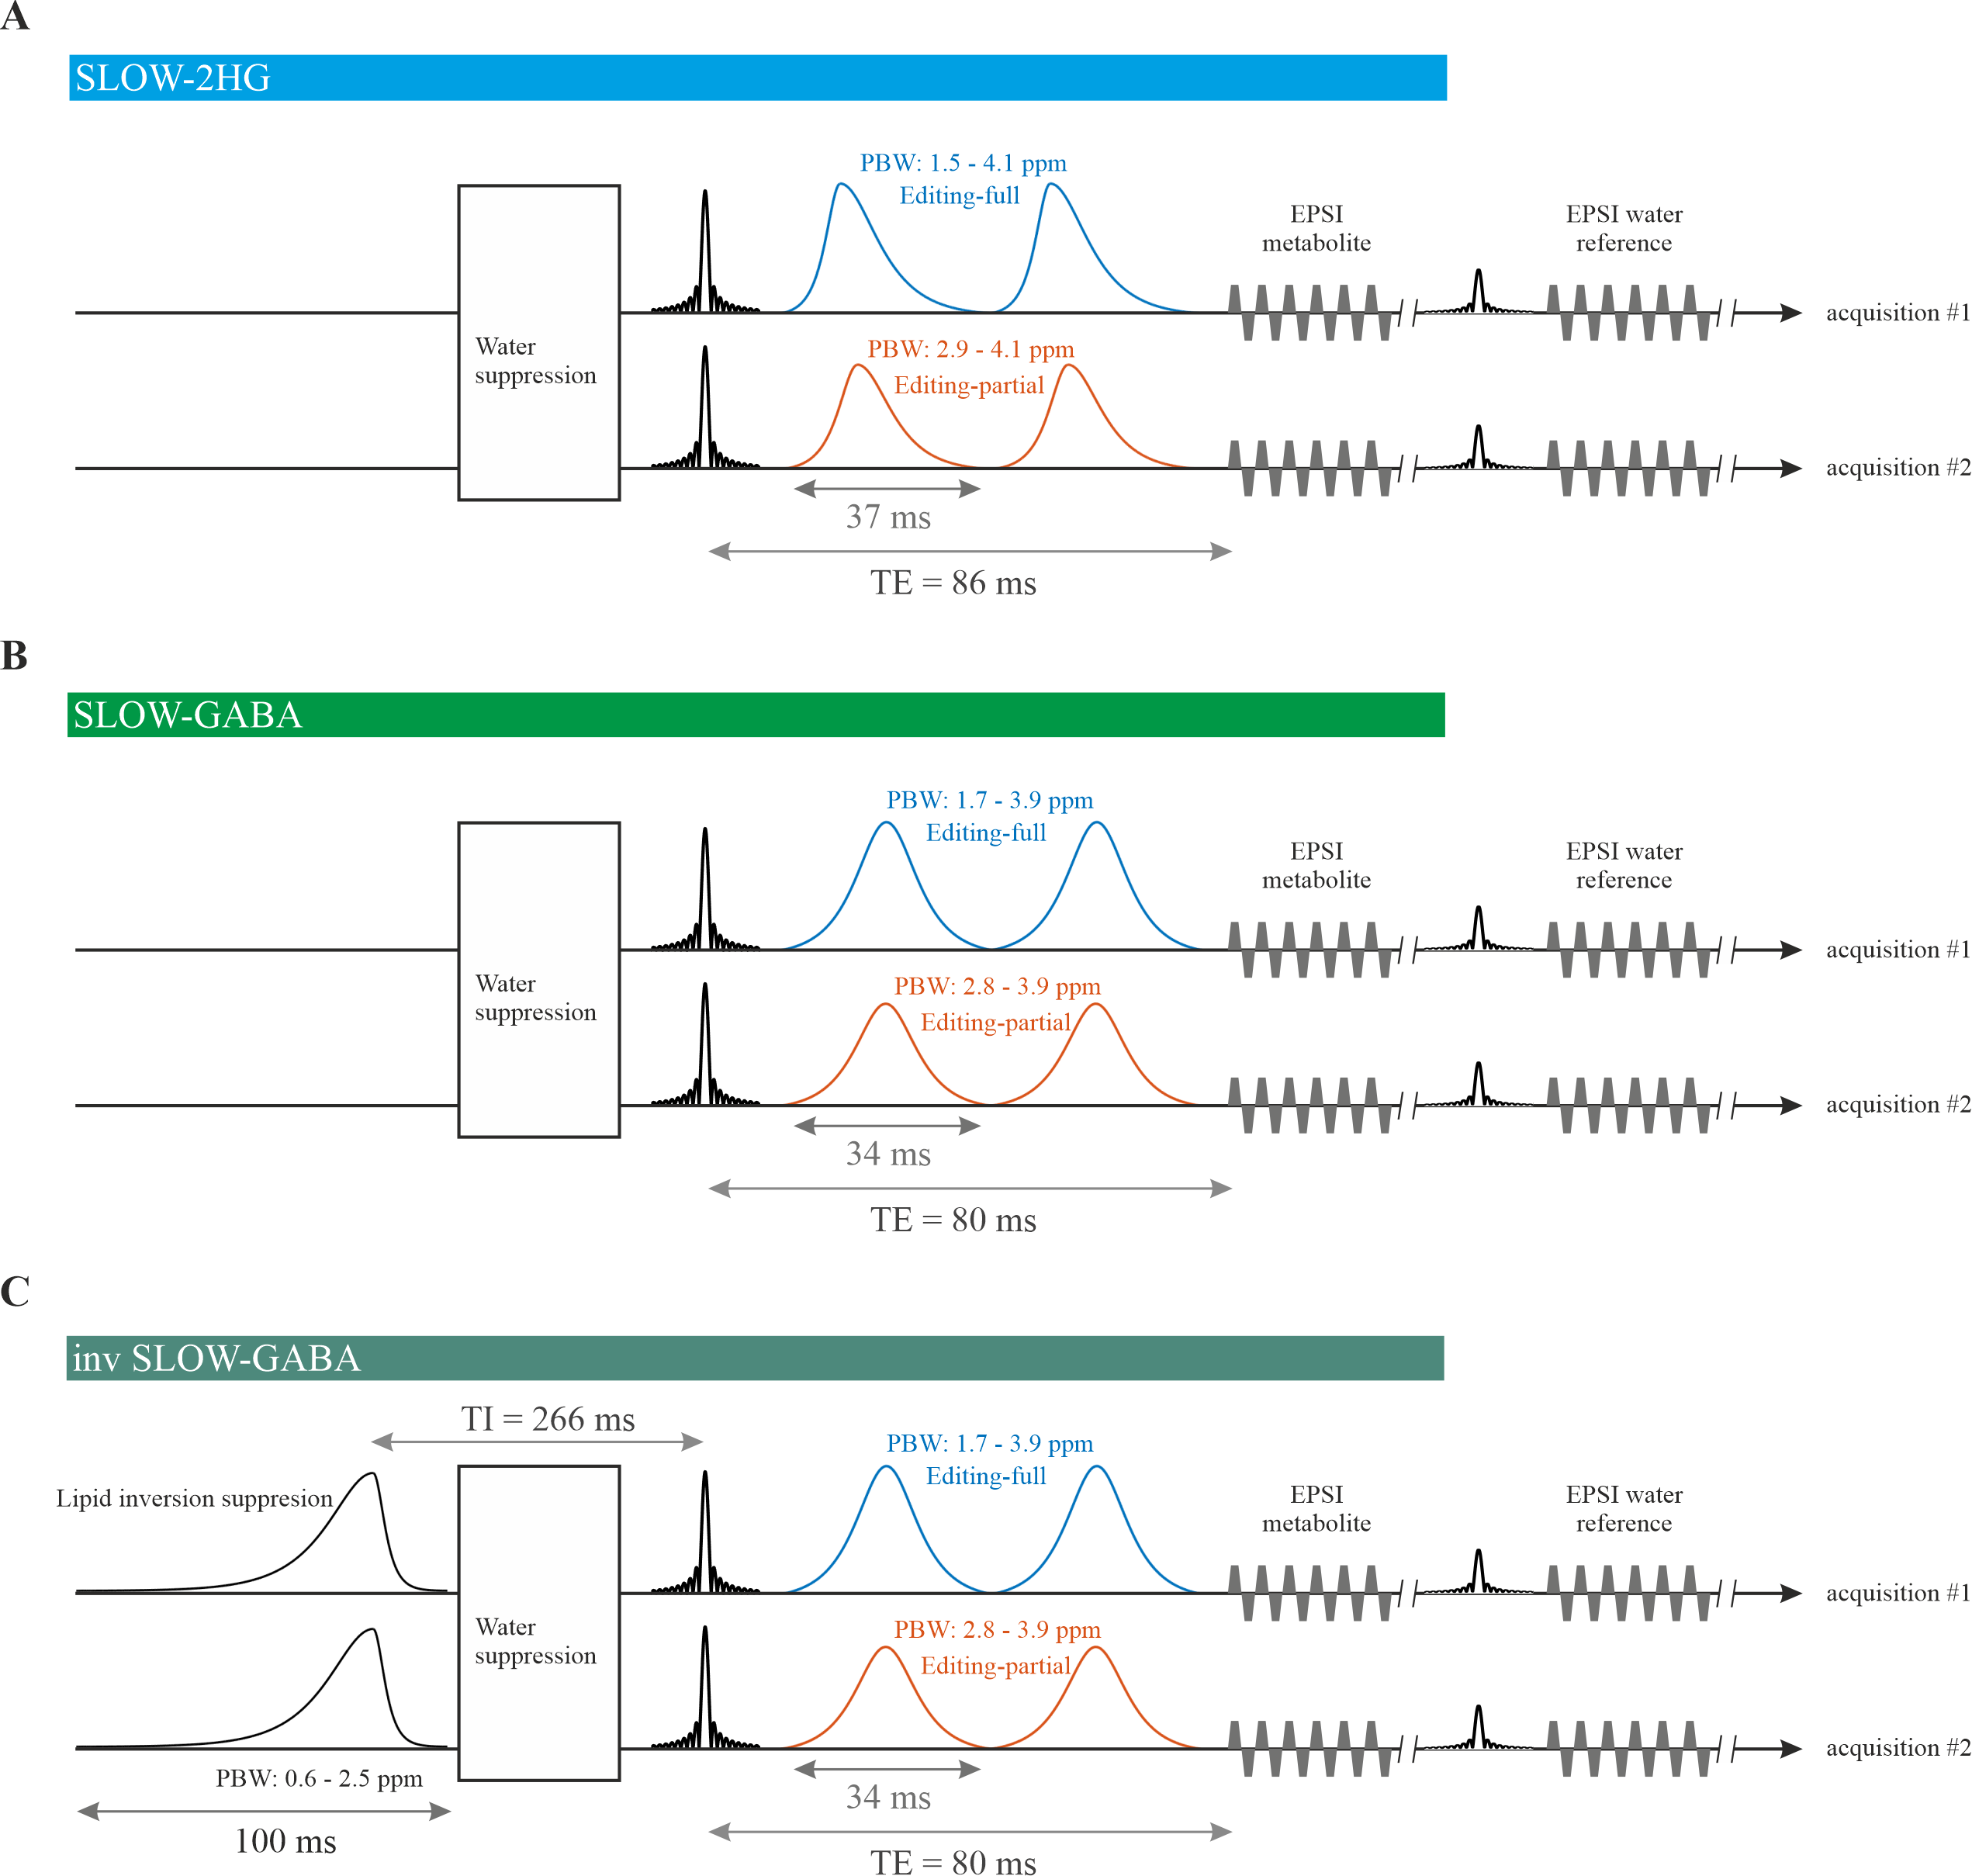
Figure 1: A) SLOW-2HG: TE = 86 ms, TR = 1600 ms, nominal matrix = 65×23×5 (4.3×7.8×12 mm). TA = 4:46 min. B) SLOW-GABA: TE = 80 ms, TR = 1600 ms, nominal matrix = 65×23×5 (4.3×7.8×12 mm). TA = 4:46 min. C) Inv SLOW-GABA: TE = 80 ms, TR = 1600 ms. 1) in vitro measurement: nominal matrix = 65×23×5 (4.3×7.8×12 mm). TA = 4:46 min; 2) in vivo measurement: nominal matrix = 65×23×9 (4.3×7.8×8.9 mm). TA = 9:36 min.
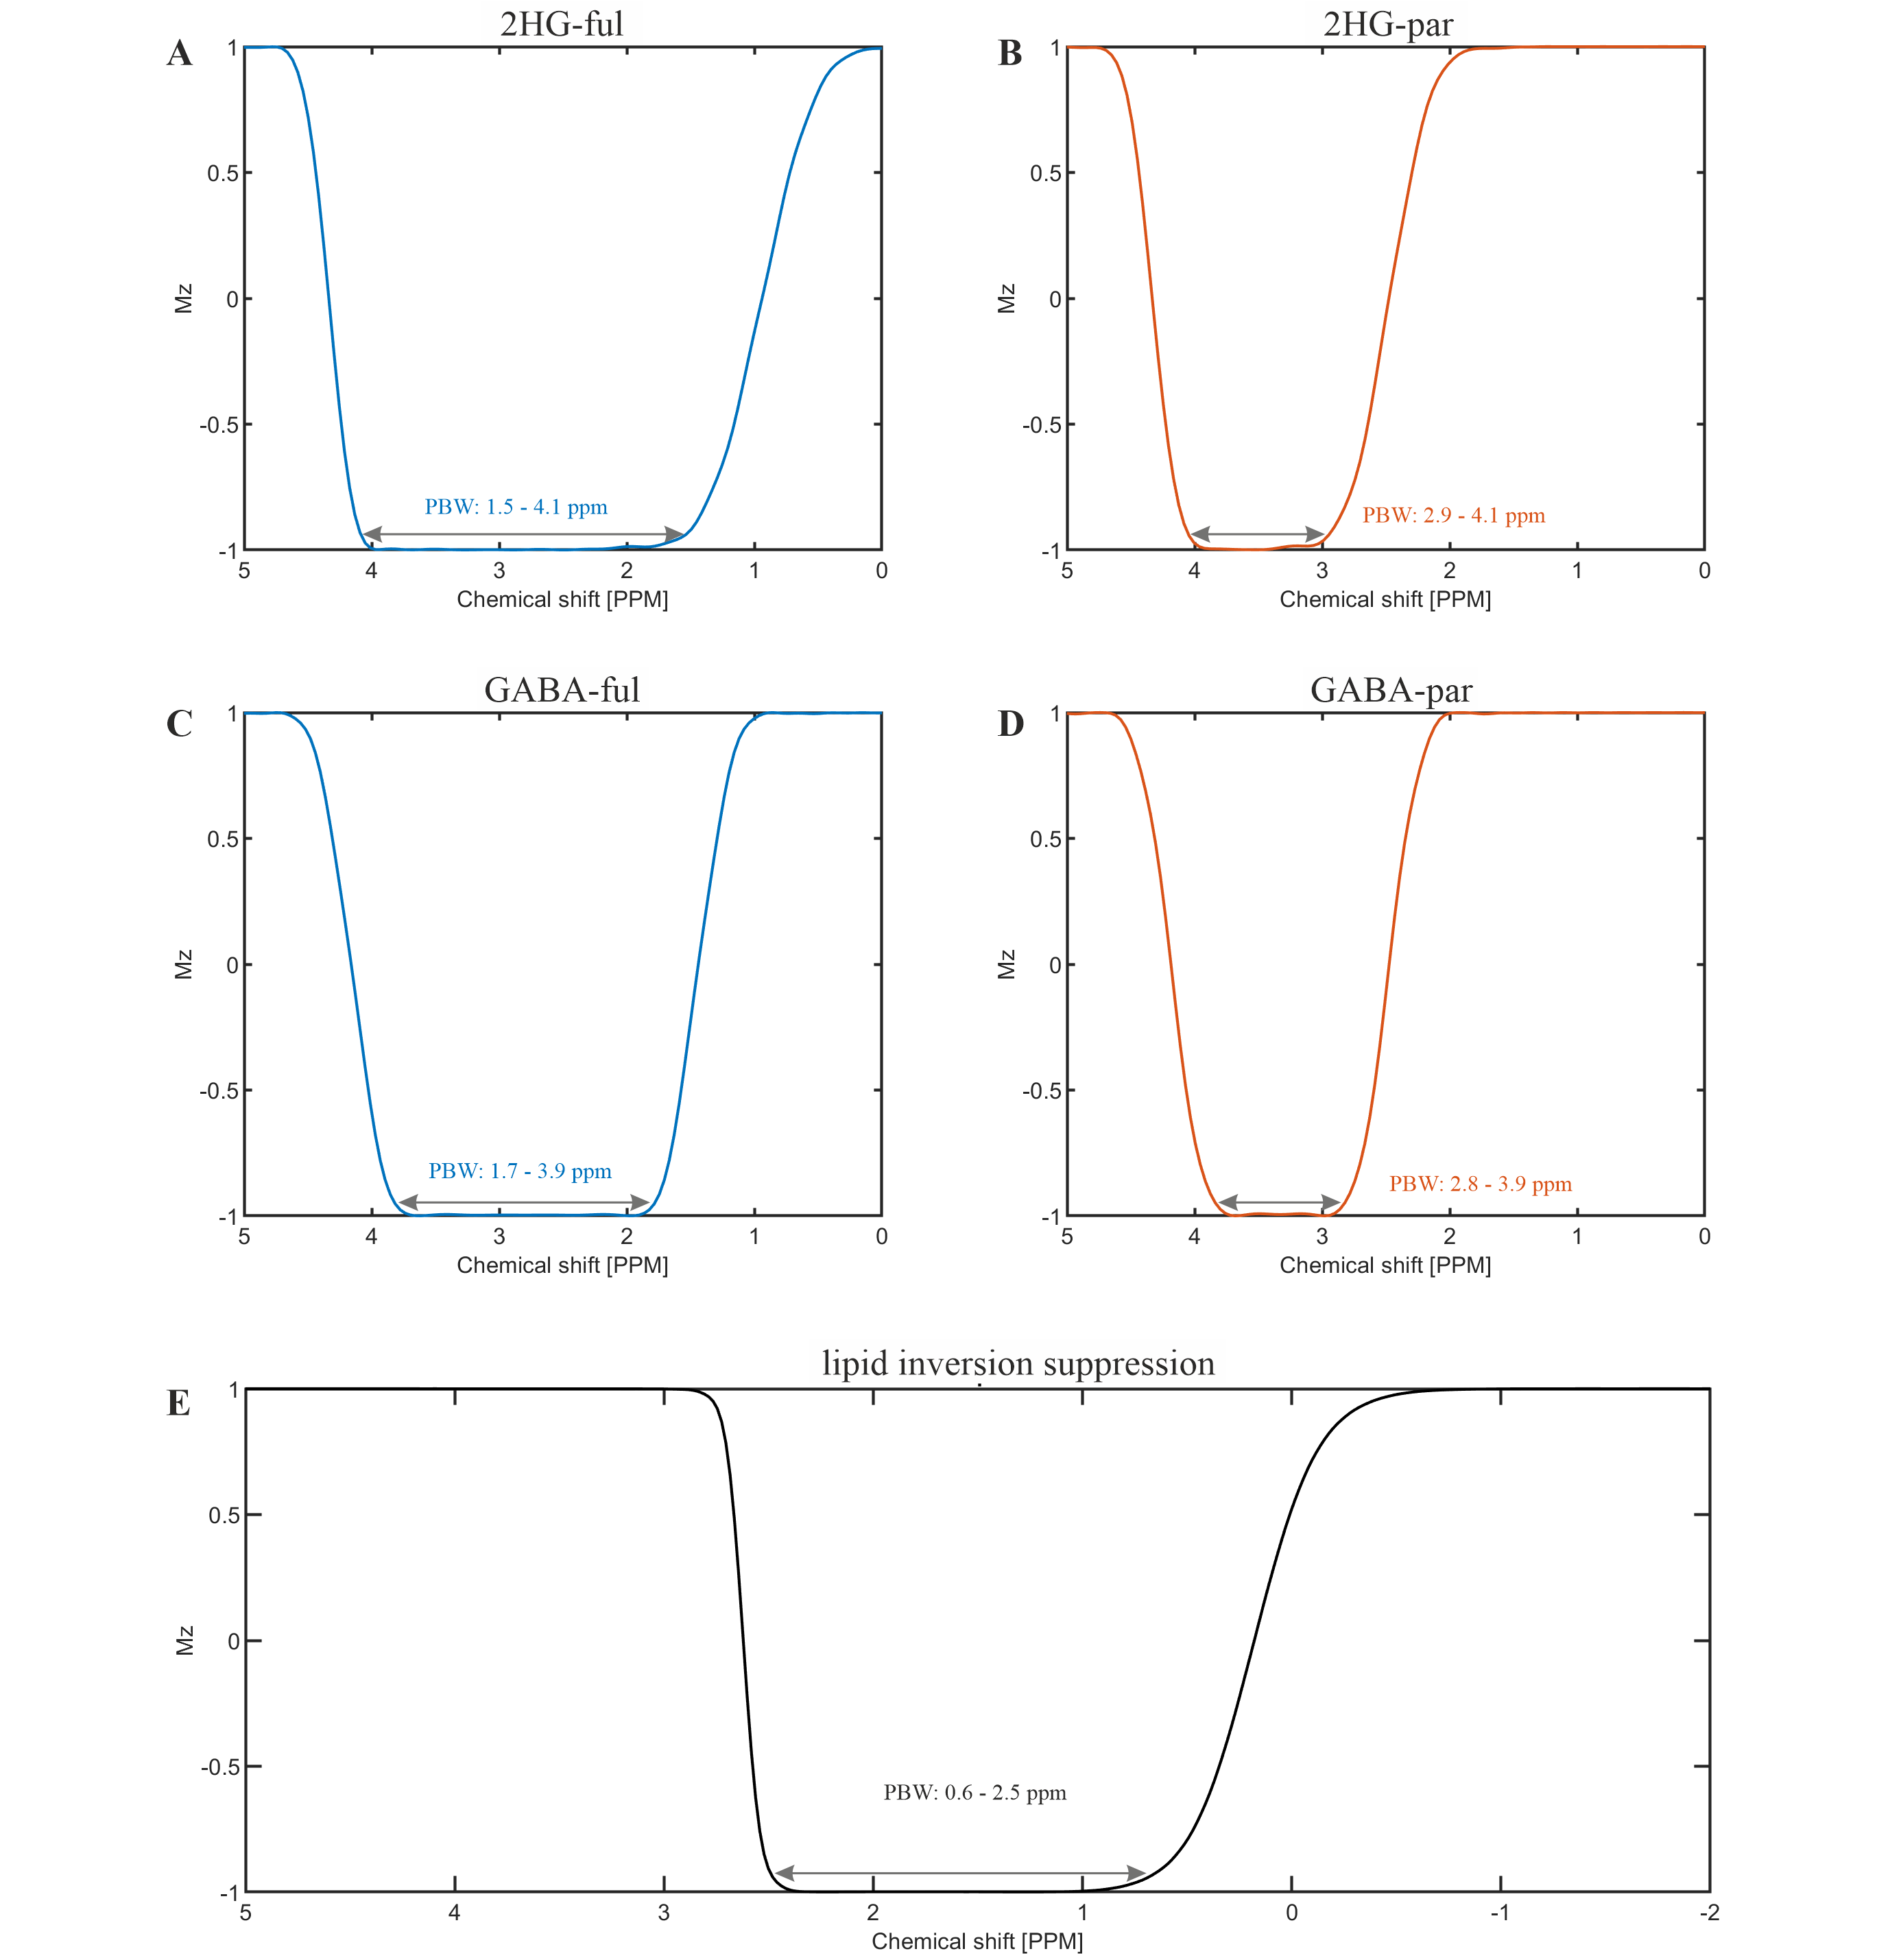
Figure 2: Simulated pulse profiles for CHEAP as inversion pulse. A-B) CHEAP pulse profiles of SLOW-2HG for editing-full and editing-partial, respectively. C-D) CHEAP pulse profiles of SLOW-GABA and inn SLOW-GABA for editing-full and editing-partial, respectively. E) The adiabatic chemical-shifted selective inversion lipid suppression pulse profile.
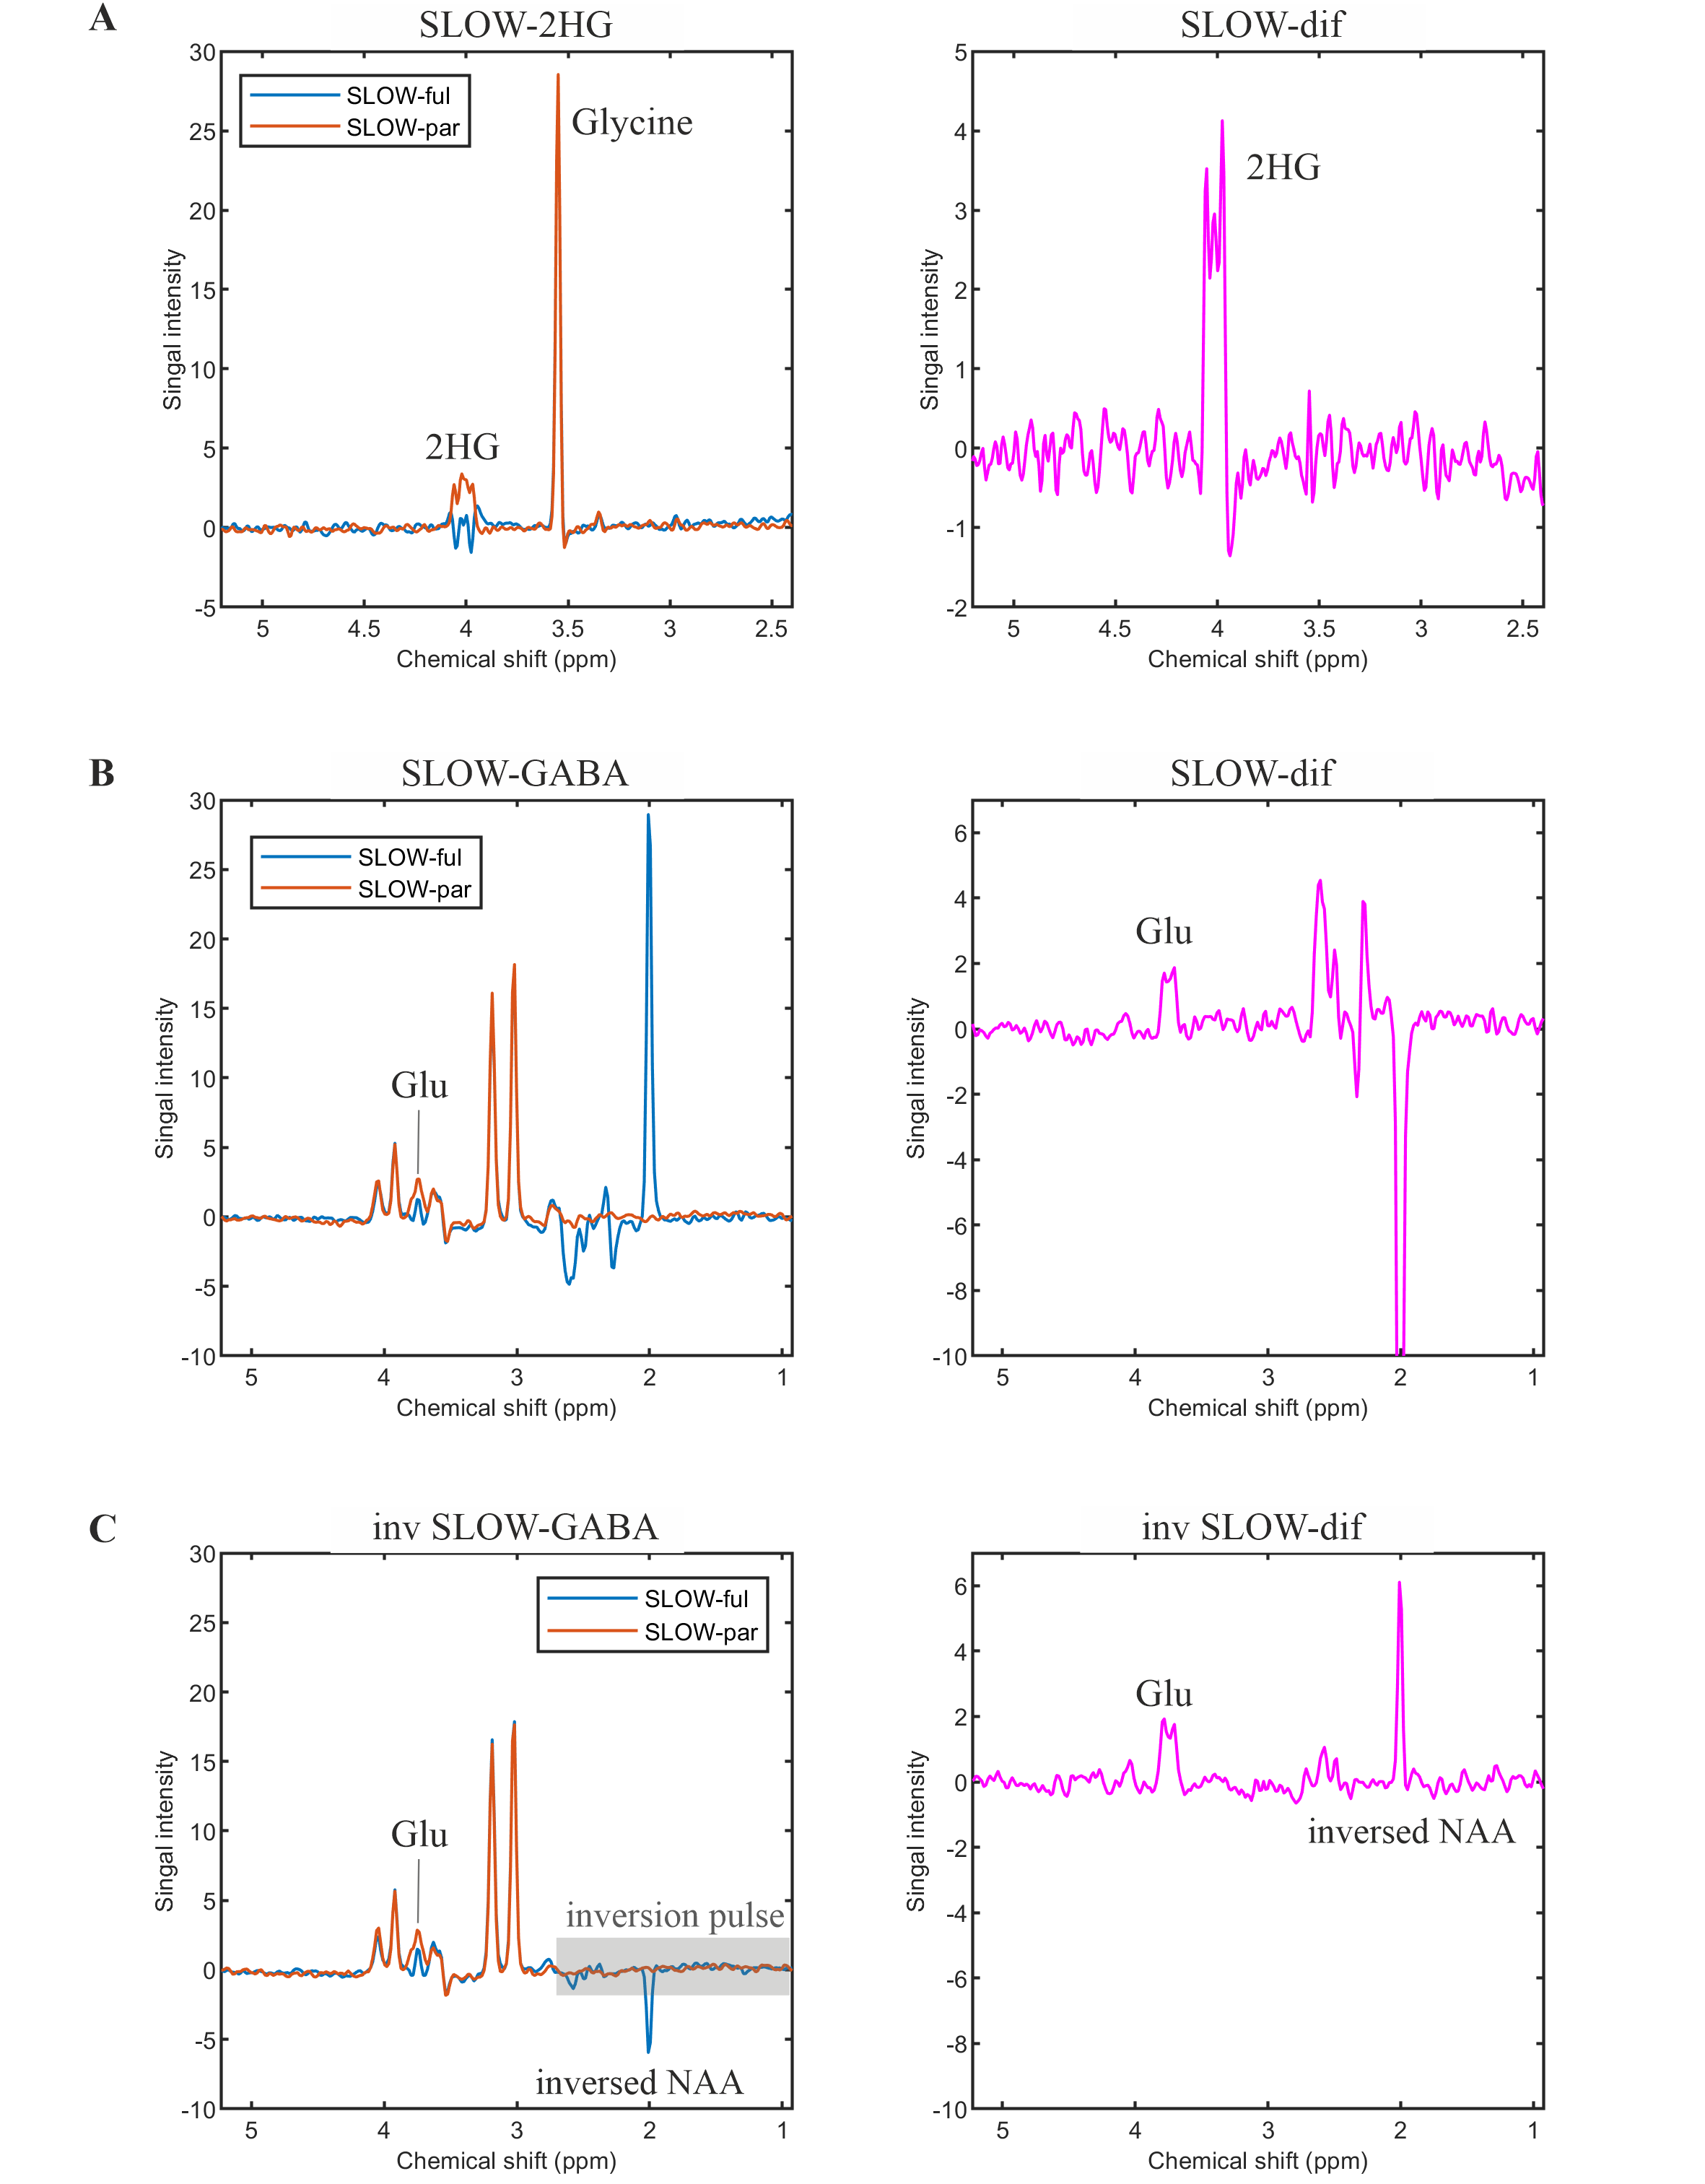
Figure 3: In vitro measurement. A-B) SLOW-2HG and SLOW-GABA: the editing-full spectrum (SLOW-ful), editing-partial spectrum (SLOW-par), and editing-difference spectrum (SLOW-dif) were marked as blue, orange, and magenta line. C) inv SLOW-GABA: the range of the inversion lipid suppression pulse bandwidth was marked as a gray area. For all measurements: TA = 4:46 min, and displaced volume size = 11 ml.
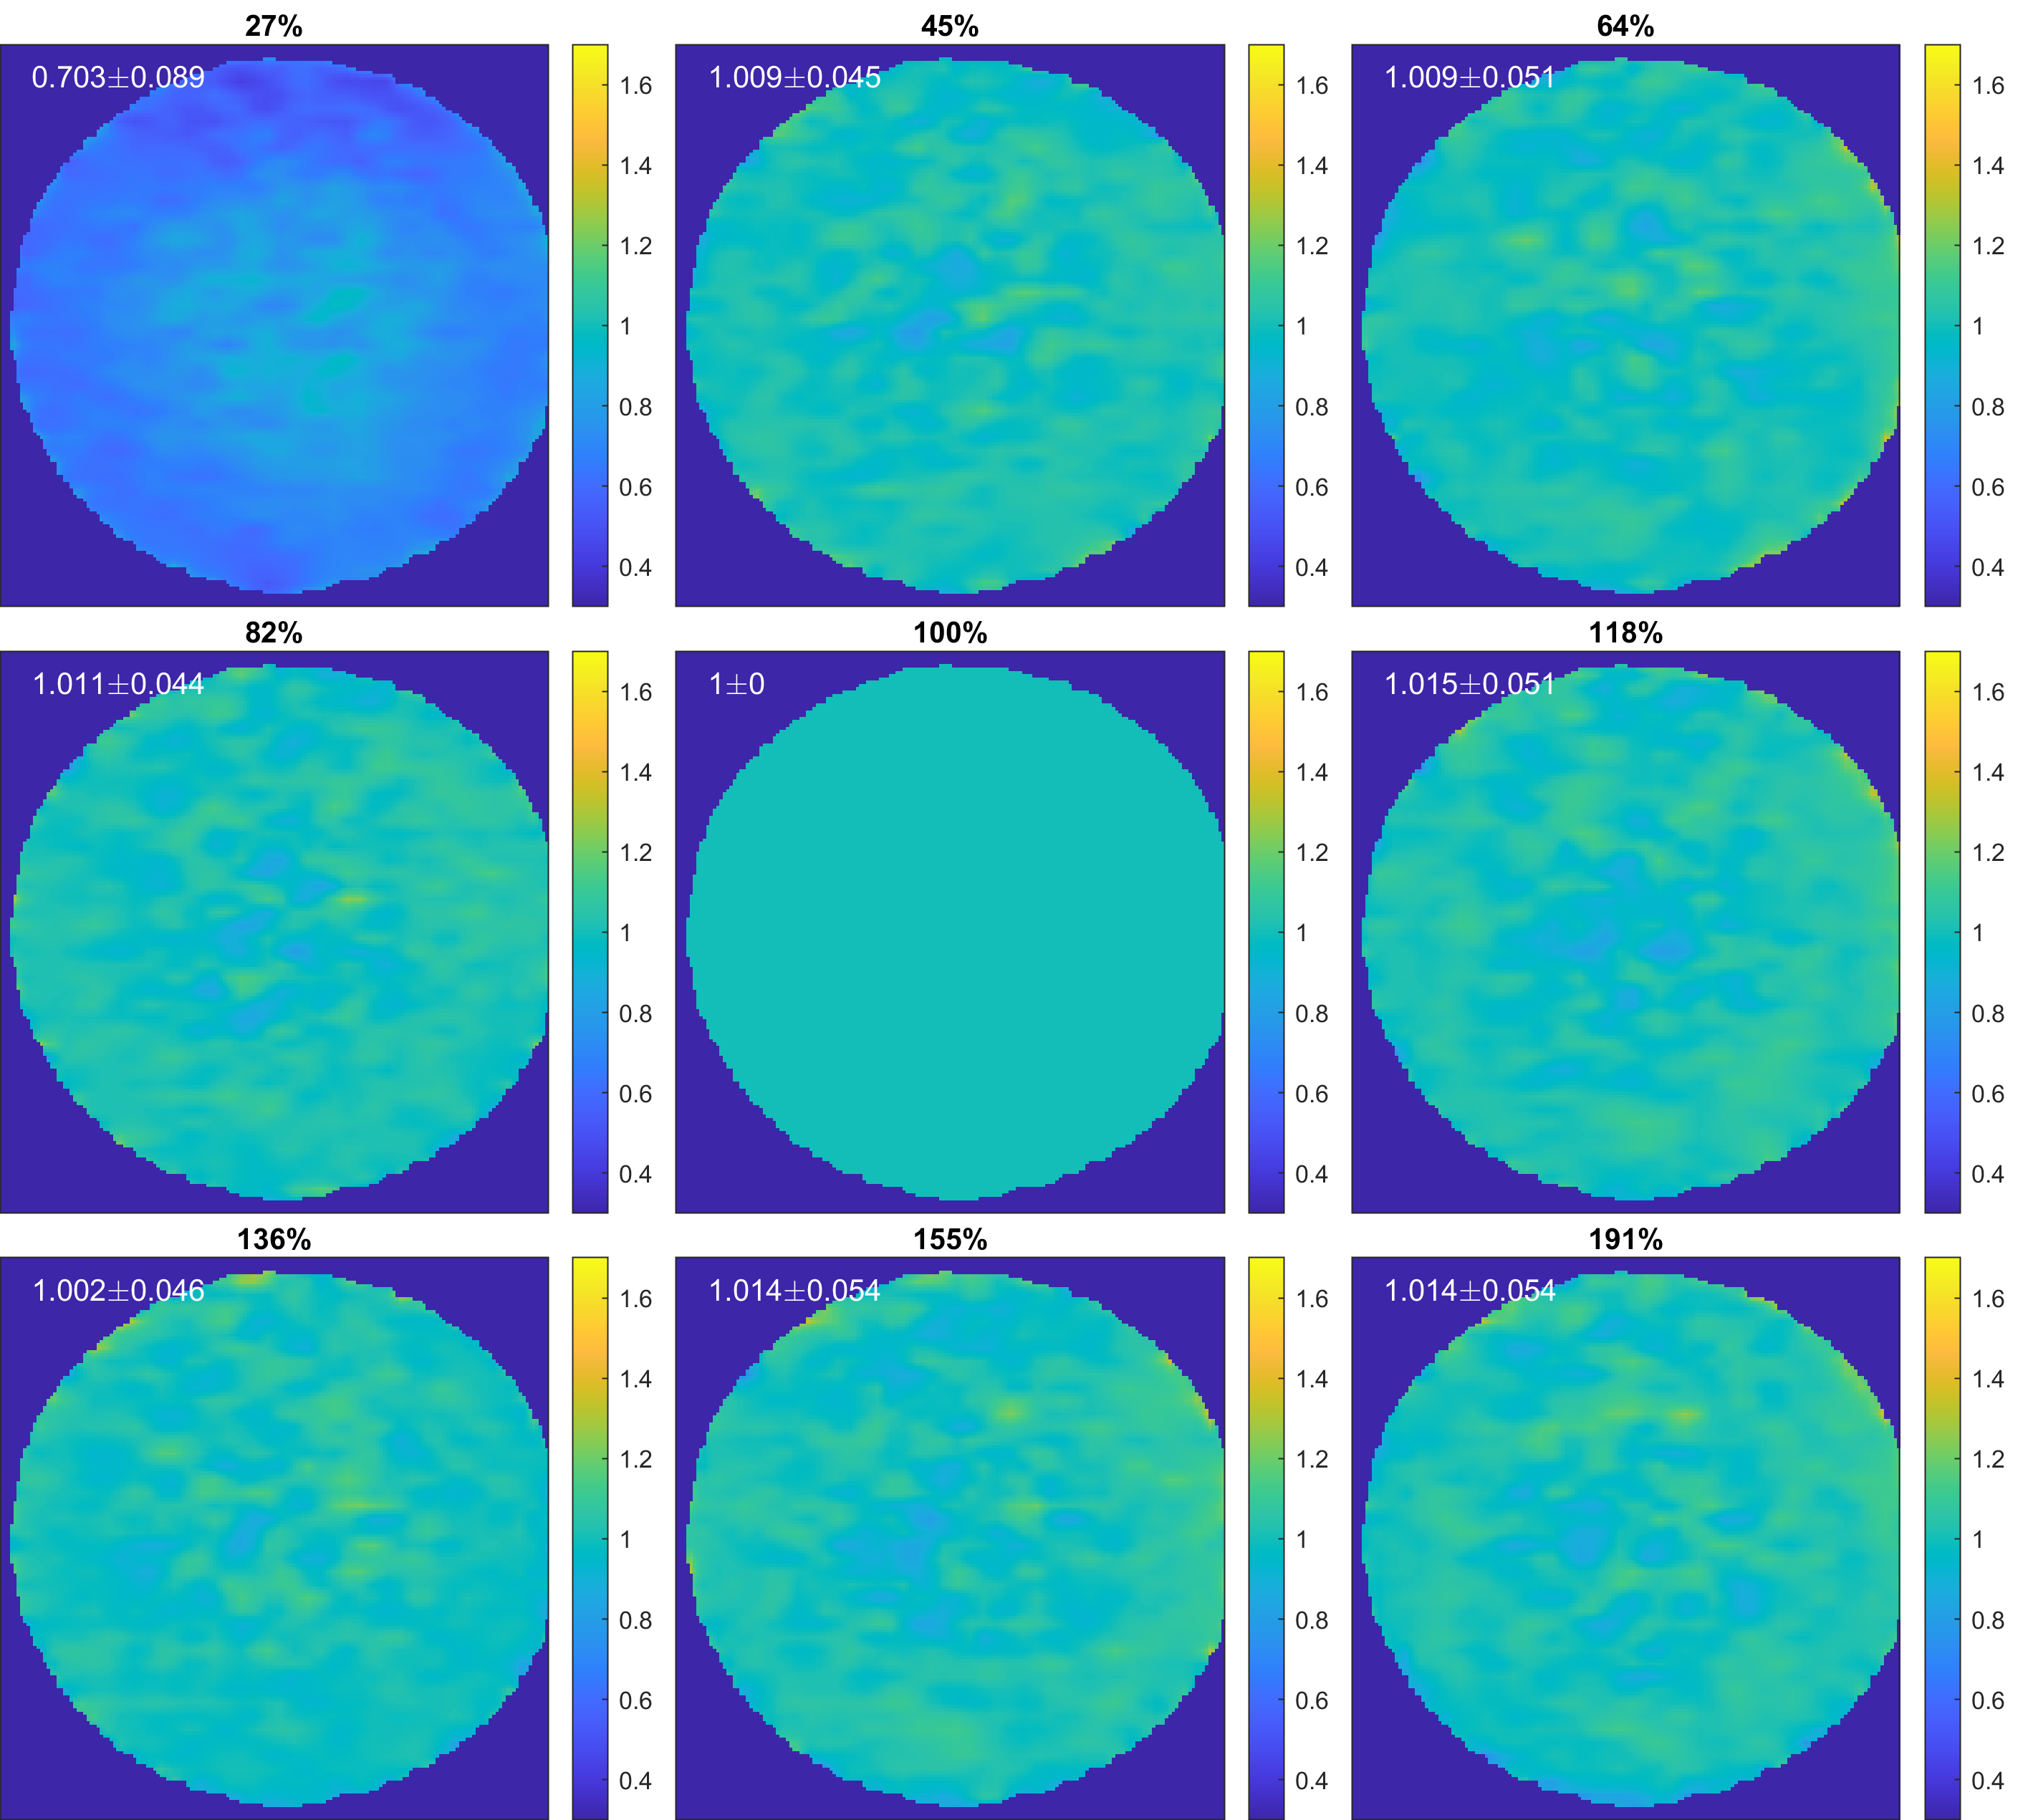
Figure 4: Peak integration maps of the sum of Cr (3.0 ppm) and Cho (3.2 ppm) with different B1+ of CHEAP pulse. The value of each map = integration value of xx% B1+ / integration value of 100% B1+. In the upper-left panel, the mean and standard deviation values are displayed. The peak amplitude of 100% B1+ is 157 Hz. TE = 80 ms, TR = 1600 ms, nominal matrix = 65×23×5 (4.3×7.8×12 mm). TA = 2:23 min (only SLOW-GABA editing-partial acquisition).
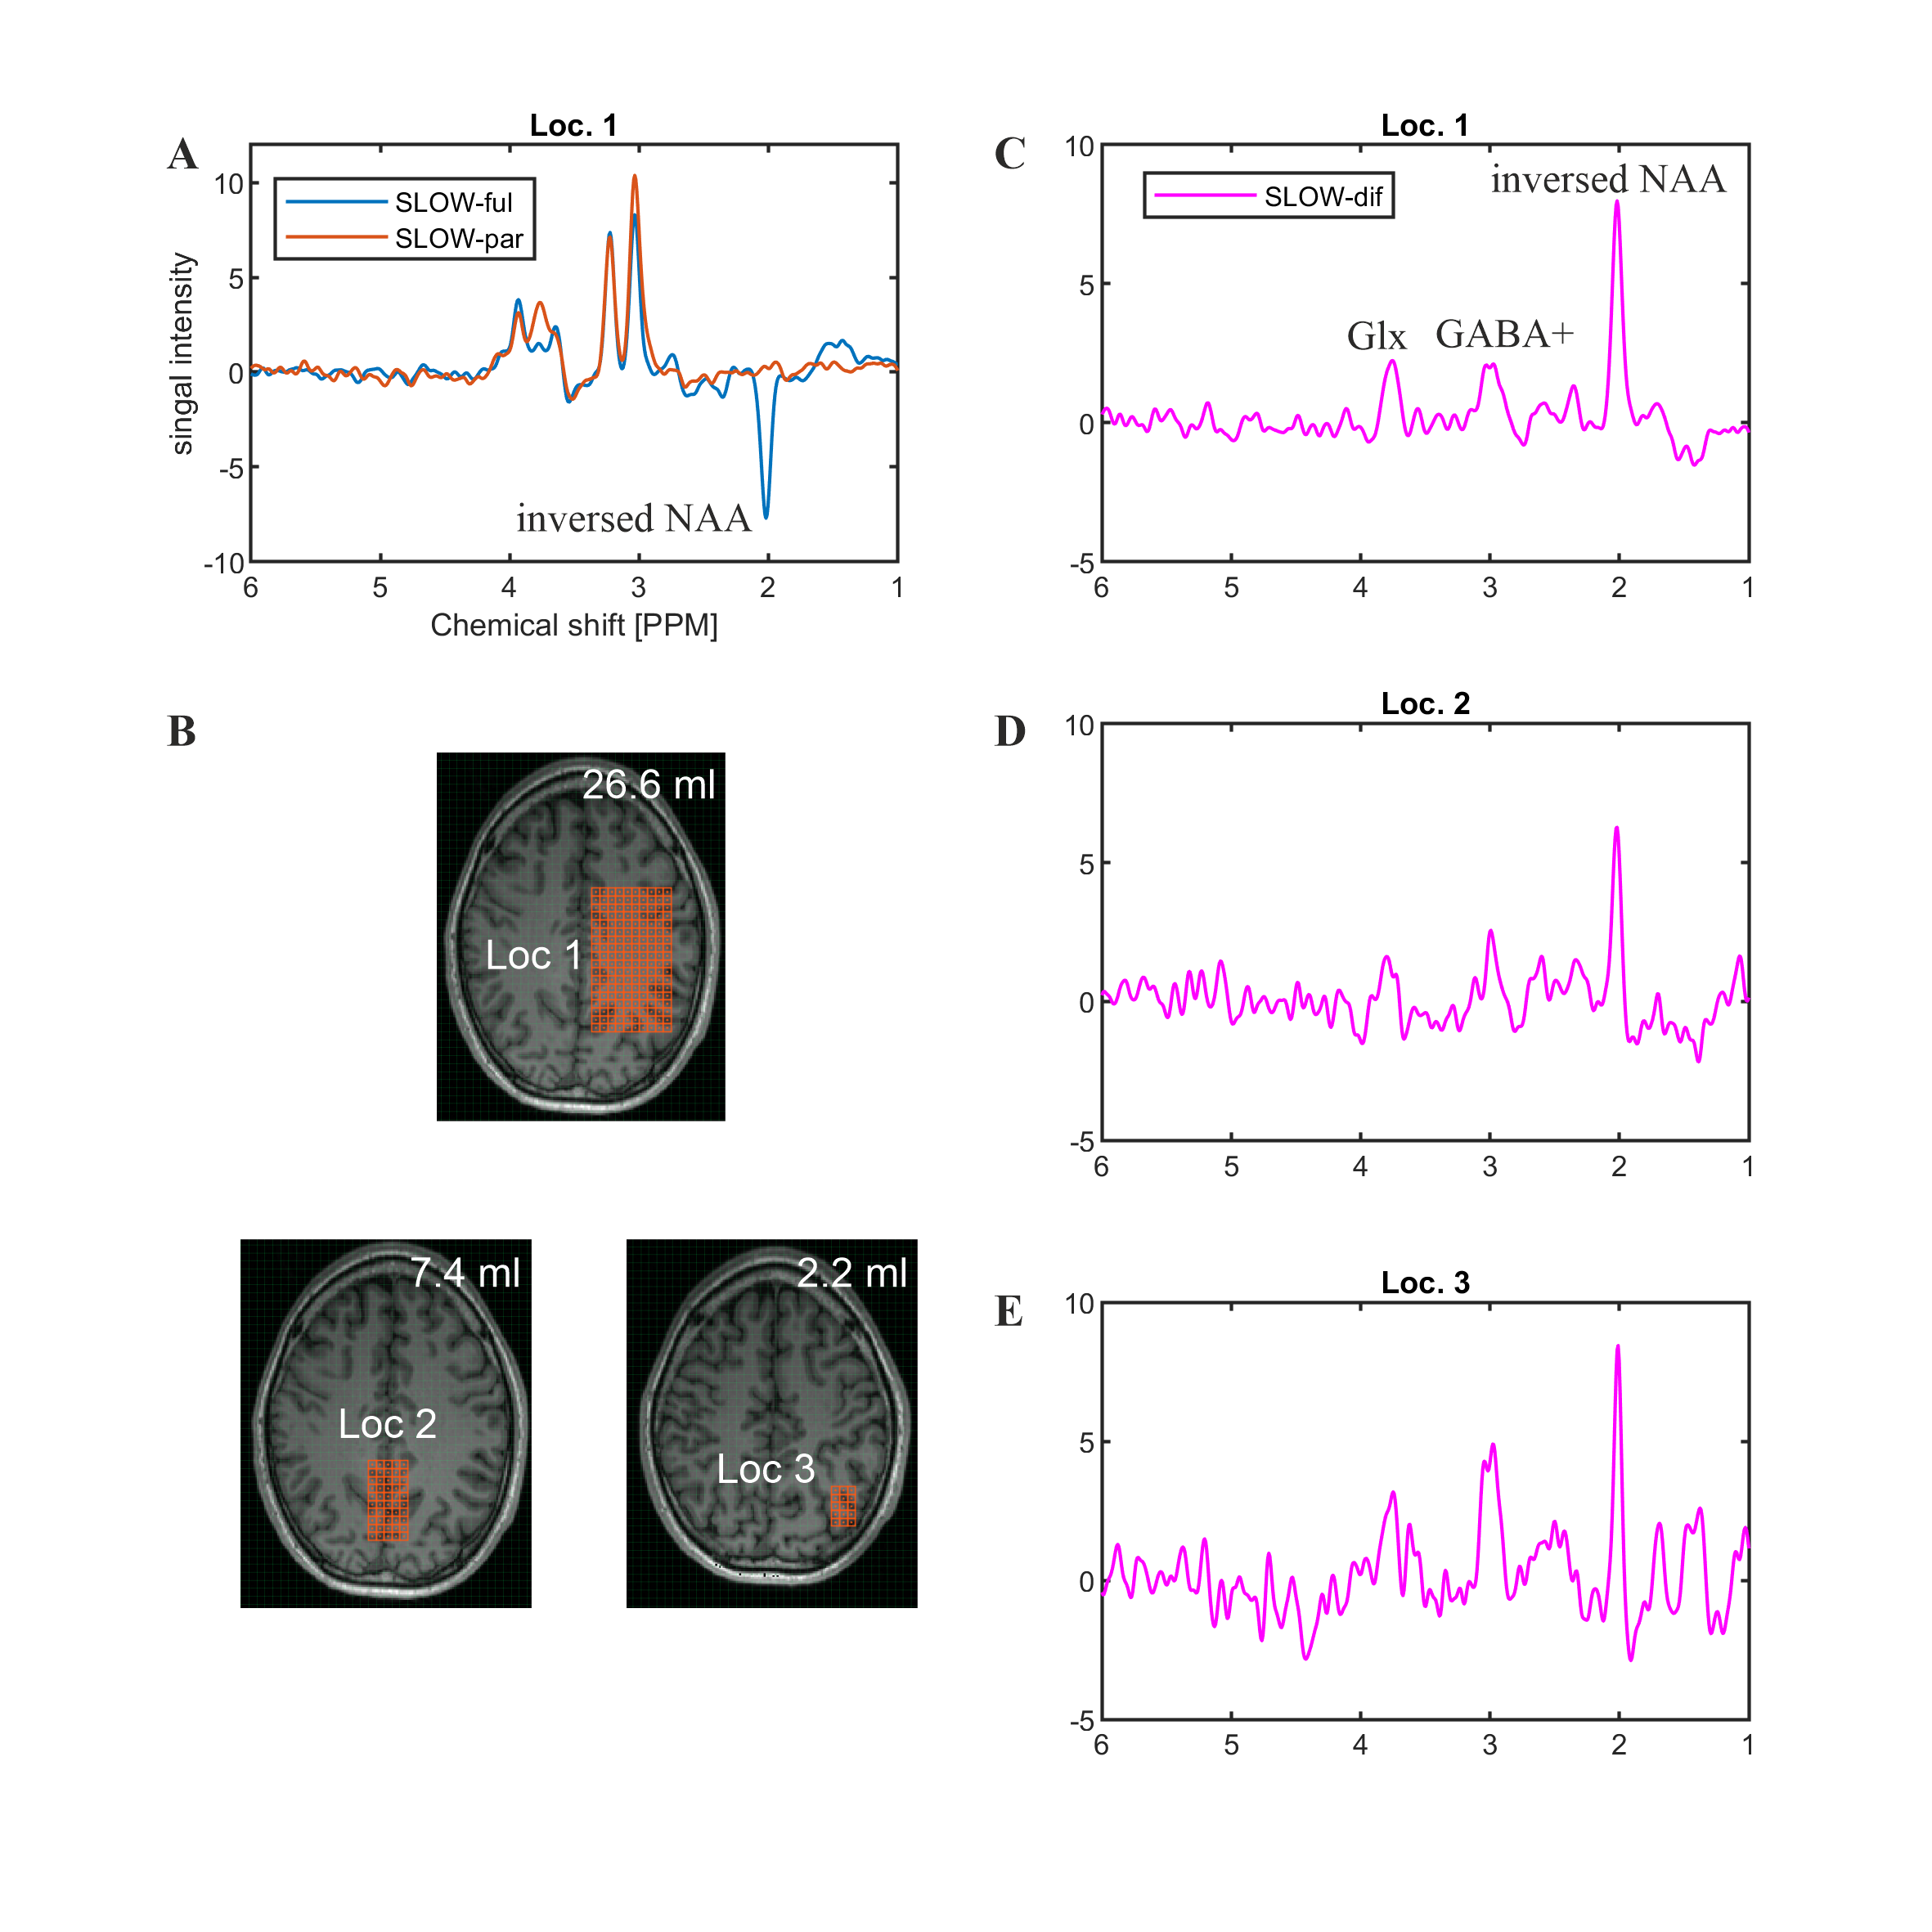
Figure 5: in vivo measurement with inv SLOW-GABA in a healthy subject. A) editing-full (SLOW-ful) and editing-partial (SLOW-par) spectra from location 1 (Loc 1 indicated in B). B) Selected volumes to represent spectrum at three locations with different volume sizes: Loc 1 (26.6 ml), Loc 2 (7.4 ml), and Loc 3 (2.2 ml). C-D) editing-difference spectra from location 1-3, respectively.