1839
Acceleration of preclinical 1H-FID-MRSI in vivo acquisitions at 14.1T using Compressed Sensing1Centre d'Imagerie Biomedical - CIBM, Lausanne, Switzerland, 2Animal Imaging and Technology, EPFL, Lausanne, Switzerland, 3LIFMET, EPFL, Lausanne, Switzerland
Synopsis
Keywords: Spectroscopy, Spectroscopy, MRSI, UHF, Compressed Sensing
Motivation: Preclinical Magnetic Resonance Spectroscopic Imaging offers valuable spatial information about metabolite content in the rodent brain, but is subjected to low signal-to-noise ratio and long acquisition time.
Goal(s): Our goal was to accelerate preclinical 1H-MRSI by implementing and validating compressed sensing acceleration schemes to enable accurate acquisitions under 10 minutes.
Approach: Free Induction Decay MRSI sets were acquired on the rodent brain using compressed sensing with different acceleration factors and k-space center acquired volumes.
Results: Metabolic maps and regional differences were preserved with higher acceleration factors, going from 13 minutes to 6.5 minutes acquisition and lower.
Impact: 1H-MRSI using compressed sensing, with its achieved 6.5 minutes acquisition, could be used for effective and reliable transversal metabolic studies of neurodegenerative diseases within preclinical models, such as the bile duct ligation rat model for hepatic encephalopathy.
Introduction
Proton free induction decay magnetic resonance spectroscopic imaging (1H-FID-MRSI) is a powerful tool for non-invasive brain metabolic mapping. At ultra-high field (UHF), this method has allowed successful investigation of neurodegenerative pathologies in clinical research1–3. 1H-FID-MRSI has recently been implemented on preclinical 14.1T resulting in reliable metabolic distributions4. Limitations with regards to low signal-to-noise ratio (SNR) and long acquisition time have been reported in both clinical and preclinical fields. Different solutions have been proposed to bypass the long acquisition time issue, employing non-cartesian encoding, parallel imaging or compressed sensing schemes5–8.Compressed sensing (CS) is an acquisition acceleration technique commonly used in standard clinical MRI9,10, and in 1H and X-nuclei MRSI7,11,12. This technique allows reconstructing of MRSI data by performing a sparse k-space sampling at the reconstruction or during acquisition. The acceleration factor (AF) is defined as the inverse of the fraction of the sampled k-space. The advantages of CS-MRSI are that it is not subjected to g-factor penalty, does not require calibration scans and can be combined with reconstruction methods such as Low Rank to achieve high‐resolution metabolite imaging7,13,14. Despite these advantages, CS has not yet been used for 1H-FID-MRSI in preclinical studies.
The aim of the present study was to implement and explore the advantages of CS 1H-FID-MRSI on preclinical 14.1T fast 1H-FID-MRSI datasets to achieve faster acquisition while preserving spectral quality and metabolic information.
Methods
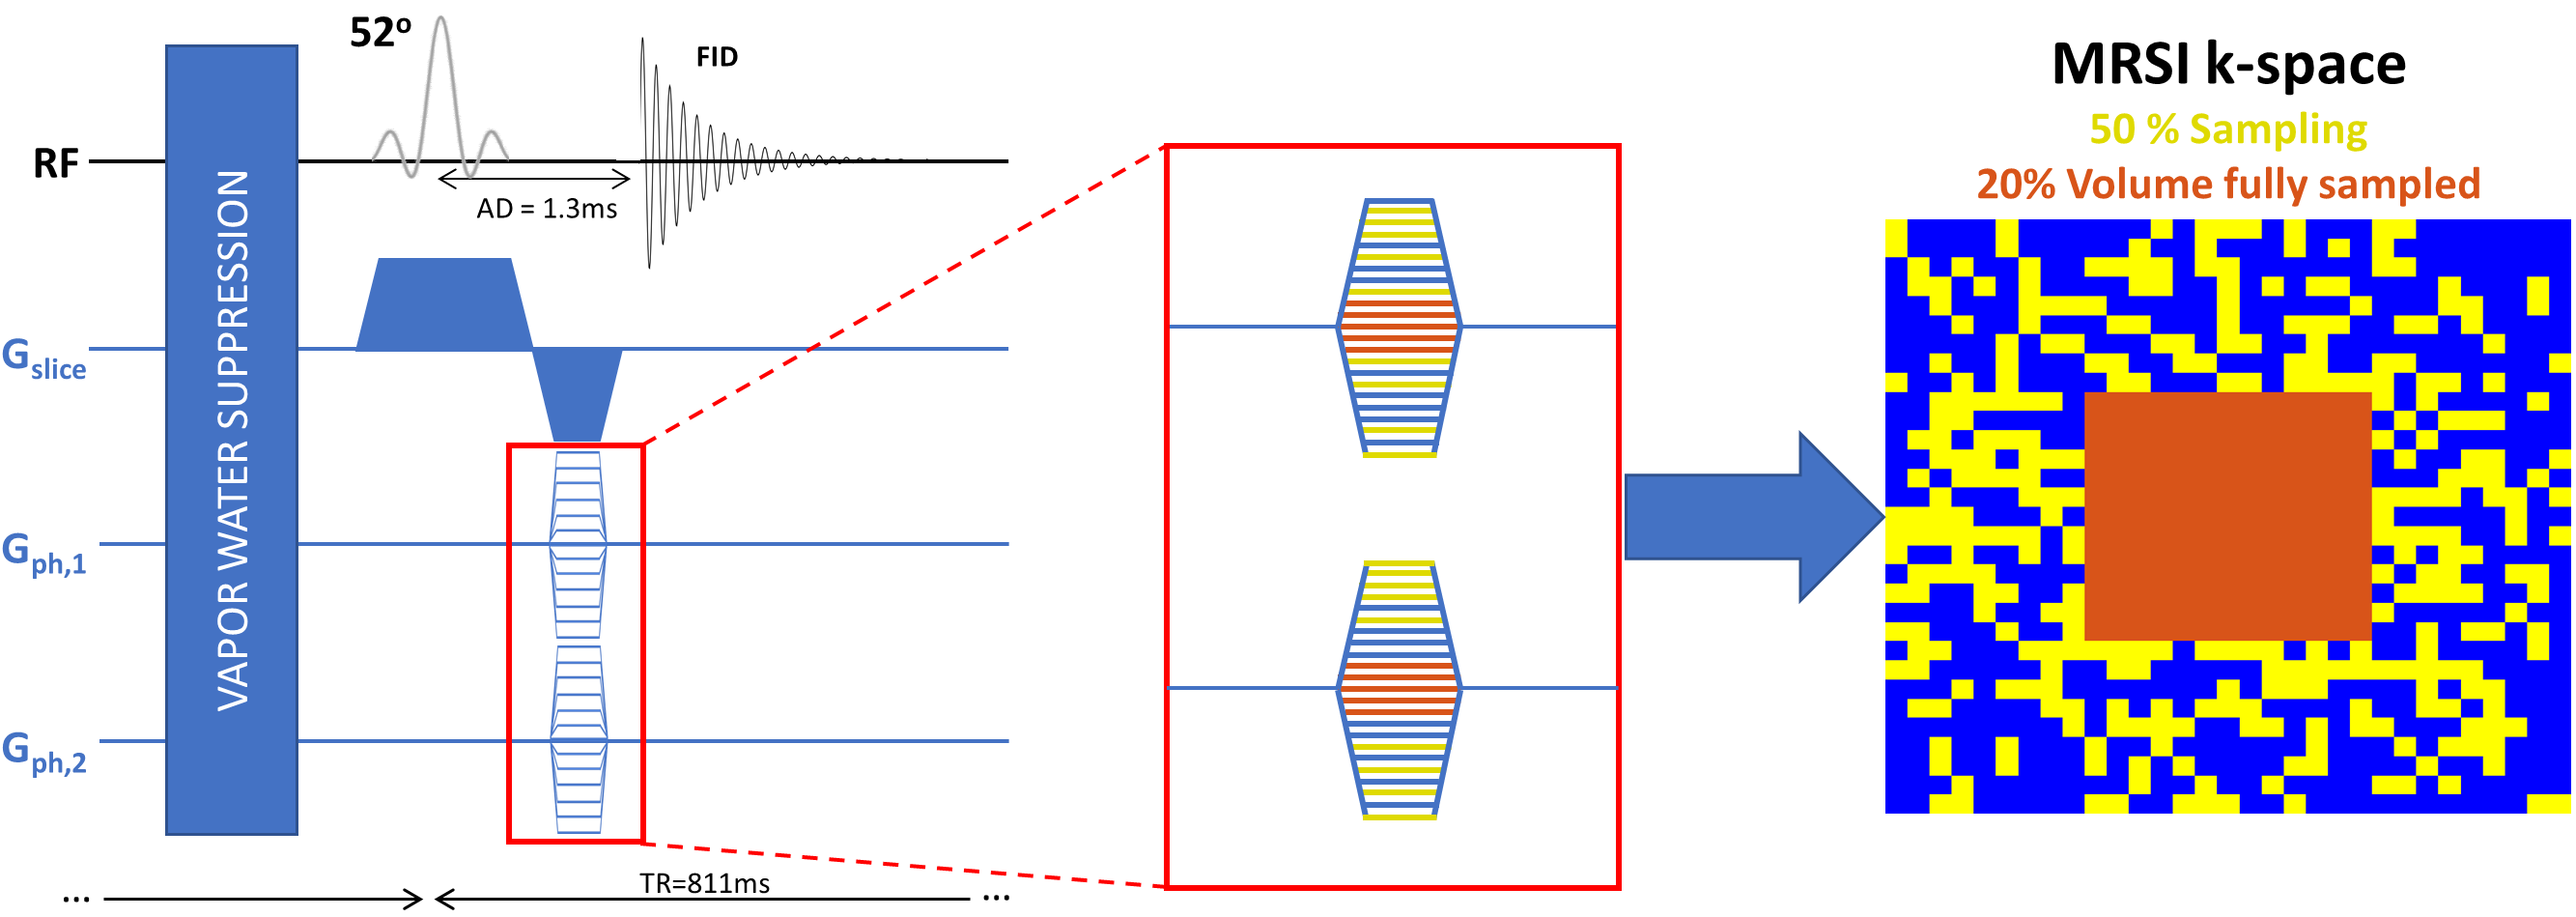
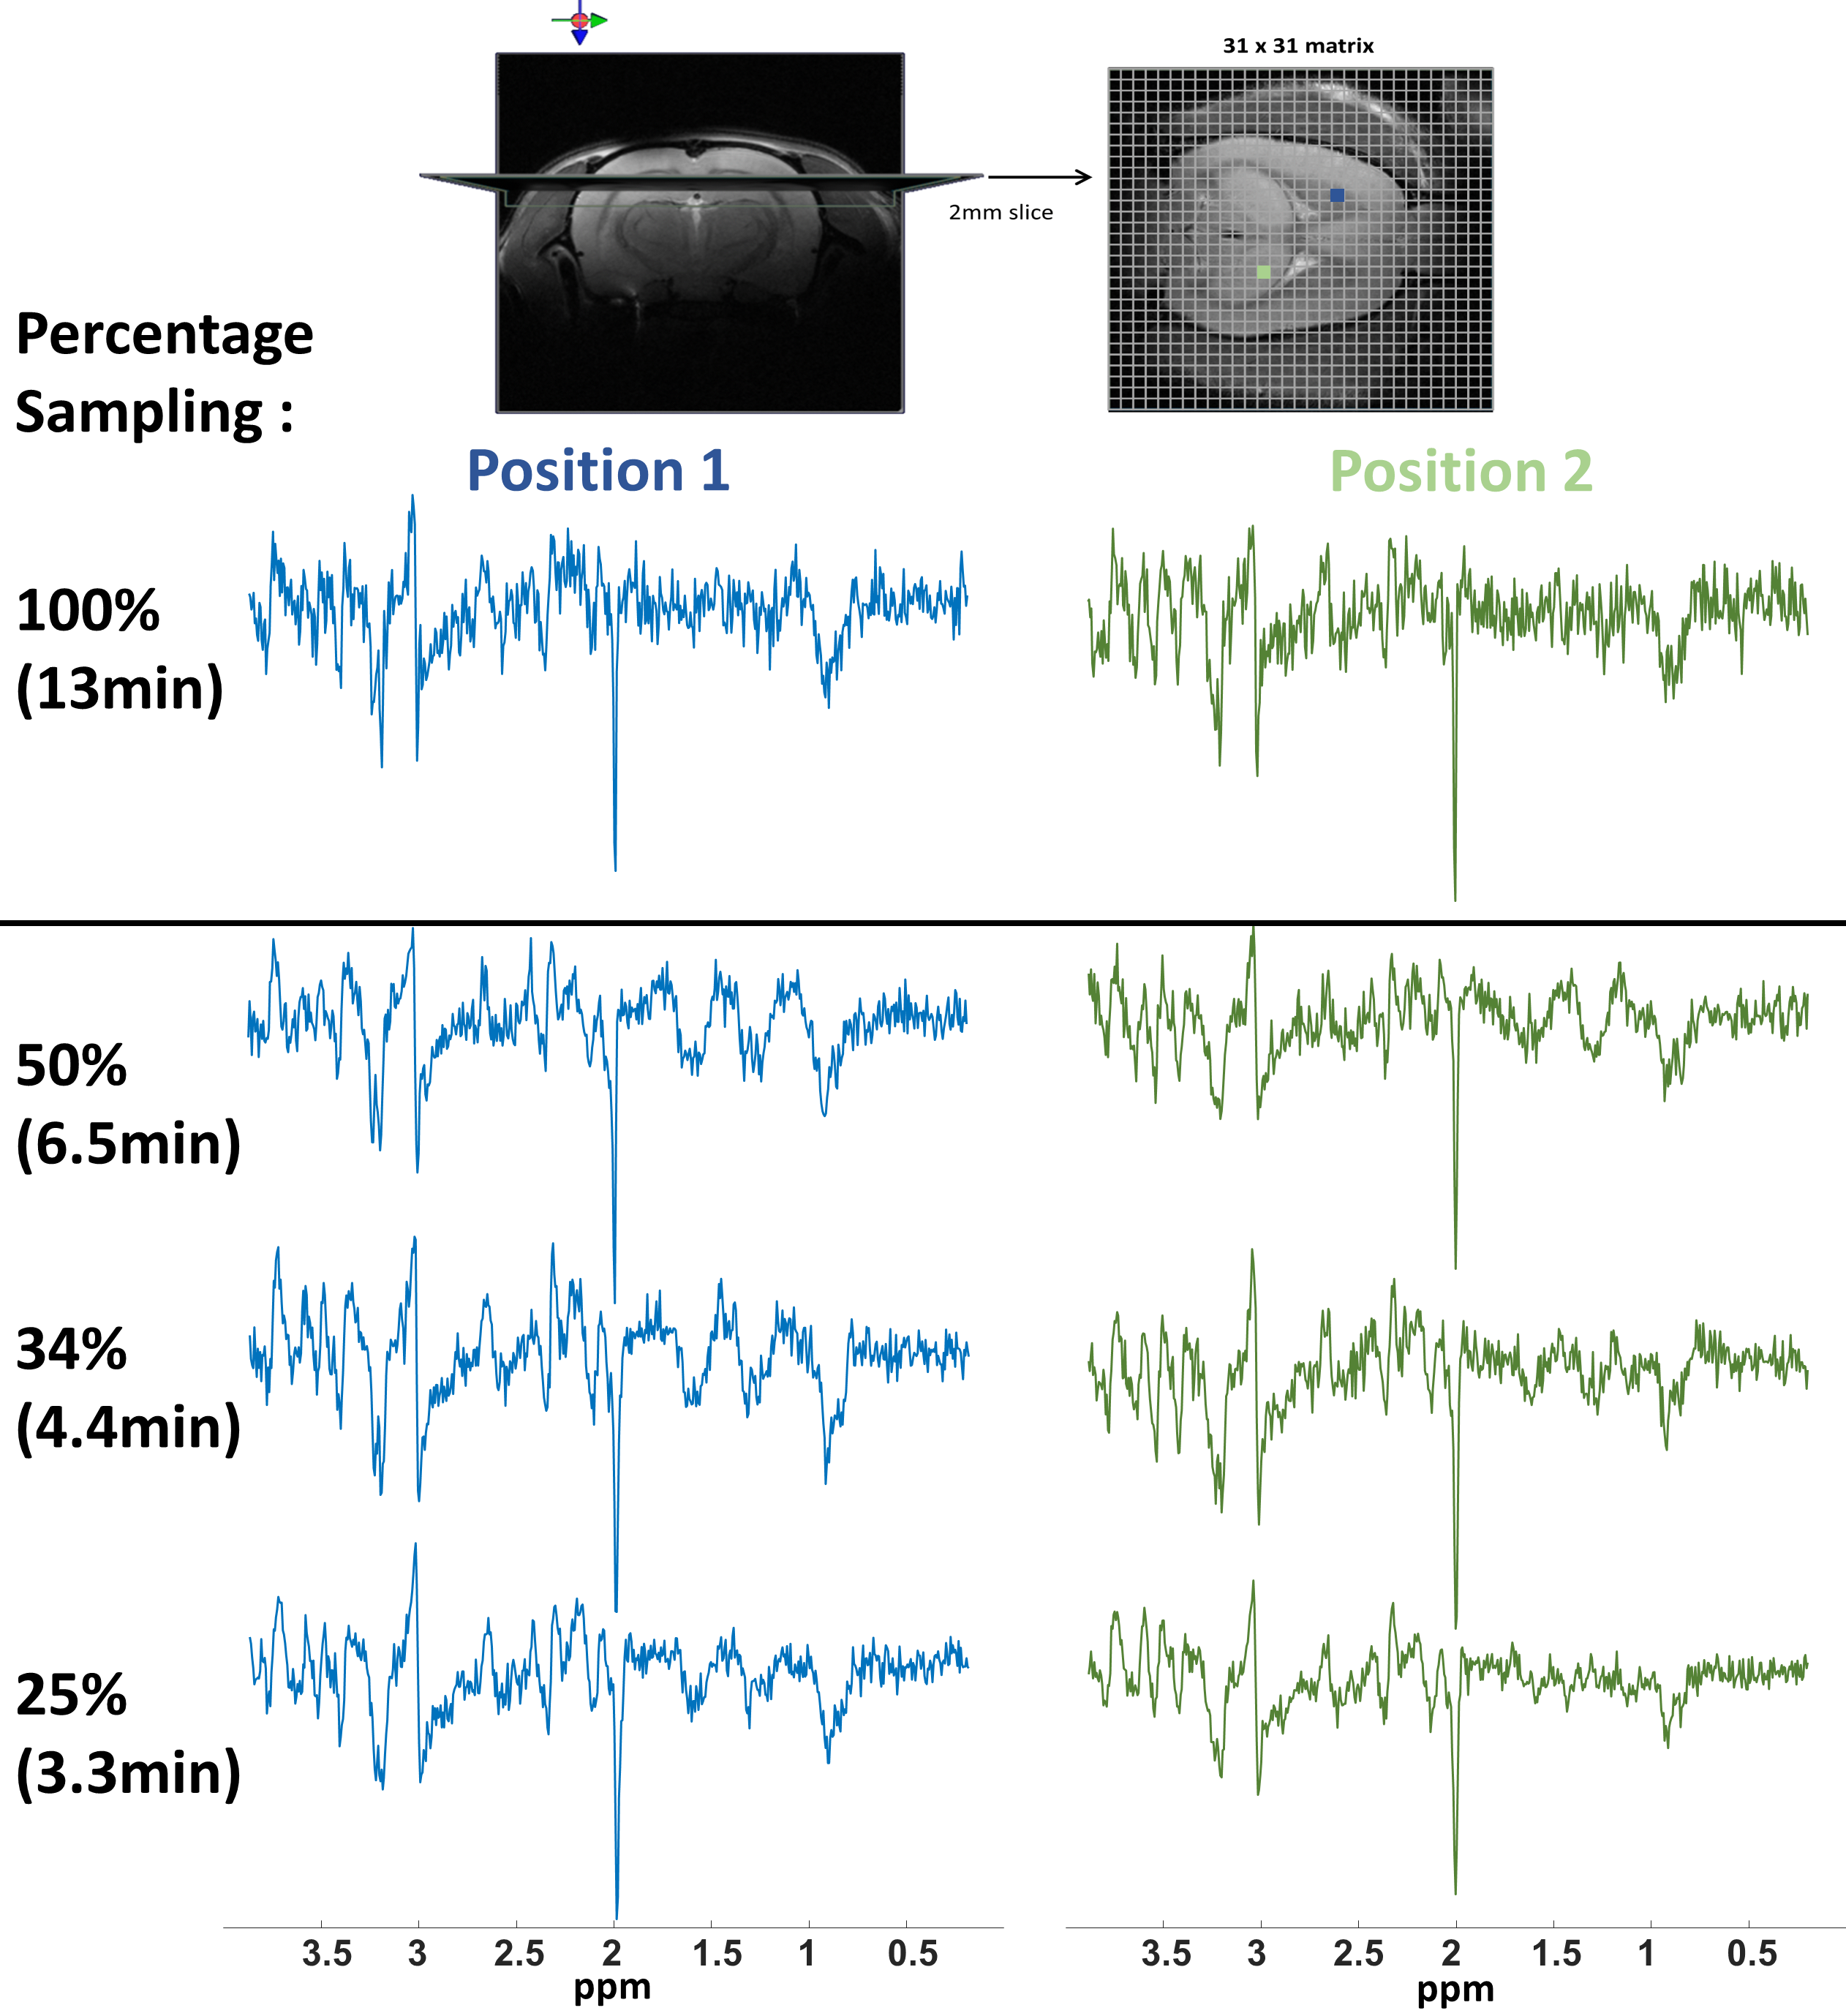
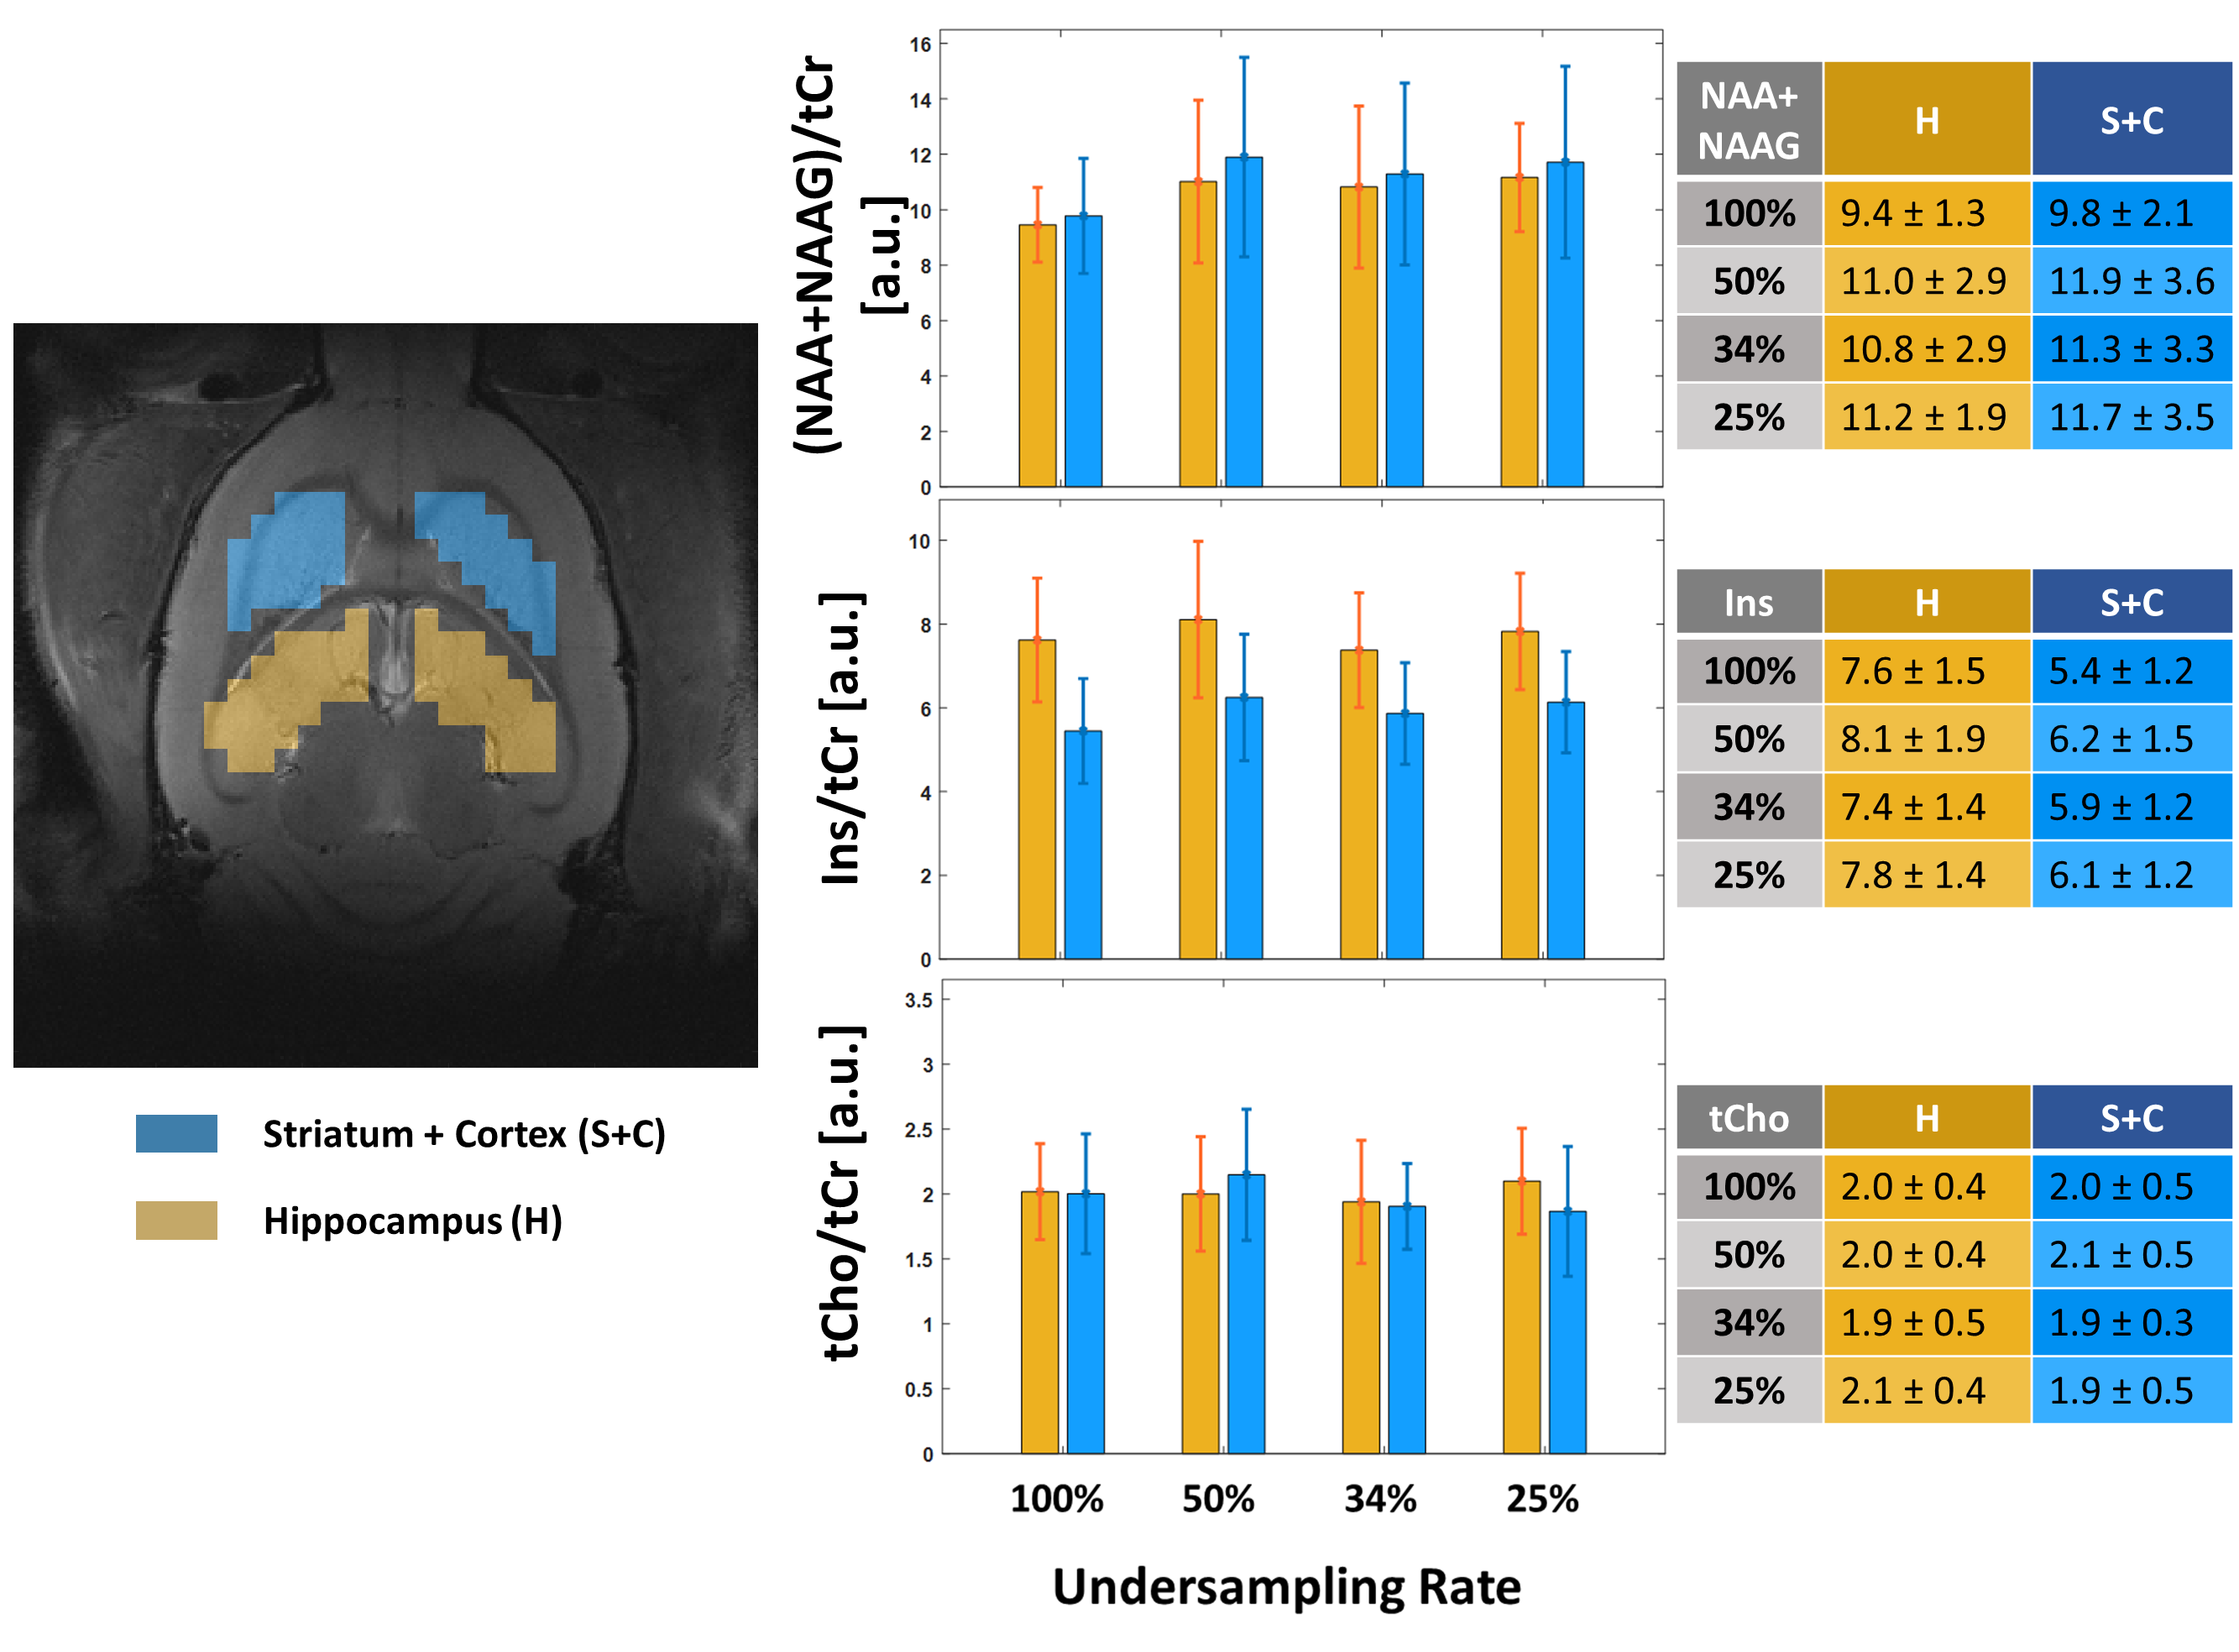
1H-MRSI data were acquired in the rat brain on a 14.1T MRI system (Bruker/Magnex Scientific) using a recently implemented single slice fast 1H-FID-MRSI sequence4 (TE=1.3ms, TR=813ms, 2mm slice thickness centered on hippocampus, FOV=24x24mm2, matrix size=31x31, 1 average). The standard acquisition (100% sampling) with Cartesian k-space sampling led to an acquisition time of 13 minutes while 50% undersampling to 6.5 minutes (n=4 rats). For 7 datasets, two parameters were modified during CS acquisitions: the percentage of k-space sampled (50%, 34%, 25% for AF=2,3,4 respectively) and the percentage of k-space volume fully sampled (10%, 20%, 30%, 40%, in the center) (Figure 1). The undersampled datasets were reconstructed online with Bruker software Paravision 360v.3.3.The MRS4Brain toolbox was used for data processing of all the MRSI datasets, with residual water and lipid removal applied. All spectra were quantified using LCModel (18 metabolites simulated using NMRScope-B/jMRUI15–17 and in vivo acquired macromolecules). Semi-automatic quality control based on the mean SNR, linewidth and CRLBs (≤30%) was applied. Atlas-based segmentation using coronal MRI acquisitions was performed for voxel selection in two brain regions: the hippocampus and a mix of striatum and cortex.
Results and Discussion
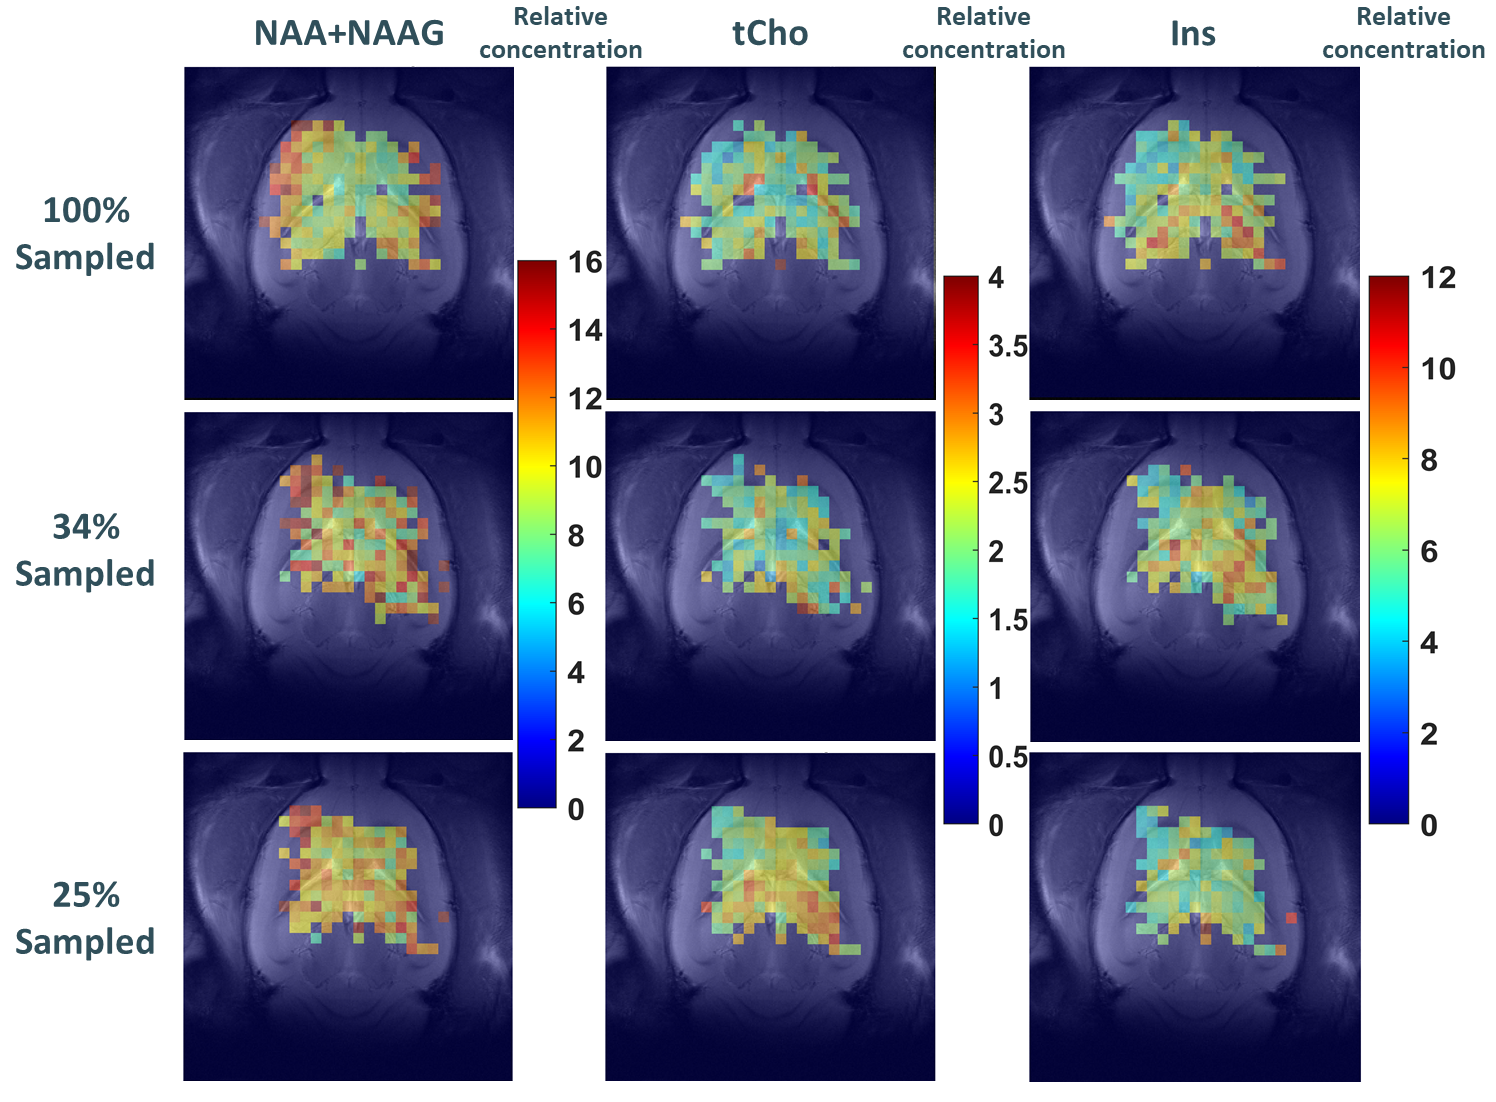
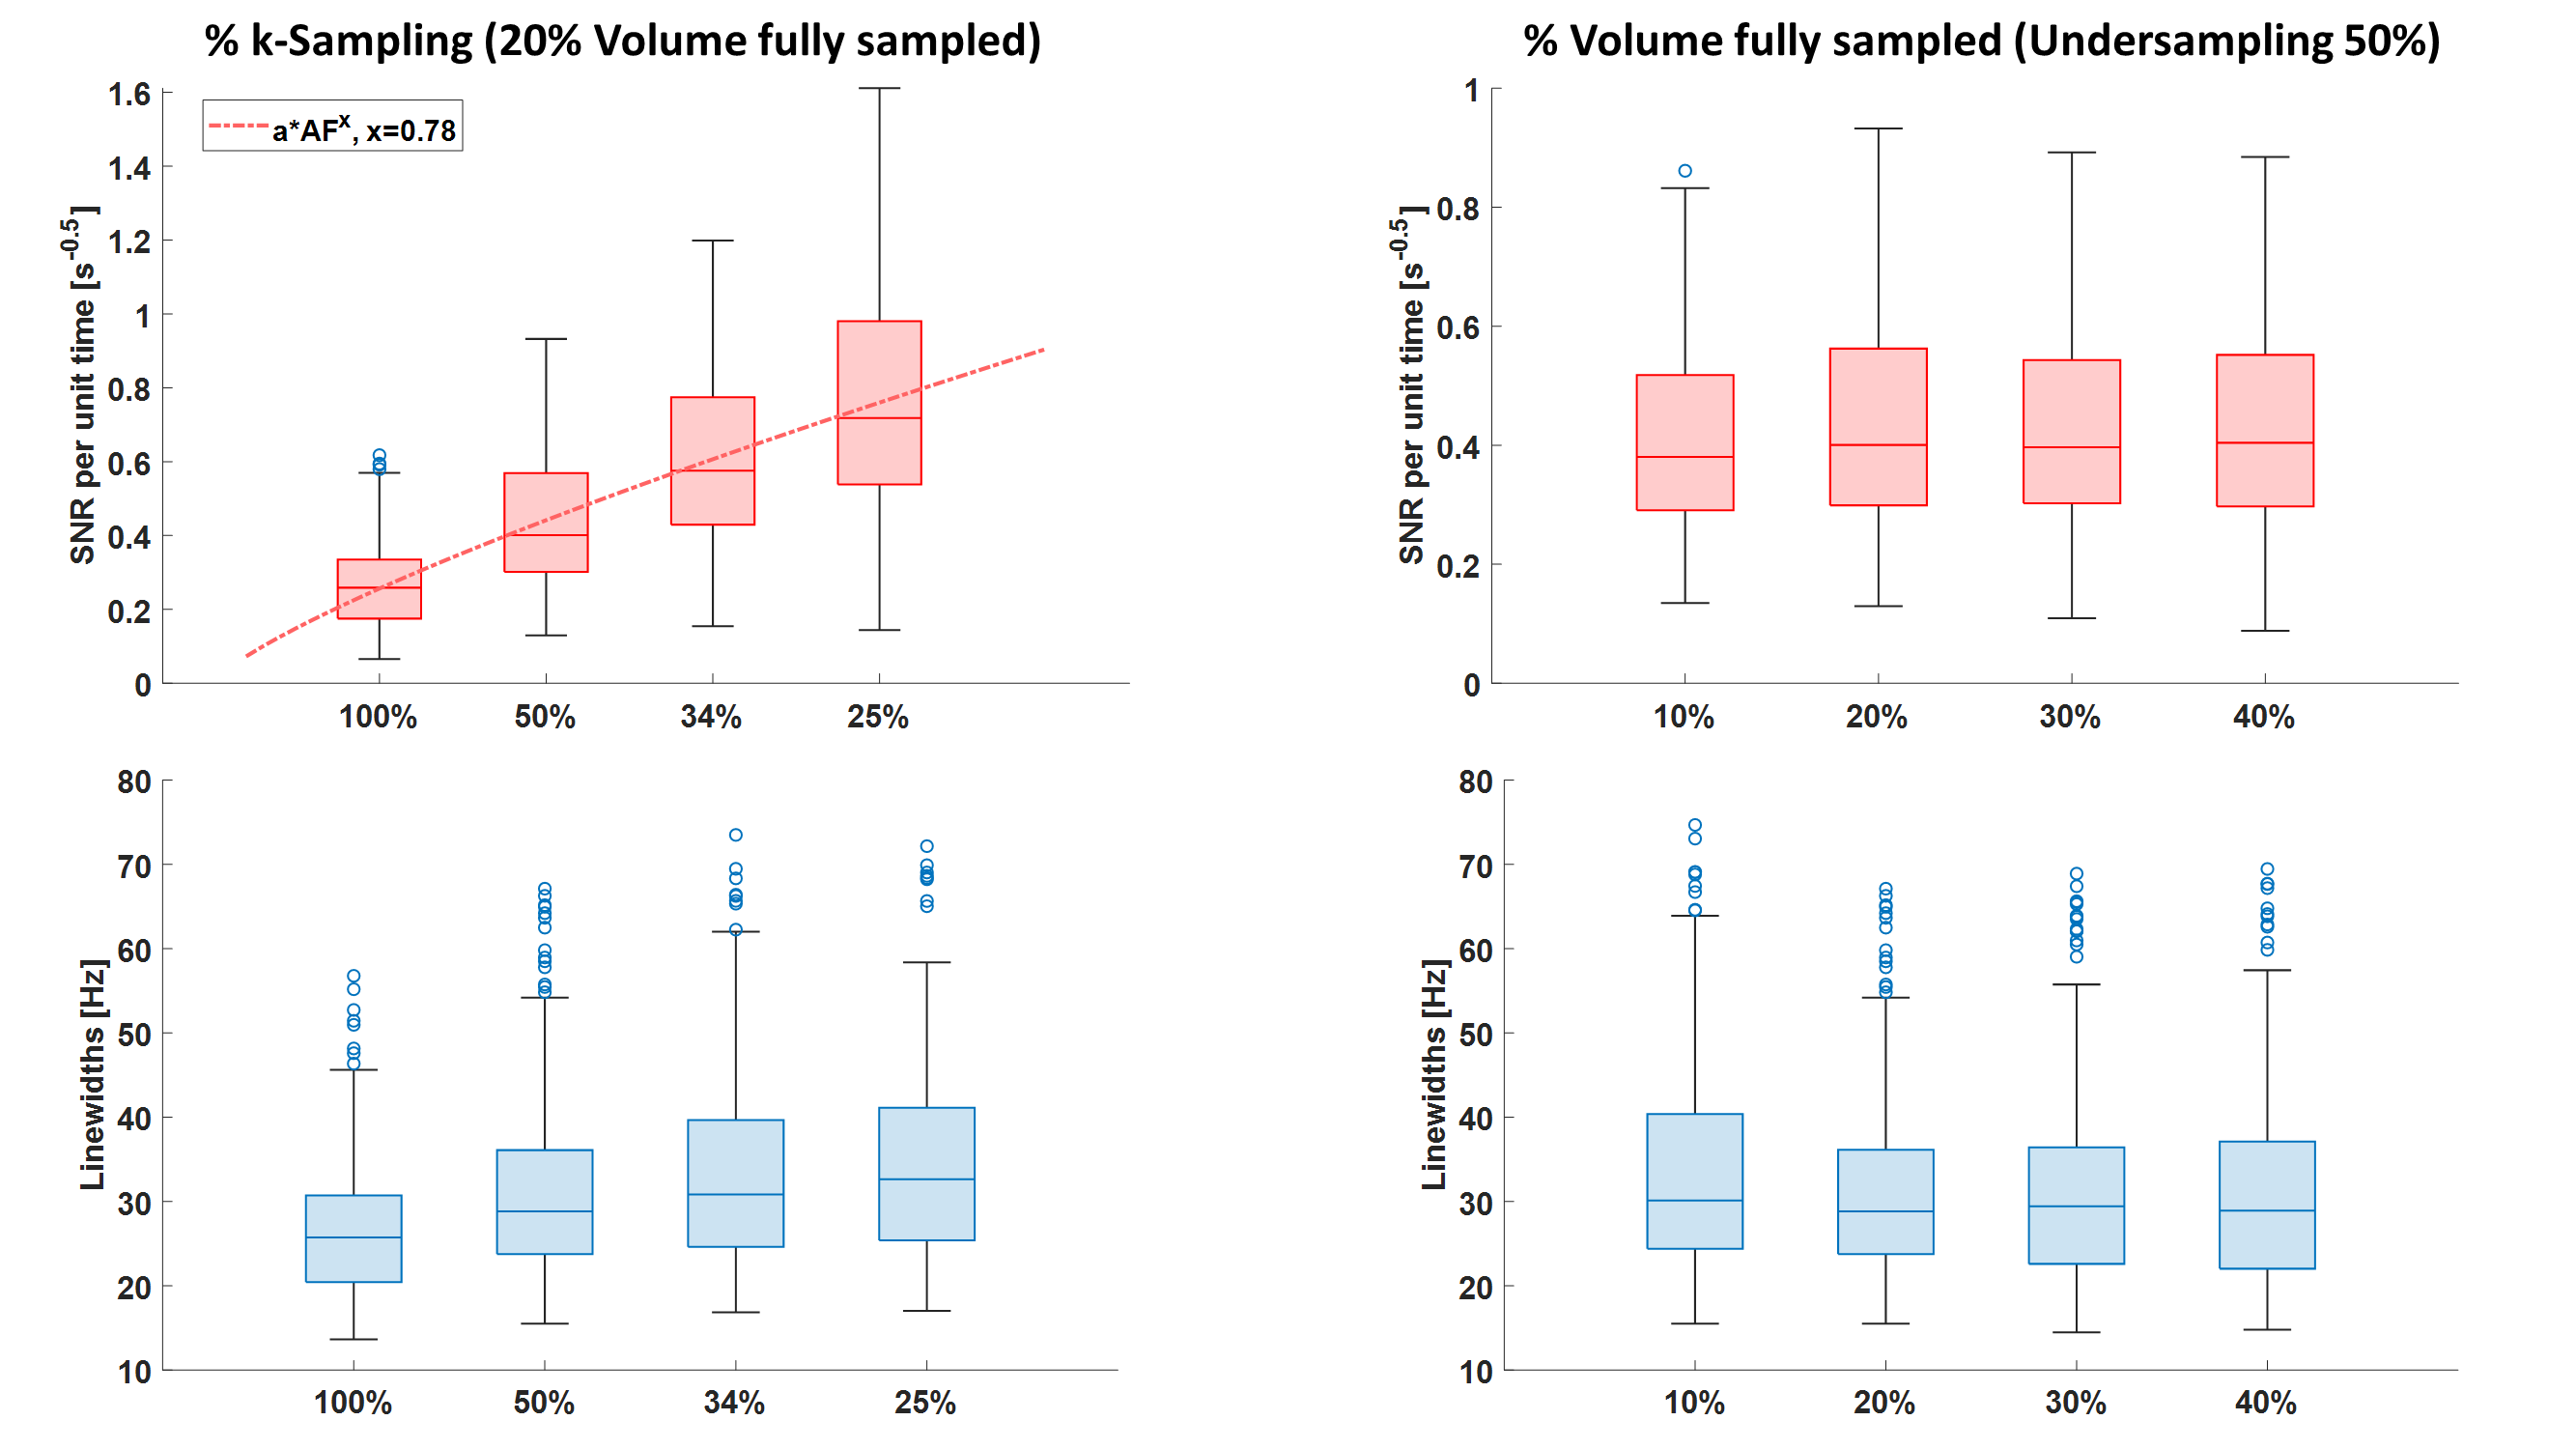
Spectra acquired with different AF preserved their spectral features when compared to the standard 100% acquisition (Figure 2). Eight metabolites of interest (tCr, NAA, tNAA, tCho, Gln, Glu, Ins, Tau) were reliably quantified (CRLBs≤30%) leading to reproducible metabolic maps. Maps of NAA+NAAG, tCho and Ins for undersampled sets are displayed in Figure 3. No changes in metabolic maps pattern or coverage losses were observed with any AF value. The quality control boxplots in Figure 4 show that the linewidth was preserved when both the AF and the volume of fully sampled k-space changed. The SNR per unit time (SNR divided by the square root of acquisition time) increased with the AF, following a power-fit with an exponent of 0.78. (fit in Figure 4). No significant changes were observed when modifying the percentage of volume fully sampled. The mean concentration estimation of NAA+NAAG, tCho and Ins in each region as well as the brain regional difference were preserved after application of CS (Figure 5). No significant difference between fully and 50% sampled was observed for Ins, NAA+NAAG and tCho (n=4 rats). An increase in lipid contamination, when increasing the AF, possibly due to aliasing artifacts was observed for a few voxels (i.e position 1, Figure 2) together with a small reduction of the spectral noise. Additionally, an increase of the standard deviation of NAA+NAAG was noted, potentially related to lipid contamination.Conclusion
We tested the feasibility of CS acceleration for preclinical 1H-FID-MRSI to achieve faster acquisitions. Results show promising potential for accurate metabolite mapping and further investigation with regards to the effects of lipid contamination and fully sampled core size will be explored. The average SNR per unit of time follows a power relation AF0.78, indicating that for a given acquisition duration, the SNR with different AFs would remain stable.Acknowledgements
We acknowledge access to the facilities and expertise of the CIBM Center for Biomedical Imaging founded and supported by Lausanne University Hospital (CHUV), University of Lausanne (UNIL), Ecole polytechnique fédérale de Lausanne (EPFL), University of Geneva (UNIGE) and Geneva University Hospitals (HUG). Financial support was provided by the Swiss National Science Foundation (Project No. 310030_201218)
References
1. Hangel G, Niess E, Lazen P, Bednarik P, Bogner W, Strasser B. Emerging methods and applications of ultra-high field MR spectroscopic imaging in the human brain. Anal Biochem. 2022;638:114479. doi:10.1016/j.ab.2021.114479
2. Hangel G, Cadrien C, Lazen P, et al. High-resolution metabolic imaging of high-grade gliomas using 7T-CRT-FID-MRSI. NeuroImage Clin. 2020;28:102433. doi:10.1016/j.nicl.2020.102433
3. Heckova E, Dal-Bianco A, Strasser B, et al. Extensive Brain Pathologic Alterations Detected with 7.0-T MR Spectroscopic Imaging Associated with Disability in Multiple Sclerosis. Radiology. 2022;303(1):141-150. doi:10.1148/radiol.210614
5. Bogner W, Otazo R, Henning A. Accelerated MR spectroscopic imaging—a review of current and emerging techniques. NMR Biomed. 2021;34(5). doi:10.1002/nbm.4314
6. Hingerl L, Bogner W, Moser P, et al. Density-weighted concentric circle trajectories for high resolution brain magnetic resonance spectroscopic imaging at 7T. Magn Reson Med. 2018;79(6). doi:10.1002/mrm.26987
7. Klauser A, Strasser B, Thapa B, Lazeyras F, Andronesi O. Achieving high-resolution 1H-MRSI of the human brain with compressed-sensing and low-rank reconstruction at 7 Tesla. J Magn Reson. 2021;331:107048. doi:10.1016/j.jmr.2021.107048
8. Strasser B, Považan M, Hangel G, et al. (2 + 1)D-CAIPIRINHA accelerated MR spectroscopic imaging of the brain at 7T. Magn Reson Med. 2017;78(2):429-440. doi:10.1002/mrm.26386
9. Sharma SD, Fong CL, Tzung BS, Law M, Nayak KS. Clinical image quality assessment of accelerated magnetic resonance neuroimaging using compressed sensing. Invest Radiol. 2013;48(9):638-645. doi:10.1097/RLI.0b013e31828a012d
10. Delattre BMA, Boudabbous S, Hansen C, Neroladaki A, Hachulla AL, Vargas MI. Compressed sensing MRI of different organs: ready for clinical daily practice? Eur Radiol. 2020;30(1):308-319. doi:10.1007/s00330-019-06319-0
11. Hatay GH, Yildirim M, Ozturk-Isik E. Considerations in applying compressed sensing to in vivo phosphorus MR spectroscopic imaging of human brain at 3T. Med Biol Eng Comput. 2017;55(8):1303-1315. doi:10.1007/s11517-016-1591-9
12. Chatnuntawech I, Gagoski B, Bilgic B, Cauley SF, Setsompop K, Adalsteinsson E. Accelerated 1H MRSI using randomly undersampled spiral-based k-space trajectories. Magn Reson Med. 2014;24(July 2014):13-24. doi:10.1002/mrm.25394
13. Klauser A, Courvoisier S, Kasten J, et al. Fast high-resolution brain metabolite mapping on a clinical 3T MRI by accelerated 1H-FID-MRSI and low-rank constrained reconstruction. Magn Reson Med. 2019;81(5):2841-2857. doi:10.1002/mrm.27623
14. Lustig M, Donoho D, Pauly JM. Sparse MRI: The application of compressed sensing for rapid MR imaging. Magn Reson Med. 2007;58(6):1182-1195. doi:10.1002/mrm.21391
15. Starčuk Z, Starčuková J. Quantum-mechanical simulations for in vivo MR spectroscopy: Principles and possibilities demonstrated with the program NMRScopeB. Anal Biochem. 2017;529:79-97. doi:10.1016/j.ab.2016.10.007
16. Govindaraju V MA Young K. Proton NMR chemical shifts and coupling constants for brain metabolites. NMR Biomed. 2000;13:129-153. doi:10.1002/1099-1492(200005)13:33.3.CO;2-M
17. Govind V, Young K, Maudsley AA. Corrigendum to Proton NMR chemical shifts and coupling constants for brain metabolites. [NMR Biomed. 13, (2000), 129-153]. NMR Biomed. 2015;28(7):923-924. doi:10.1002/nbm.3336
Figures