1838
Effect of FID-MRSI backward linear prediction with autoregressive algorithm on metabolite estimates for compensation of acquisition delay1CIBM Center for Biomedical Imaging, Lausanne, Switzerland, 2Animal Imaging and Technology, EPFL, Lausanne, Switzerland
Synopsis
Keywords: Spectroscopy, Spectroscopy, MRSI, Acquisition Delay, FID-MRSI, Ultra-high field, Preclinical, Rat
Motivation: 1H Free-Induction Decay (FID) MRSI is limited by the acquisition delay (AD) between the RF excitation pulse and the FID signal. N initial data points are thus lost.
Goal(s): Our goal was to evaluate the consistency of the Backward Linear Prediction (BLP) auto-regressive reconstruction method to recover the lost FID data points.
Approach: In-vivo rat data were used to investigate the impact of the BLP methodology in a cut-and-recover approach; further Monte-Carlo simulations were used to identify the method validity limit.
Results: In-vivo and Monte-Carlo results highlighted the consistency of the BLP methodology for realistic FID reconstruction ranges.
Impact: Focusing on metabolites of interest, no significant variations of brain map concentrations have been detected between original FID acquisitions and BLP reconstruction outcomes between AD=1.3ms and AD=0.708ms. Moreover, Monte Carlo simulations showed good quantification reliability until AD=2.7 ms.
Introduction
Free induction decay magnetic resonance spectroscopic imaging (1H-FID-MRSI) acquisitions at ultra-high field systems benefit from minimal signal losses through T2 relaxation and J-evolution, reduced chemical shift displacement errors and sensitivity to B0 inhomogeneity1–3. A disadvantage of 1H-FID-MRSI is the delay required between the excitation pulse and the FID acquisition to spatially encode the signal (Fig.1a). Depending on the available gradient performances, this delay can vary. In high performance systems, it is typically between 0.7 and 1.5ms. For 1H-FID-MRSI, signal quantification was proposed either by adapting the basis-set simulation by removing the first points of all FIDs in the simulated metabolites2, or by prediction of the missing points at the beginning of the measured FIDs using a backward linear prediction (BLP) autoregressive algorithm3–5. Although BLP showed powerful performances in correcting for the spectrum phase3 (Fig.1b), using an FID cut-and-recover approach shows some mismatch between the BLP-predicted first FID points and the corresponding measured FID (Fig.1c).Here we propose to evaluate the effect on metabolites concentration estimation of the BLP predicting strategy with a cut-and-recover approach, first to adapt in vivo acquisitions to a common acquisition delay and second for the quantification with a zero-delay basis set, using Monte-Carlo simulations.
Methods
The in-vivo BLP analysis is based on experimental single slice 1H-FID-MRSI rat data acquired at 14.1T (Bruker/Magnex Scientific) (AD=0.708ms, time-domain sampling=1024 points, slice thickness=2mm, FOV=24x24mm2, matrix size=31x31, 1 average). To analyse the potential of applying the BLP autoregressive method to correct acquisitions with different delays to a common reference delay and quantification basis-set of 0.708 ms, a full MRSI set acquired with AD=0.708ms served as its own reference by eliminating the first 4 time-domain points for each k-space component, as shown in Fig.1b, corresponding to a usual experimental AD=1.3ms. The data set was then back-calculated to an AD=0.708ms with BLP in Matlab (fillgaps function) and compared to the original uncut data and further quantified with the use of LCModel (basis-set simulated for AD = 0.708 ms).In a second step, Monte-Carlo simulations (1000 realisations) were performed based on typical reference spectra (AD=0ms, SNR=12, absence of water and lipids signal) corresponding to a single MRSI voxel with same acquisition parameters as the presented in-vivo acquisitions and realistic noise, concentrations values6 for 19 metabolites of interest and macromolecules.
An analogous BLP procedural scheme as for the in-vivo case was applied to 8 different data-cutting scenarios: 2, 4, 7, 11, 15, 20, 30 and 40 reconstructed time-domain points (corresponding to AD=0.14, 0.42, 0.84, 1.4, 2, 2.7, 4.1, 5.5ms, respectively), aiming at testing the consistency of the BLP FID reconstruction method for various AD and determining a potential threshold at which BLP FID reconstruction diverges for given metabolites. The results were quantified with LCModel with a basis-set at AD=0ms. Quantification accuracy and precision over the range of cut-and-recover points was evaluated over the 1000 Monte-Carlo simulations.
Results and Discussion
The cut-and-recover analysis of BLP reconstruction for in vivo data between AD=1.3ms and AD=0.708ms resulted in spectra (Fig.2) and brain metabolites concentration maps (Fig.3) in close agreement with the original 1H-FID-MRSI acquisition outputs. For this extent of recovered points, BLP back-reconstructed spectra do not display a significant quality deterioration. In addition, the concentration maps (Fig. 3) show no detectable degradation, highlighting the consistency of the methodology among the different voxels.The back-calculated spectra at AD=0ms in the Monte-Carlo analysis (Fig.4) showed high consistency in the spectral recovery, only showing visible biases for more than 20 BLP recovered points (AD=2.7ms). An increasing trend of baseline components was observed as the number of recovered points rose, potentially inducing a quantification bias for different metabolite components, which was further analysed by LCModel quantification (Fig.5). Monte-Carlo quantification results showed moderate effect of the BLP reconstruction on metabolites quantification with high consistency for the dominant brain metabolites (Ins, Glu, Gln, Tau, tCho, NAA+NAAG) up to AD=4.1ms for Glu and 2.7ms for NAA+NAAG. It is worth noting that the simulation conditions were undertaken under relatively good SNR conditions (SNR=12) and further analyses will evaluate the performance of BLP reconstruction in less favourable conditions.
Conclusion
The self-referencing cut-and-recover approach to analyse the BLP recovery of initial FID points showed a strong consistency for moderate data recovery between AD=1.3ms and 0.708ms (4 points) for in-vivo conditions, and good quantification reliability until 20 data points (AD=2.7ms) in Monte-Carlo simulation studies. This approach can be used to determine the maximal usable 1H-FID-MRSI AD in given in-vivo conditions or to evaluate the soundness of regressing data acquired with different ADs to a common quantification basis set.Acknowledgements
We acknowledge access to the facilities and expertise of the CIBM Center for Biomedical Imaging founded and supported by Lausanne University Hospital (CHUV), University of Lausanne (UNIL), Ecole polytechnique fédérale de Lausanne (EPFL), University of Geneva (UNIGE) and Geneva University Hospitals (HUG). Financial support was provided by the Swiss National Science Foundation (Project No. 205321L_207935 and 310030_201218).
References
2. Bogner W, Gruber S, Trattnig S, Chmelik M. High-resolution mapping of human brain metabolites by free induction decay 1H MRSI at 7T. NMR Biomed. 2012;25:873-882. doi:10.1002/nbm.1805
3. Henning A. Proton and multinuclear magnetic resonance spectroscopy in the human brain at ultra-high field strength: A review. NeuroImage. 2018;168:181-198. doi:10.1016/j.neuroimage.2017.07.017
4. Kay LE. Protein dynamics from NMR. Nat Struct Biol. 1998;5 Suppl:513-517. doi:10.1038/755
5. Klauser A, Courvoisier S, Kasten J, et al. Fast high-resolution brain metabolite mapping on a clinical 3T MRI by accelerated 1H-FID-MRSI and low-rank constrained reconstruction. Magn Reson Med. 2019;81(5):2841-2857. doi:10.1002/mrm.27623
Figures
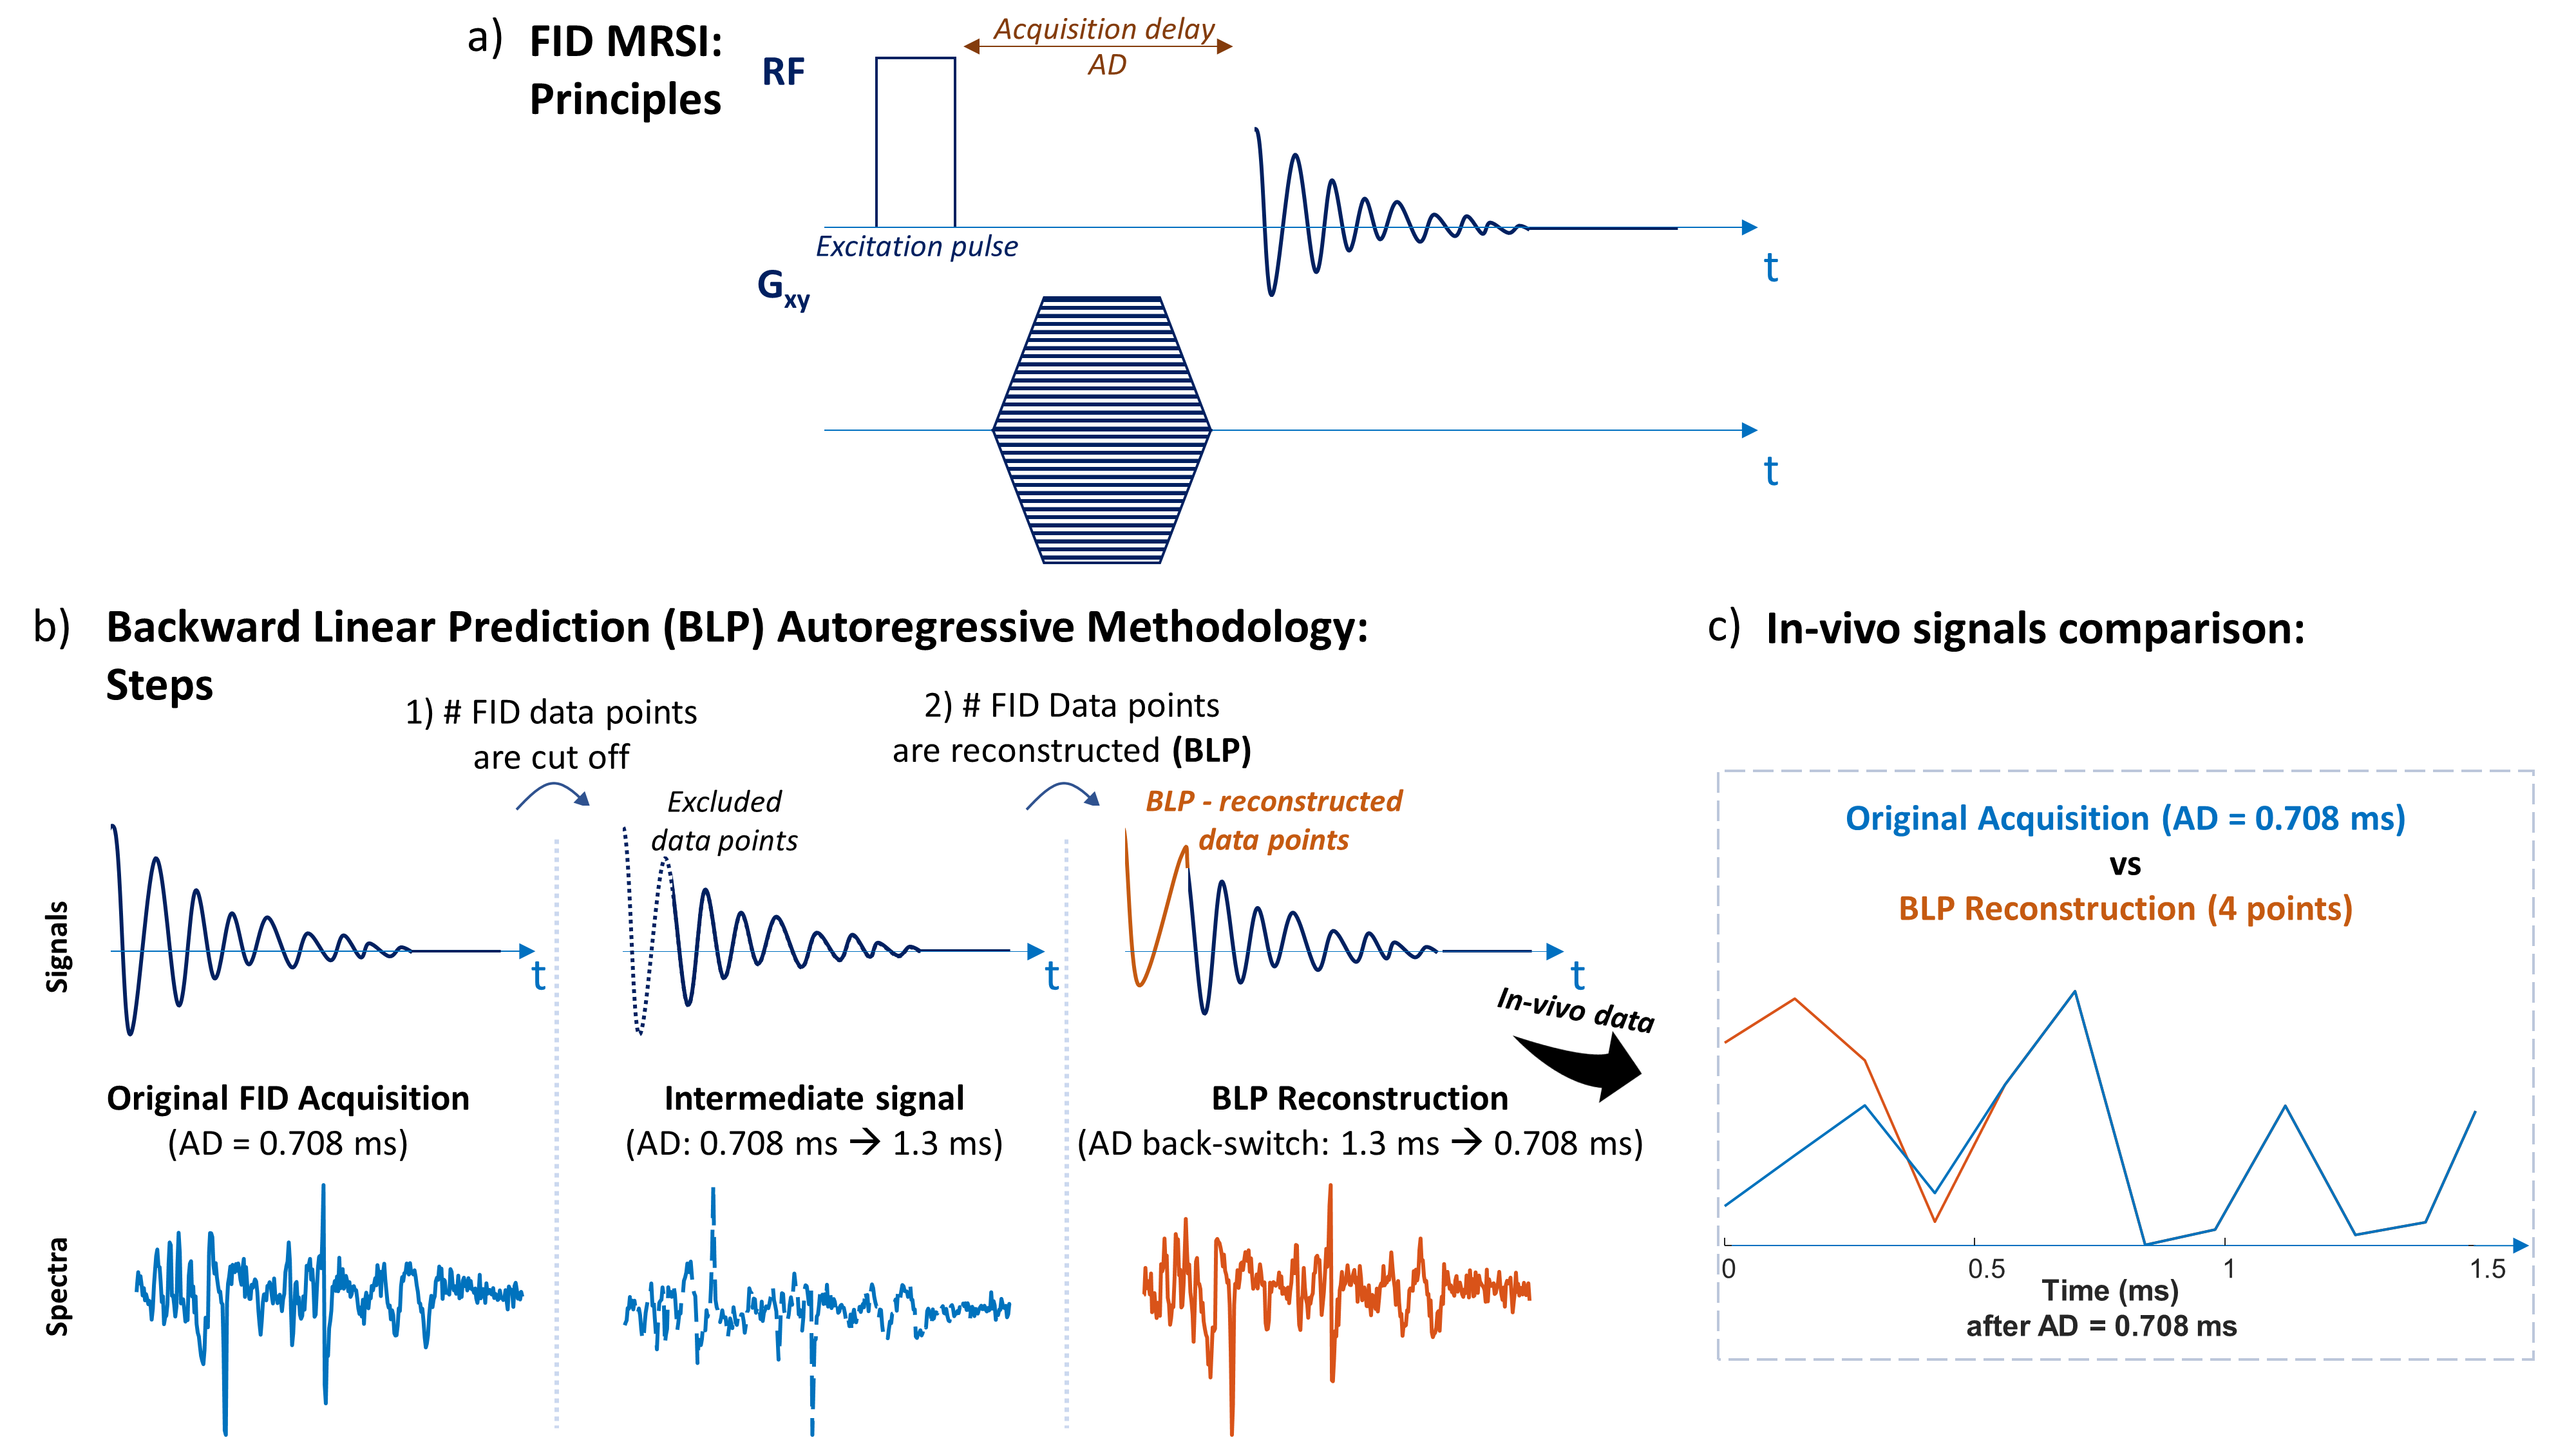
Figure 1: a) FID-MRSI principles: the FID signal is acquired with a delay after the excitation pulse, to enable phase-encoding gradients to spatially encode the signal. This results in some missing initial points in the measured FID b) Consistency tests of the BLP autoregressive algorithm to recover the first FID points: self-consistency is tested by cutting initial FID points and recovering them with BLD. The examples show in vivo MRSI spectra and FID acquired with a delay of 0.708 ms, cut to a delay of 1.3ms back-reconstructed.
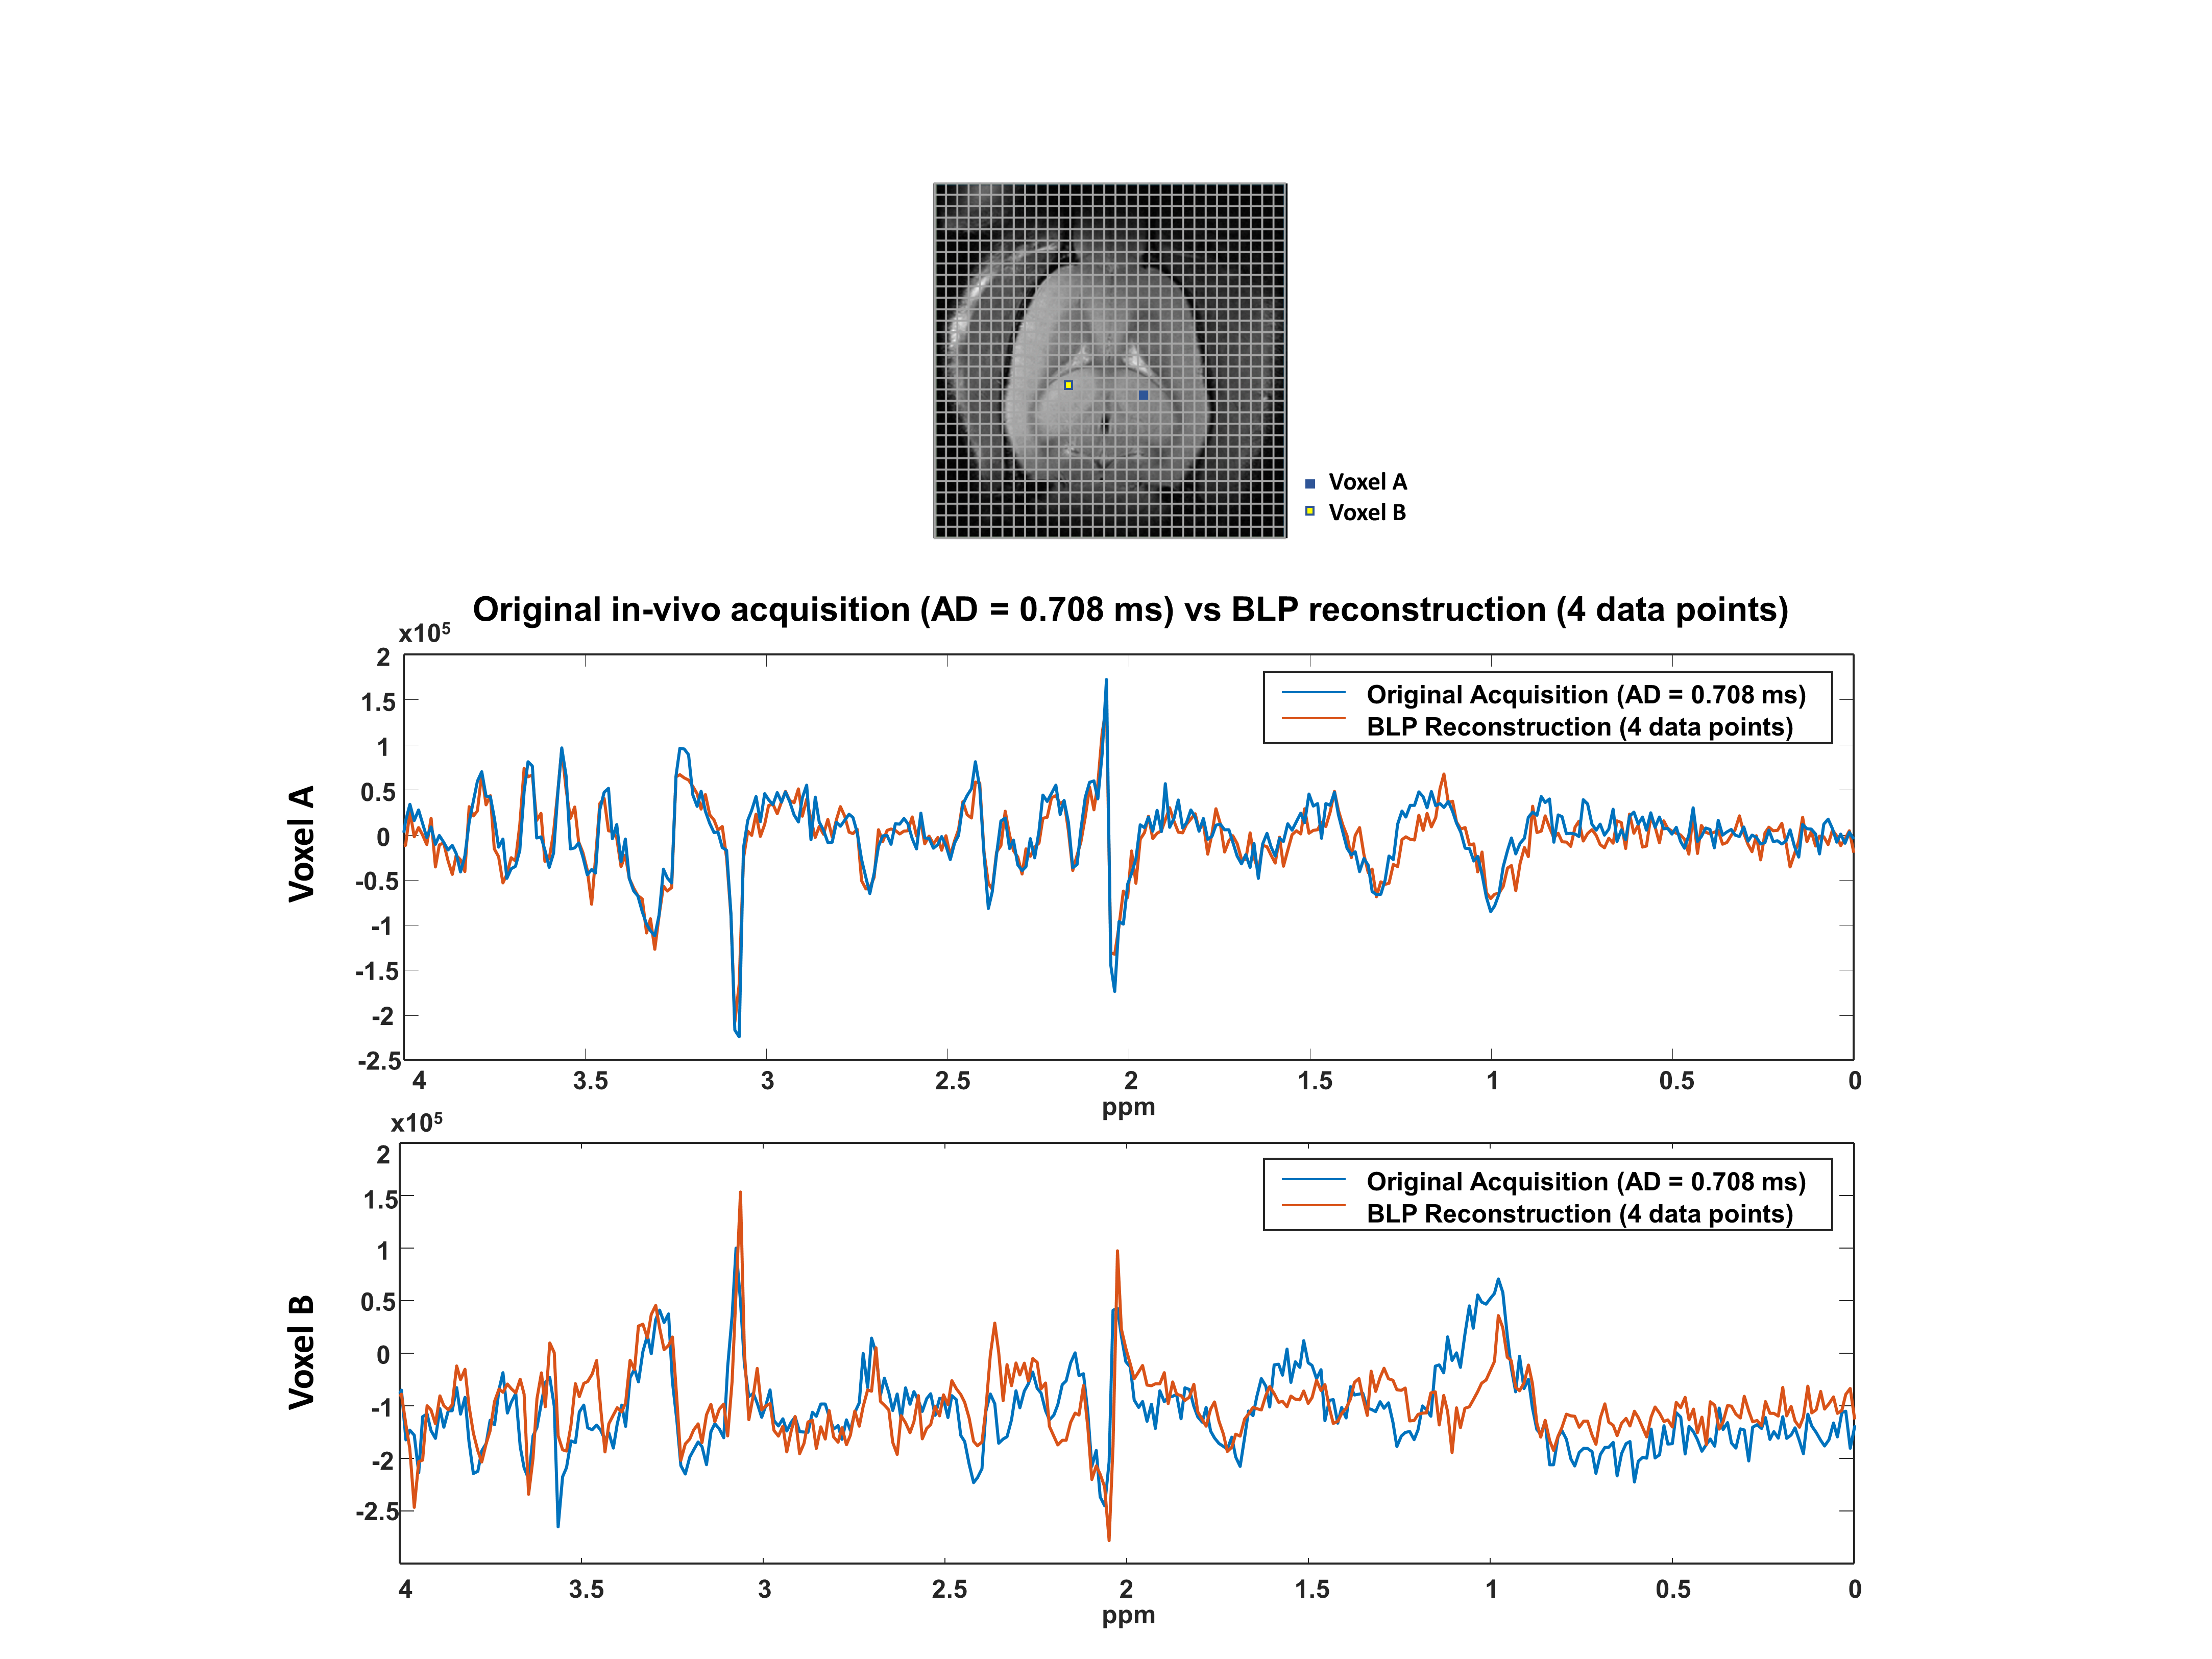
Figure 2: 2D 1H-FID-MRSI acquisition on a rat brain. The spectral plots show for the voxel A and B randomly chosen in the hippocampus region, the spectral comparison between the acquired (AD = 0.708 ms) and the BLP reconstructed (AD = 0.708 ms cut to 1.3 ms and back-calculated with BLP to AD = 0.708 ms).
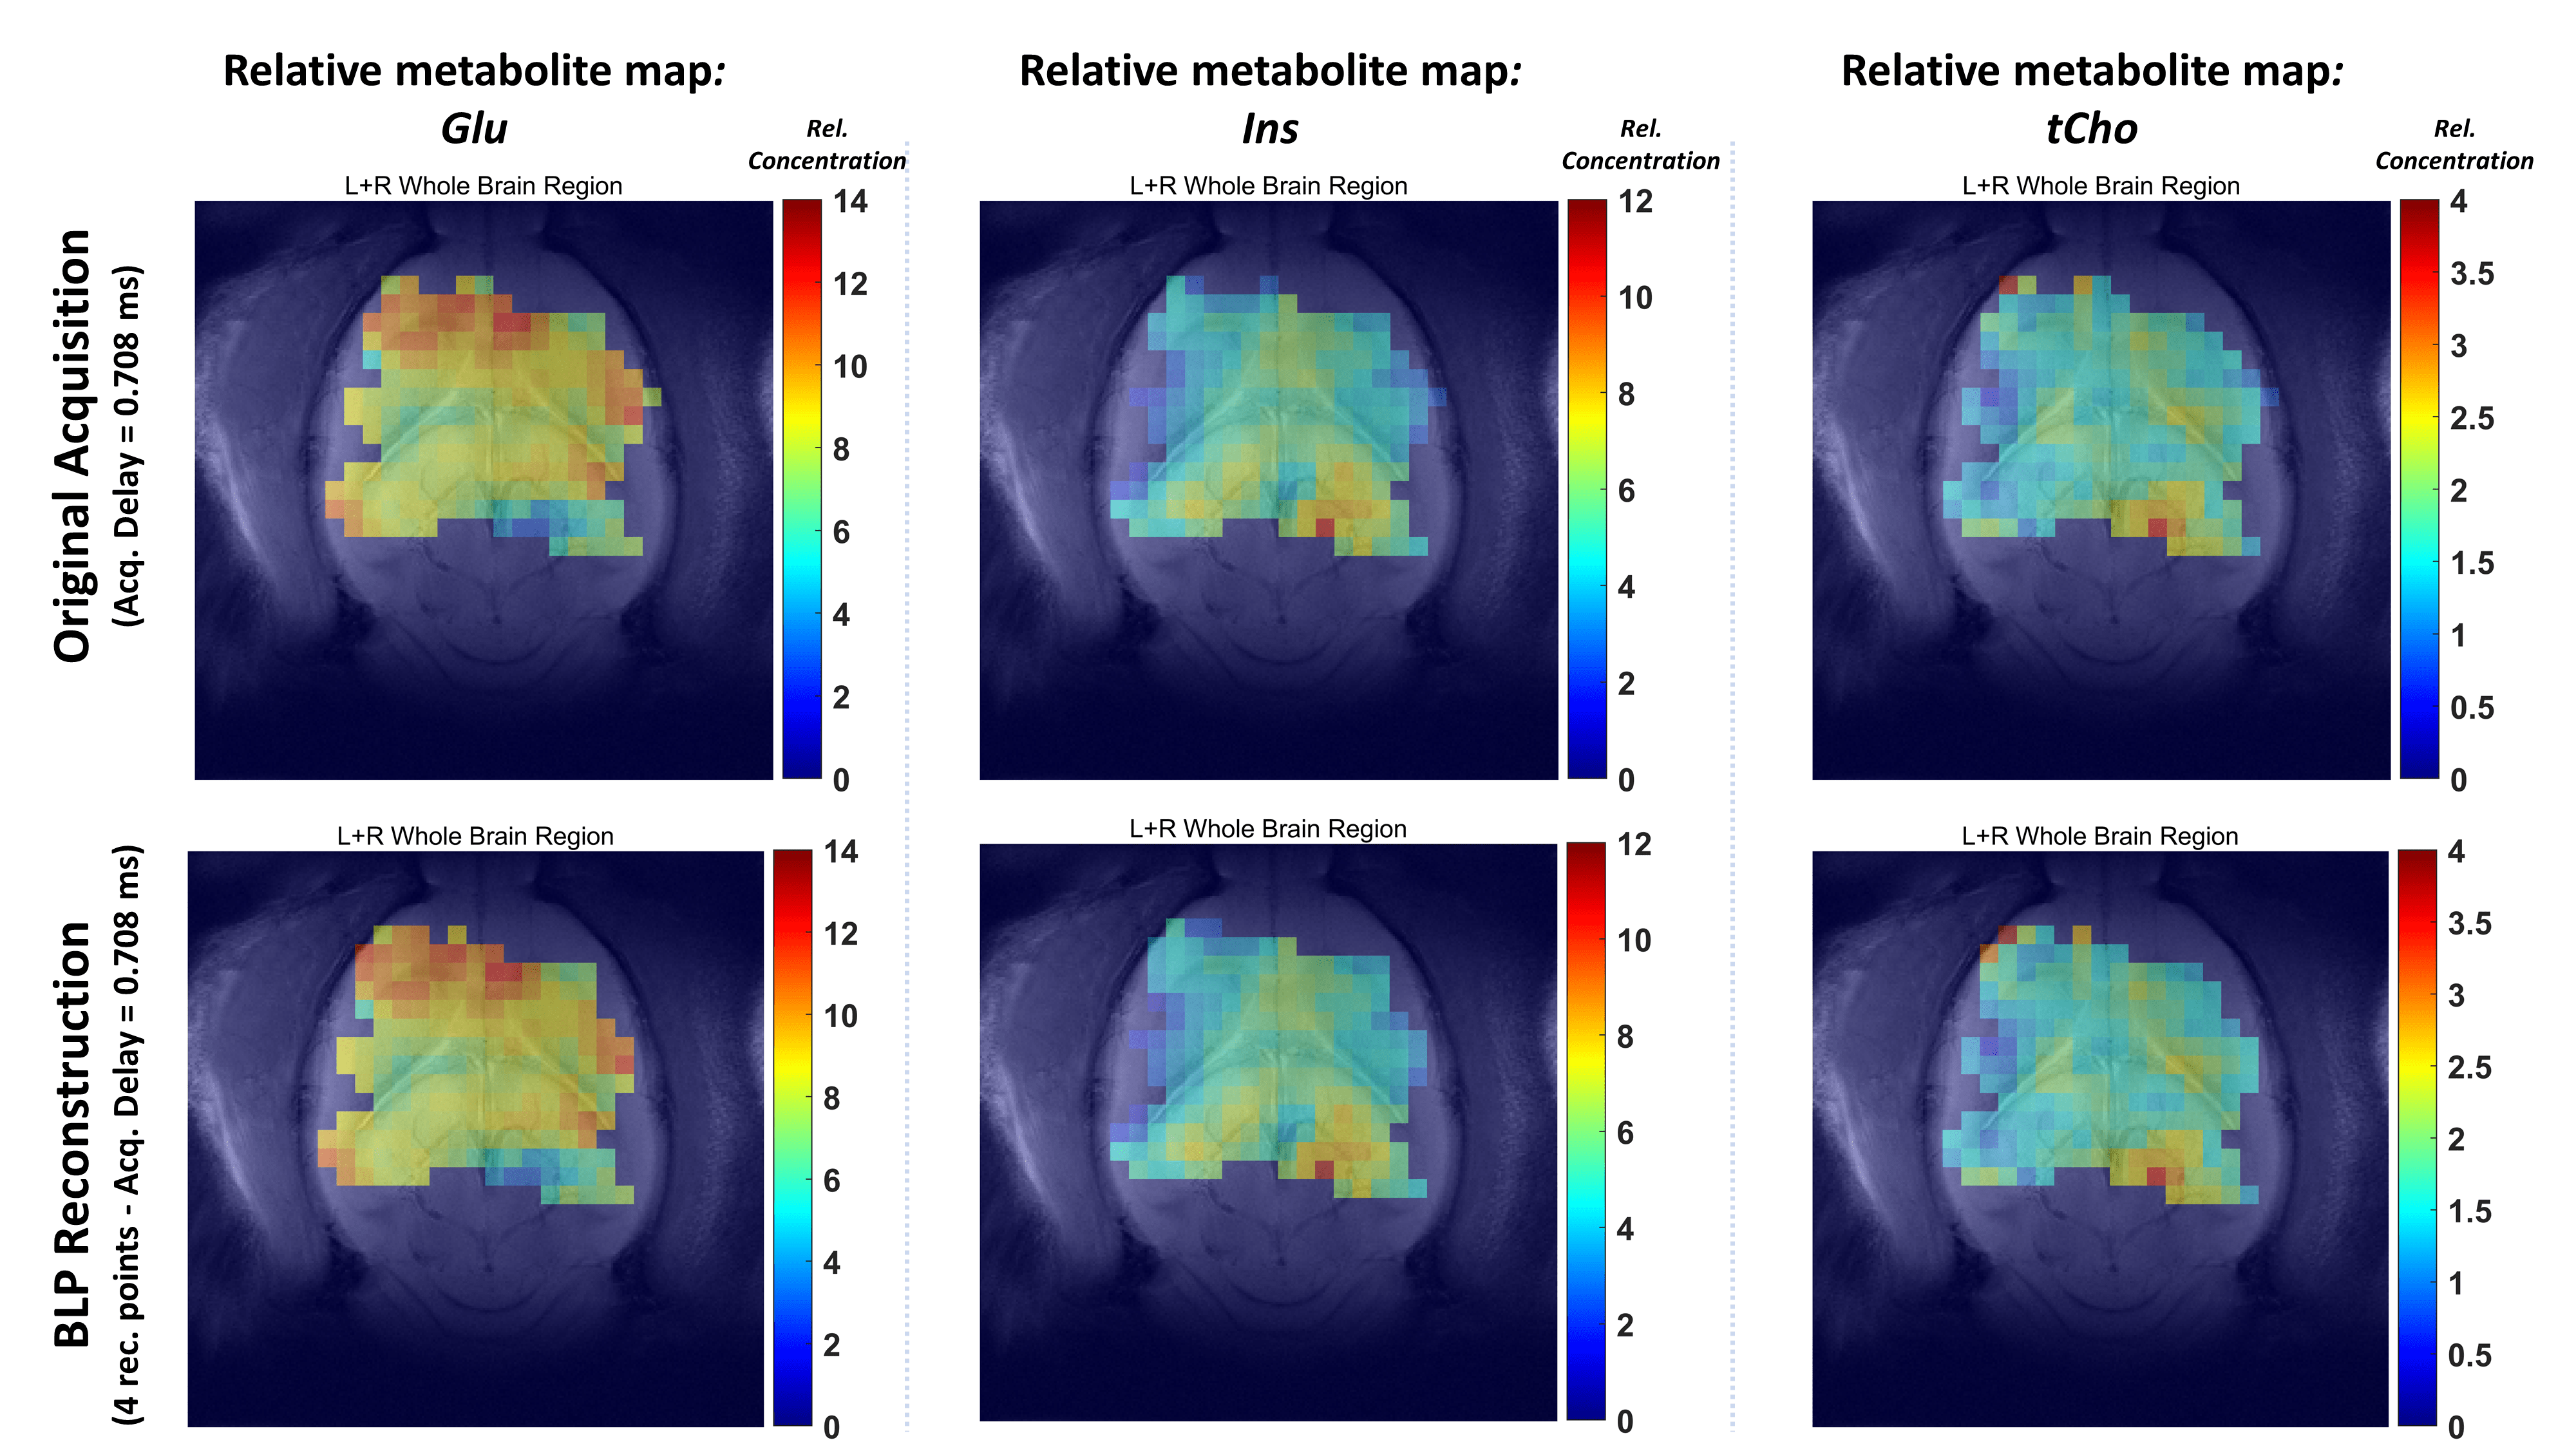
Figure 3: In vivo 2D 1H-FID-MRSI concentration maps: a comparison between the acquired in vivo acquisition (AD = 0.708 ms) and the BLP reconstructed data (AD = 0.708 ms cut to 1.3 ms and back-calculated with BLP to AD = 0.708 ms, 4 points) for 3 metabolites of interest, glutamate (Glu), inositol (Ins) and total choline (tCho). BLP reconstructed metabolite maps show a high fidelity to the reference uncut data (AD = 0.708 ms).
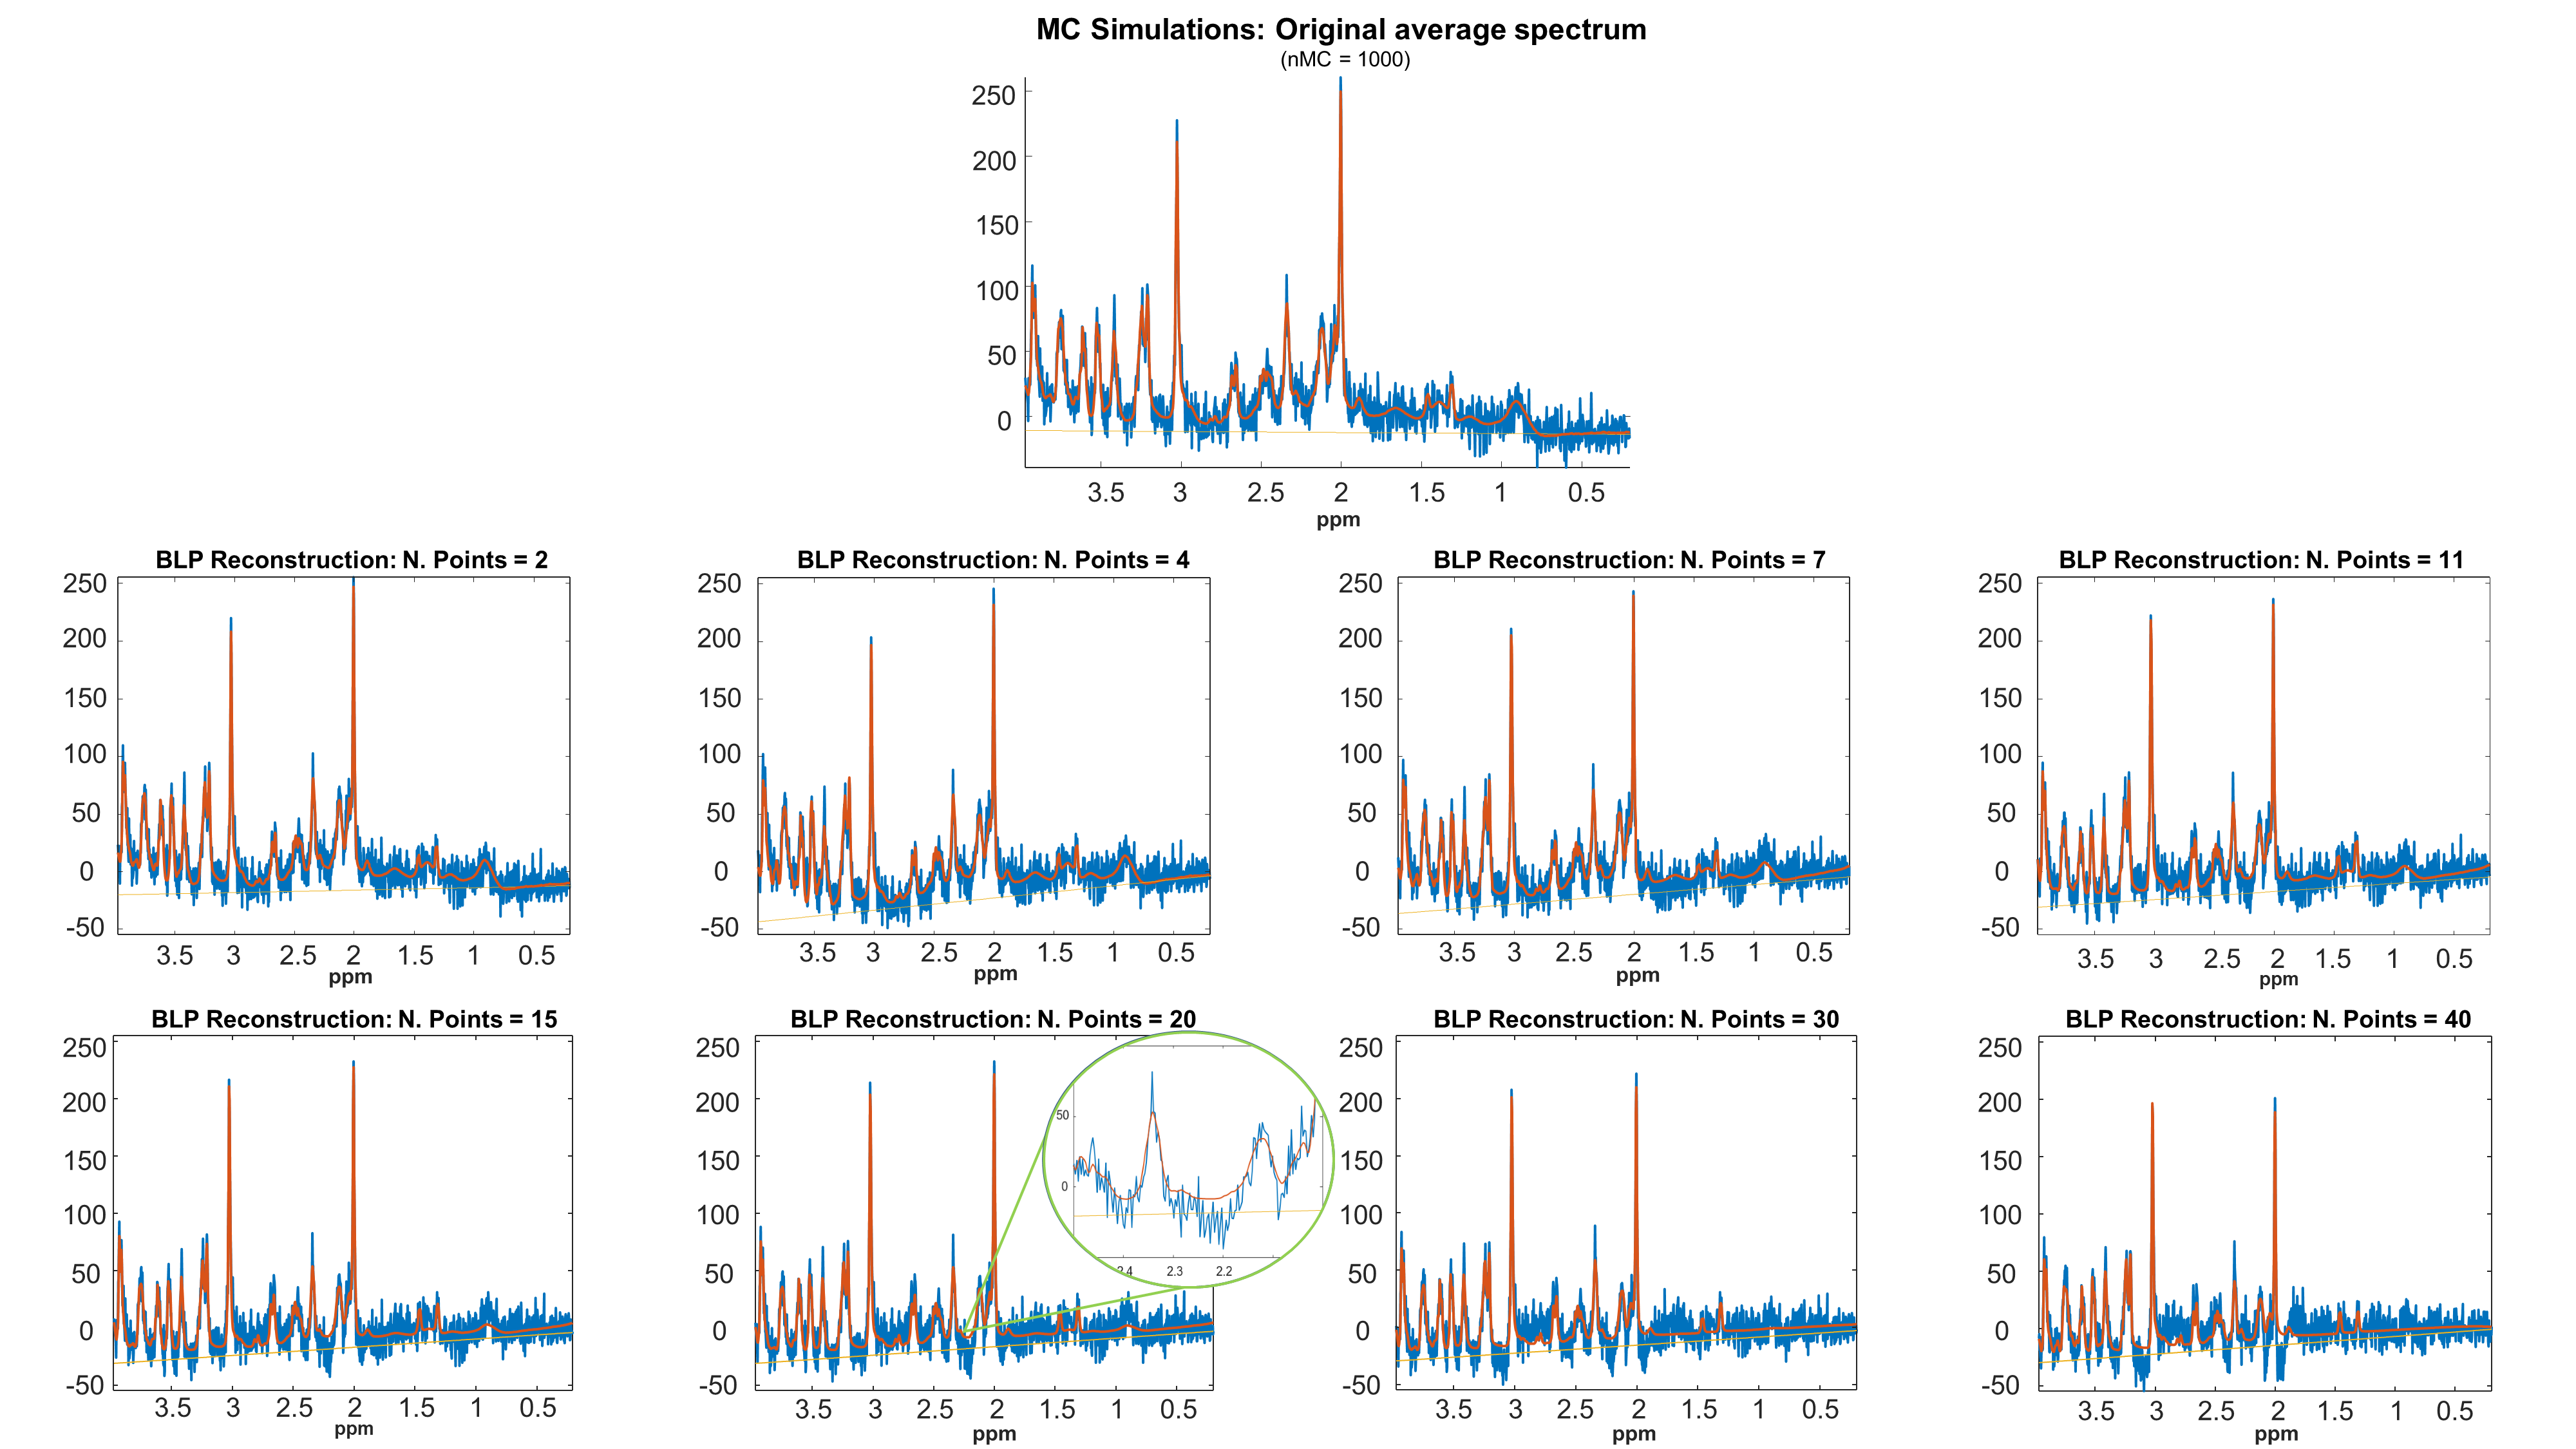
Figure 4: Examples of simulated spectra (blue) and their LC Model fitting (orange) obtained from the Monte-Carlo simulations. A reference spectrum is first simulated for AD = 0 ms with typical concentrations and noise level6. It is then cut for a certain number of points (2 to 40, thus from 0.14 ms to 5.5 ms), back-reconstructed with the BLP algorithm to AD = 0 ms and quantified with LC Model. As the number of cut points rises, an increasing mismatch between data and fitting function is visible in the range of 20 – 40 points, while it is less significant in the range of 2 – 15 points.
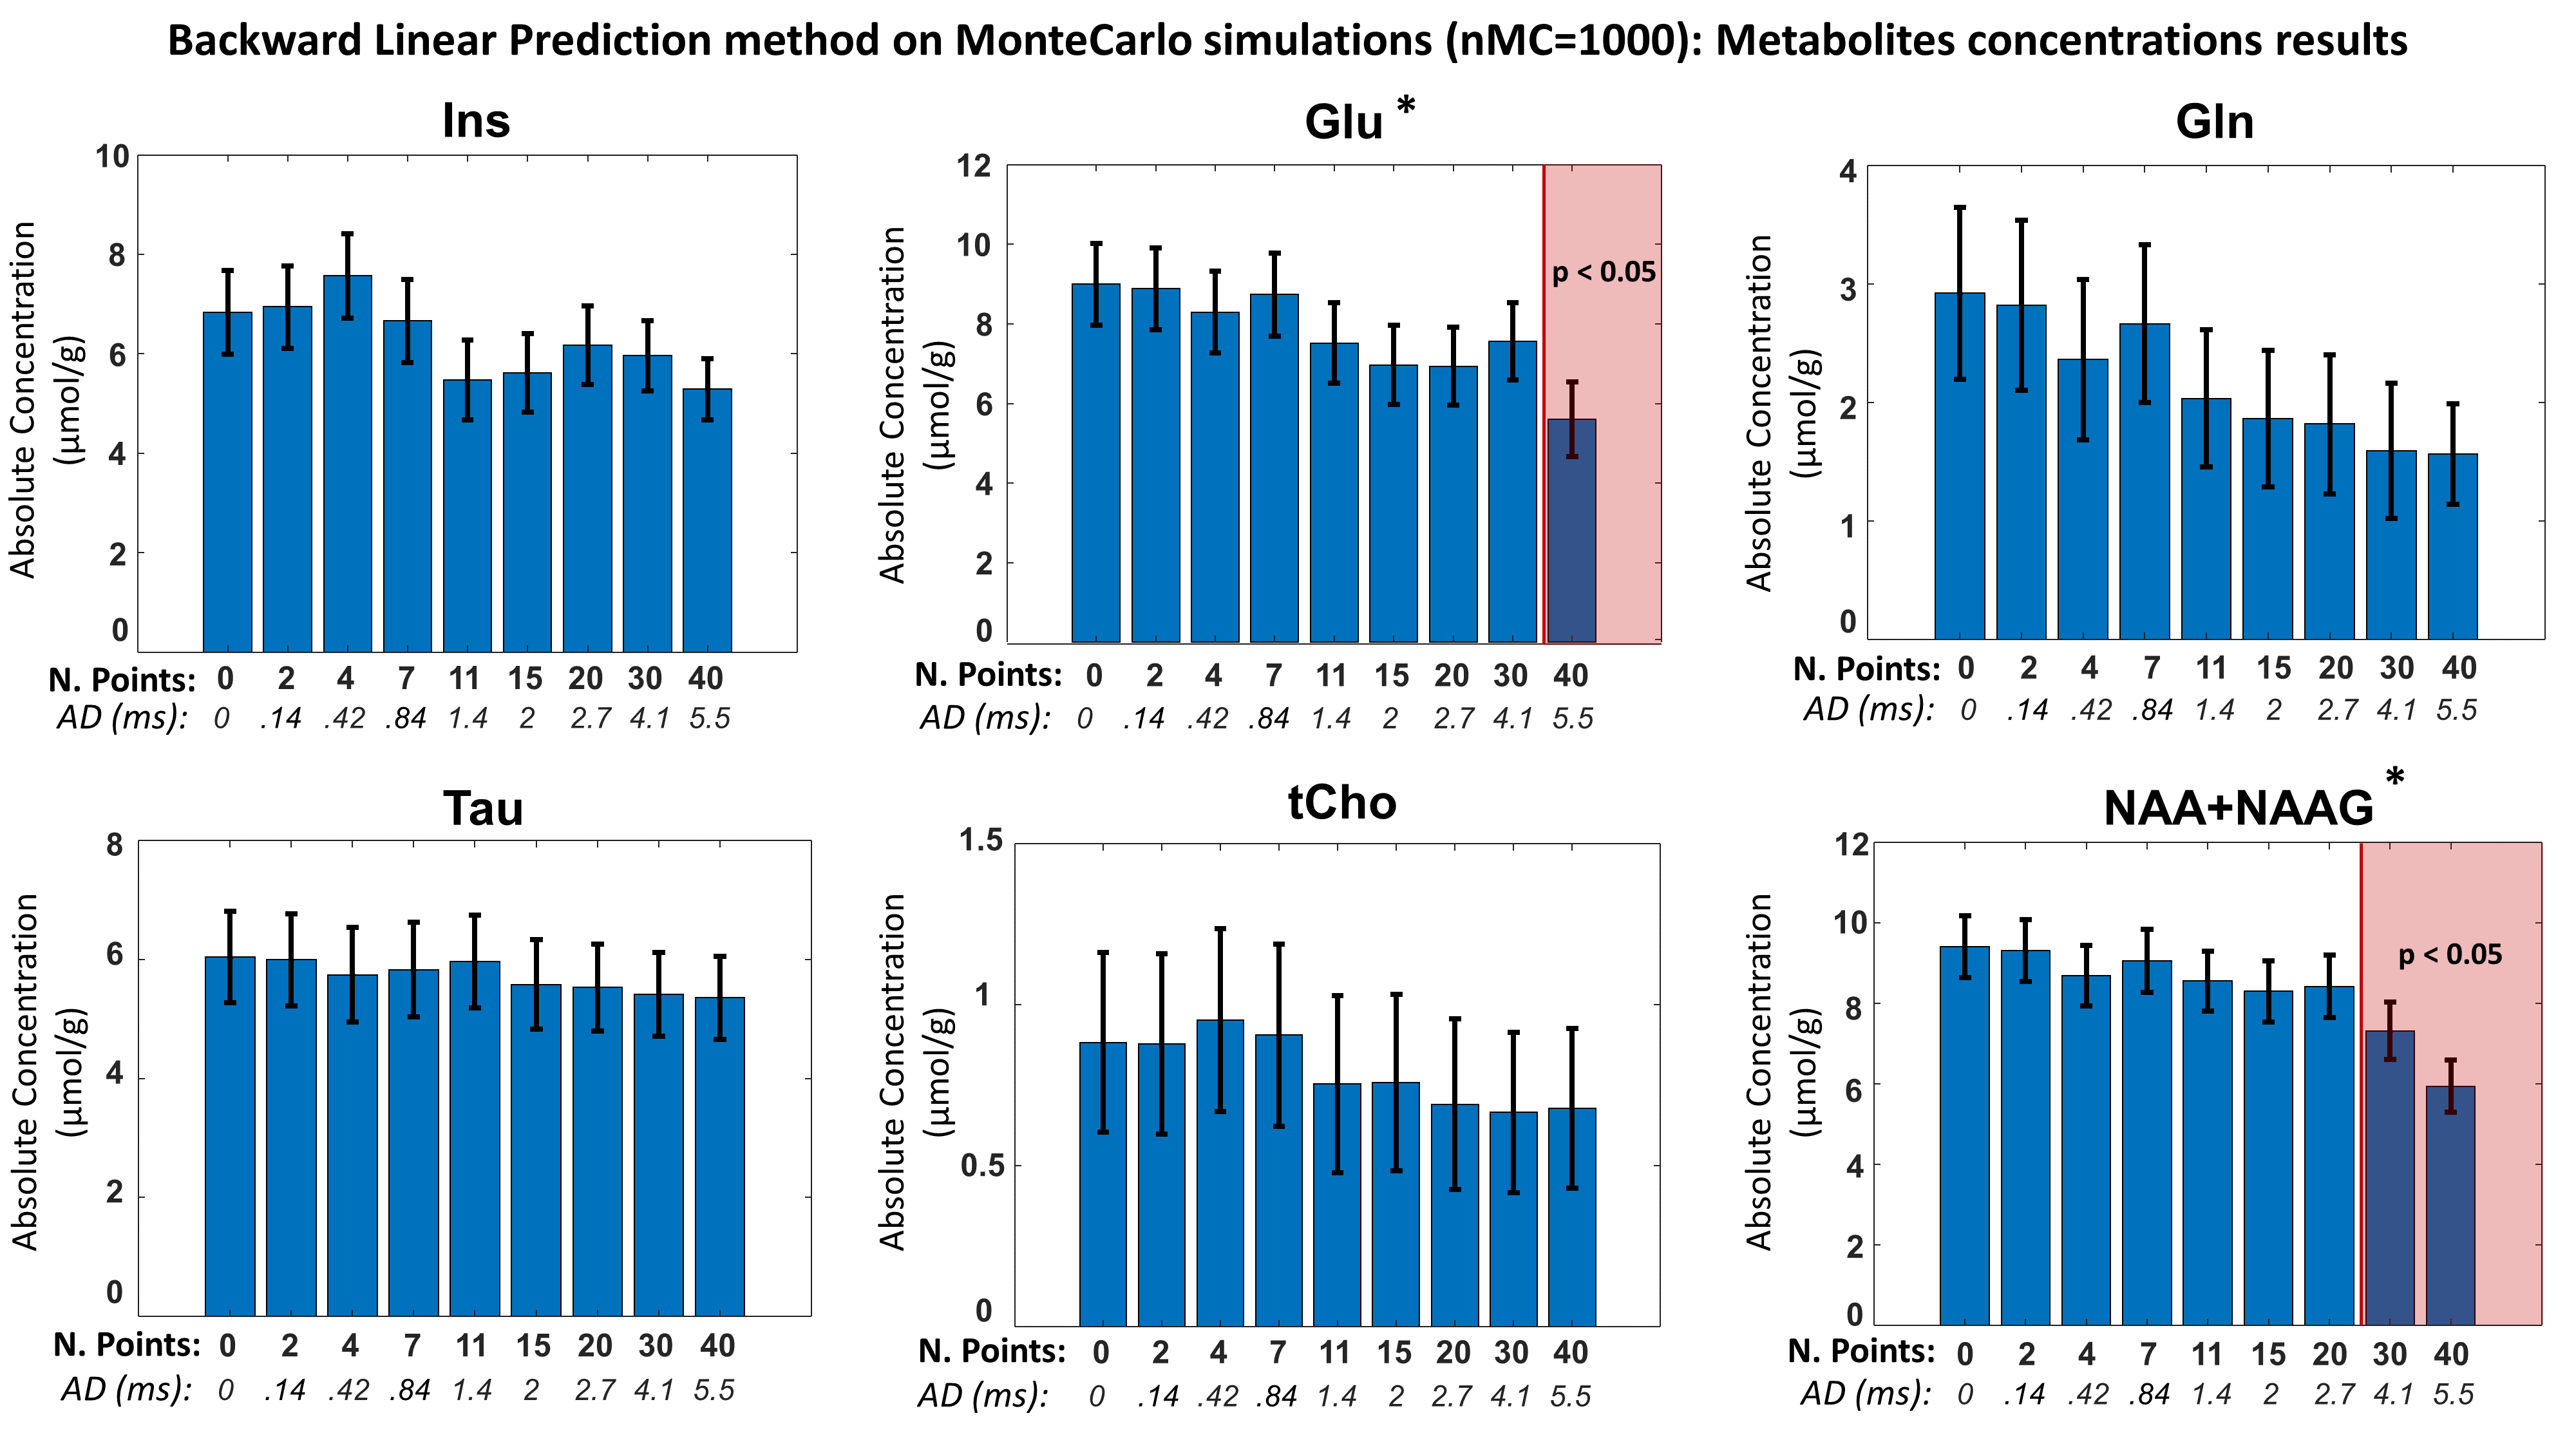
Figure 5: Monte-Carlo simulation results of the effect of BLP FID points recovery to a reference data with AD = 0 ms on metabolites quantification. The bar plots show mean and standard deviation of the LC Model quantification over 1000 MC simulations for increasing numbers of cut-and-recover points corresponding to AD of (0.14, 0.42, 0.84, 1.4, 2, 2.7, 4.1, 5.5 ms ) for inositol (Ins), glutamate (Glu), glutamine (Gln), taurine (Tau), total choline (tCho), total N-acetylaspartate (NAA+NAAG). (*) Metabolites whose resulting p-value is lower than 0.05 from a certain number of cut points.