1835
Reliability and Reproducibility of Neurochemical Profiles Obtained with sLASER and STEAM at 3T and 7T in Lower and Upper Limb Regions1Centre for Advanced Imaging, The University of Queensland, Brisbane, Australia, 2ARC Training Centre for Innovation in Biomedical Imaging Technology (CIBIT), The University of Queensland, Brisbane, Australia, 3School of Electrical Engineering and Computer Science, The University of Queensland, Brisbane, Australia, 4Centre for Magnetic Resonance Research, Department of Radiology, University of Minnesota, Minneapolis, MN, United States, 5High-field MR Centre, Department of Biomedical Imaging and Image-guided Therapy, Medical University of Vienna, Vienna, Austria
Synopsis
Keywords: Spectroscopy, Spectroscopy, sLASER, STEAM, 3T and 7T, Longitudinal Reproducibility, High-Field MRI, Ultrahigh-Field MRI, Magnetic Resonance Spectroscopy
Motivation: The test-retest of STEAM and sLASER at both fields using the same subjects has not been investigated.
Goal(s): The aim was to evaluate the reliability using Intraclass Correlation Coefficients(ICC) and reproducibility using Coefficient of Variations (CV%) of Glutamate, Glutamine, and N-acetyl-aspartate quantification at 3T and 7T in the human motor cortex using sLASER and STEAM sequences.
Approach: Subjects were scanned a week apart using both sequences at both field strengths. Voxel locations were in Paracentral Lobule (PCL) and Precentral Gyrus (PrCG).
Results: sLASER, particularly at 7T, demonstrated superior performance in both regions within a reasonable timeframe,making it the recommended sequence for longitudinal studies.
Impact: This study’s findings offer valuable insights for researchers conducting longitudinal studies using MRS. The improved reliability and reproducibility of the sLASER technique, particularly at 7T, enable more precise tracking of disease progression, potentially leading to improved disease tracking.
Introduction
Magnetic Resonance Spectroscopy (MRS) can be used as a non-invasive tool for studying brain metabolites in health and neurological diseases. Monitoring metabolite concentrations changes throughout the disease’s evolution can provide insights into disease progression. However, it is essential to use a reliable and reproducible MRS technique. This study evaluates the reliability, the consistency of a measure using Intraclass Correlation Coefficients (ICC), and reproducibility, the ability to repeat a study using Coefficient of Variations (CV%)[1],of Glutamate (Glu), Glutamine (Gln), Glu+Gln (Glx), and N-acetyl-aspartate (NAA) quantification at 3T and 7T in human motor cortex obtained with sLASER and STEAM sequences. ICC and CV have been used in previous studies to compare field strengths [2, 3], but have not examined data obtained with both sequences at two fields using same subjects scanned a week apart. This evaluation is vital for our broader project studying the progression of motor neuron disease(MND) over time. By ensuring our measurements are reliable (high ICC) and reproducible (low CV%), we can confidently attribute observed changes to the disease rather than measurement error.Method
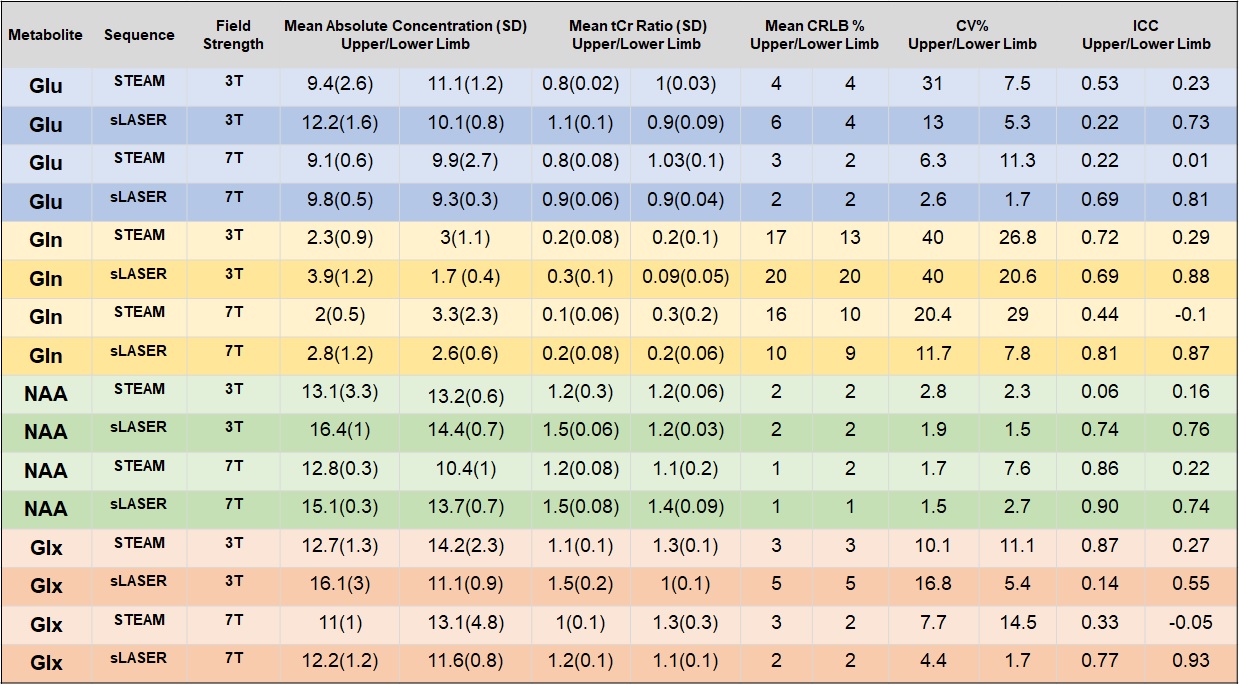
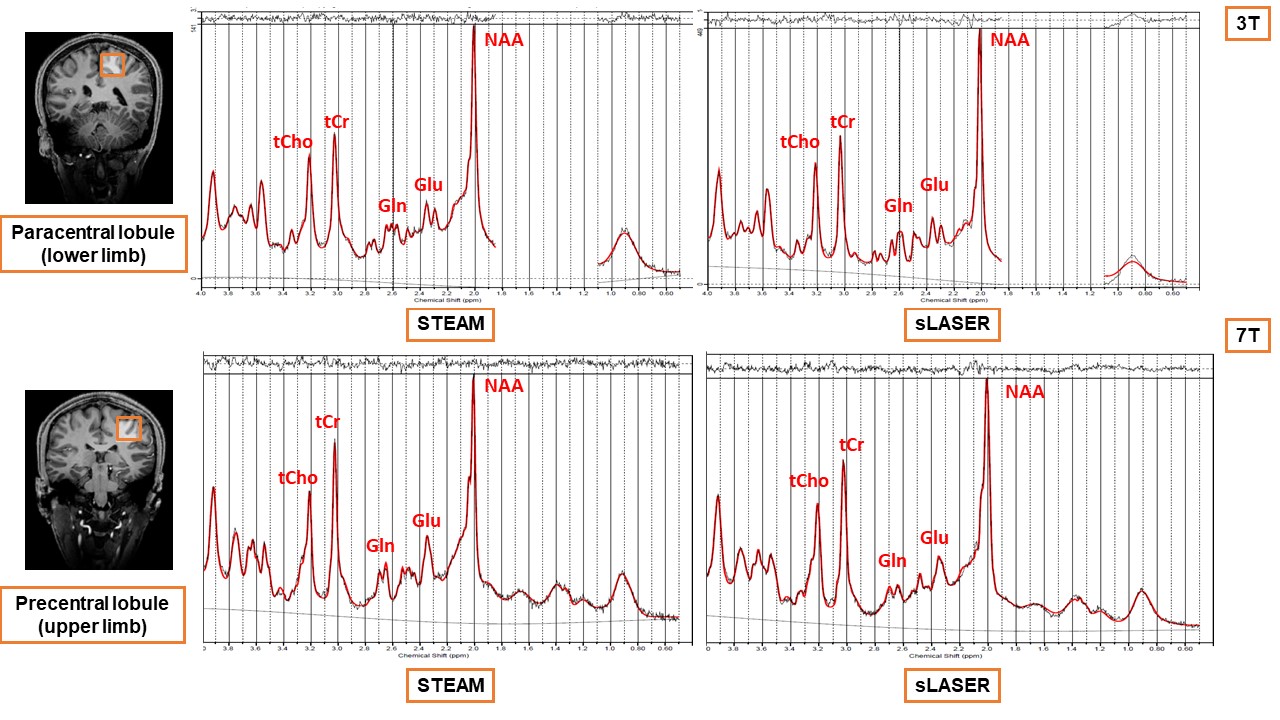
Two short TE sequences, STEAM (7T: TE=8ms, TR=8s, ave=16; 3T: TE=10ms, TR=2.5s, ave=64) and sLASER (7T: TE=26ms, TR=8s, ave=16; 3T: TE=28 ms, TR=2.5s, ave=64); total scan time 2.5 min at 3T and 2 mins at 7T, were used to acquire 1H-MRS metabolite and water spectra. Five healthy subjects (25-33 years, three female) were scanned twice 5-9 days apart at both 7T (Siemens MAGNETOM, 1Tx/32Rx head coil) and at 3T (Siemens Prisma, 64-channel coil). T1-weighted MP2RAGE was used to position the voxels and for tissue segmentation. Two MRS voxels (2.5×2.5×2.5cm3) were placed within the precentral gyrus (PrCG; upper limb motor area) and paracentral lobule (PCL; lower limb motor area [Figure 1]). B0 shimming used FAST(EST)MAP. RF Tx-power and water-suppression flip-angle were optimized for each volume of interest[4]. Metabolite ratios to total creatine(tCr) and the absolute metabolite molal concentrations were calculated in MATLAB using the Osprey MRS analysis toolbox and LCModel for quantification[5] using 19 metabolites in the basis set[6, 7] with corrections for tissue fraction, T1, and T2 relaxation times[5, 8]. Both sessions were used to calculate the mean CRLBs and metabolite concentrations(Table 1). For 3T spectra a gap from 1.1 to 1.85ppm was used to account for potential lipid contamination. Intra-subject CV was calculated by dividing SDs by means between sessions. An inter-subject CV was then obtained by averaging intra-subjects CVs[9](Table 1). Test-retest ICC was calculated using a two-way random-effects model in R[9-11]. Fixed effects included voxel location, field strength, sequence, and metabolite concentrations. Subjects and sessions were random effects. ICC was computed as variance between subjects within a group divided by the sum of between-group and within-group variances[10](Table 1).Results
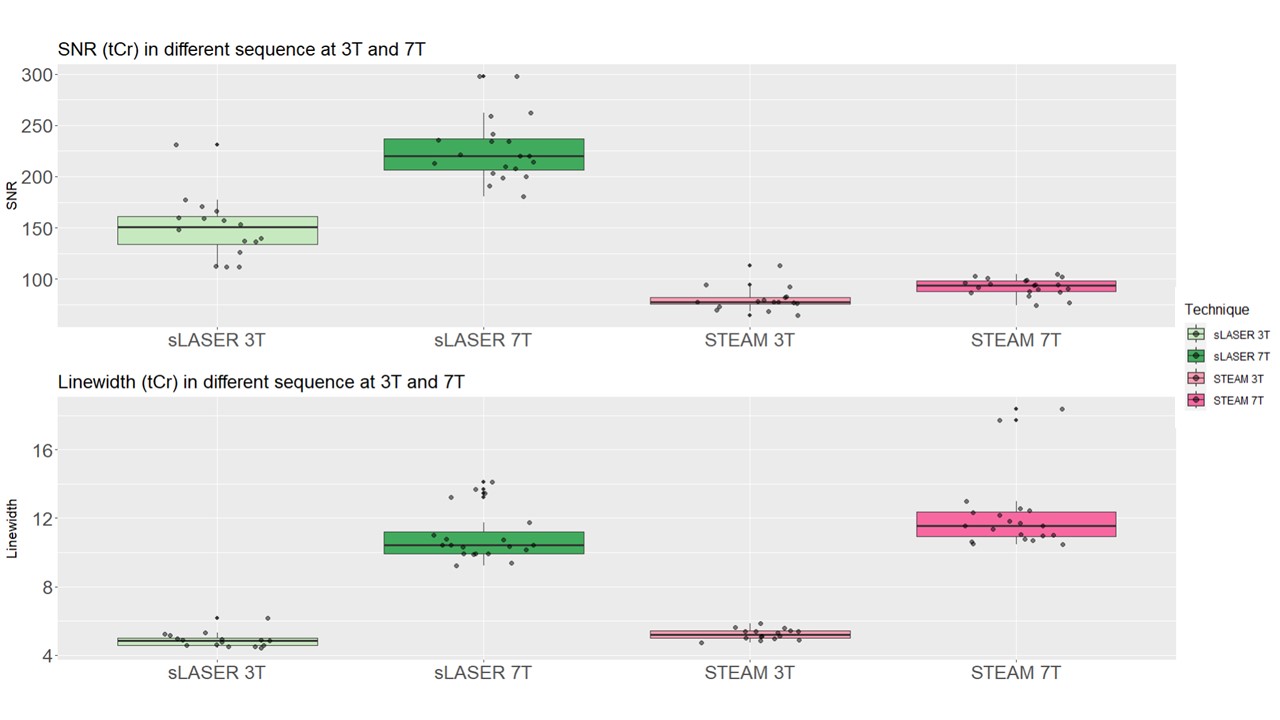
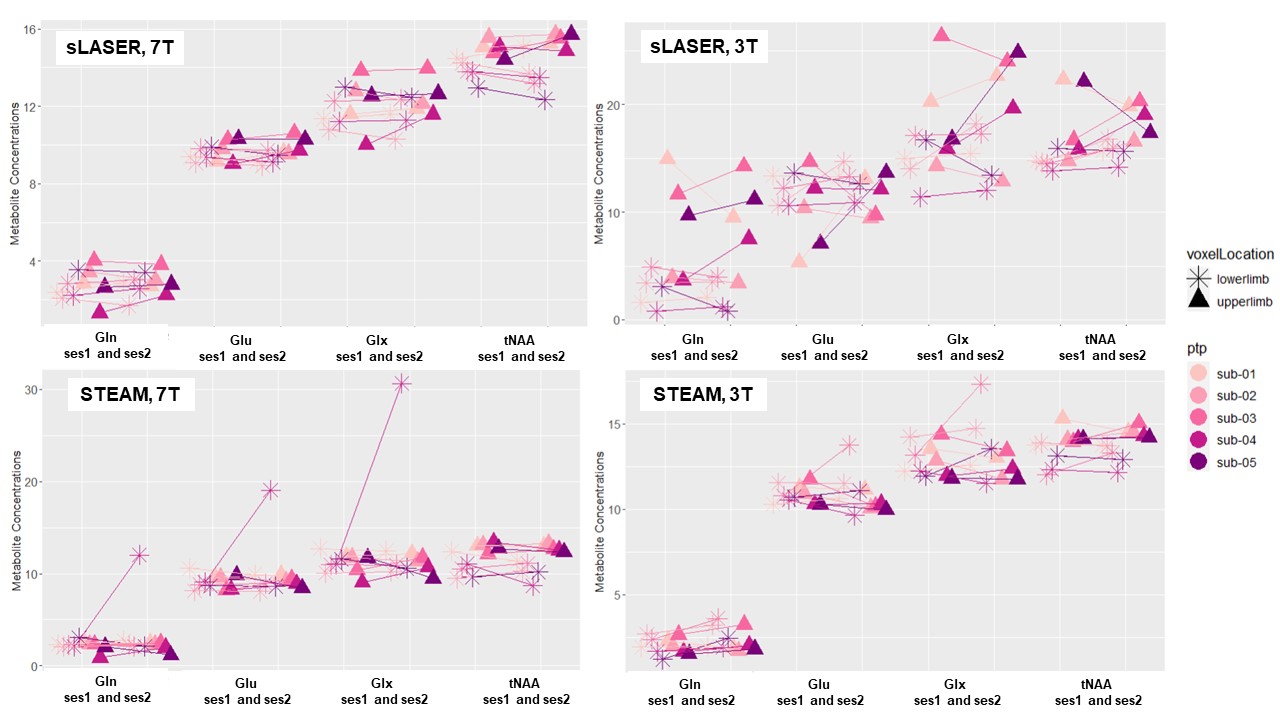
All 5 quantified metabolites had CRLB ≤20%. The linewidth of tCr was 2.4 times higher at 7T compared to 3T for both sequences.tCr SNR was 1.5 times higher at 7T for both sequences and 2.4 times higher when comparing sLASER to STEAM(Figure 2). sLASER showed better reliability and reproducibility (lower CV and higher ICC) than STEAM at 3T in PCL, while STEAM’s reproducibility was only higher in PrCG for Gln/tCr and Glx/tCr. At 7T, sLASER has a higher ICC and lower CV% than STEAM in both regions. The study also found lower CVs and a trend of higher ICCs at 7T for Glu and Gln in both regions(Table 1). A trend of higher NAA and Glx in PrCG and higher Glu in PCL was observed at both field strengths(Figure 3).Discussion
The study aimed to optimize parameters at each field strength for sufficient SNR within a reasonable timeframe. Despite using only 16 averages at 7T, high reproducibility was achieved. At 7T, sLASER was more reliable in both regions. We observed a slight bias in the estimation of metabolite concentration between STEAM and sLASER, which needs to be investigated further. Our findings are relevant for tracking the progression of neurodegenerative disorders like MND, for example, in examining the relationship between excitatory and inhibitory functions through disease progression. Despite the shorter scan time at 3T, we found that 3T may be sufficiently effective in the PCL for quantifying Glu and NAA (the CV% does not exceed 10%; Fig. 3).Conclusion
sLASER showed higher SNR as well as better reliability and reproducibility, in both PCL and PrCG regions in a reasonable acquisition time making it the sequence of choice for longitudinal studies. If available 7T is preferable due to higher SNR, but 3T shows excellent or good reliability for most metabolites.Acknowledgements
This research was conducted by the Australian Research Council Training Centre for Innovation in Biomedical Imaging Technology (project number IC170100035) and funded by the Australian Government. The authors acknowledge the facilities of the National Imaging Facility at the Centre for Advanced Imaging. We thank our research radiographers, Nicole Atcheson and Aiman Al-Najjar for assisting in the data collection. We thank Dr. Georg Oeltzschner for helping to set up the pipeline for postprocessing and MRS hub website. We are grateful to our participants for volunteering for this study. DKD and MM acknowledge support from the National Institutes of Health (NIH) grants BTRC P41 EB015894.References
[1] R. Kreis et al., "Terminology and concepts for the characterization of in vivo MR spectroscopy methods and MR spectra: Background and experts' consensus recommendations," NMR Biomed, p. e4347, Aug 17 2020, doi: 10.1002/nbm.4347.
[2] S. Pradhan et al., "Comparison of single voxel brain MRS AT 3 T and 7 T using 32-channel head coils," Magnetic resonance imaging, vol. 33, no. 8, pp. 1013-1018, 2015.
[3] M. Terpstra et al., "Test‐retest reproducibility of neurochemical profiles with short‐echo, single‐voxel MR spectroscopy at 3T and 7T," Magnetic resonance in medicine, vol. 76, no. 4, pp. 1083-1091, 2016.
[4] R. Gruetter, "Automatic, localized in vivo adjustment of all first‐and second‐order shim coils," Magnetic resonance in medicine, vol. 29, no. 6, pp. 804-811, 1993.
[5] G. Oeltzschner et al., "Osprey: Open-source processing, reconstruction & estimation of magnetic resonance spectroscopy data," Journal of neuroscience methods, vol. 343, p. 108827, 2020.
[6] D. K. Deelchand et al., "Across-vendor standardization of semi-LASER for single-voxel MRS at 3T," NMR Biomed, vol. 34, no. 5, p. e4218, May 2021, doi: 10.1002/nbm.4218.
[7] M. Marjanska et al., "Region-specific aging of the human brain as evidenced by neurochemical profiles measured noninvasively in the posterior cingulate cortex and the occipital lobe using (1)H magnetic resonance spectroscopy at 7 T," Neuroscience, vol. 354, pp. 168-177, Jun 23 2017, doi: 10.1016/j.neuroscience.2017.04.035.
[8] C. Gasparovic et al., "Use of tissue water as a concentration reference for proton spectroscopic imaging," Magnetic Resonance in Medicine: An Official Journal of the International Society for Magnetic Resonance in Medicine, vol. 55, no. 6, pp. 1219-1226, 2006.
[9] S. A. Wijtenburg, L. M. Rowland, G. Oeltzschner, P. B. Barker, C. I. Workman, and G. S. Smith, "Reproducibility of brain MRS in older healthy adults at 7T," NMR in Biomedicine, vol. 32, no. 2, p. e4040, 2019.
[10] P. E. Shrout and J. L. Fleiss, "Intraclass correlations: uses in assessing rater reliability," Psychological bulletin, vol. 86, no. 2, p. 420, 1979.
[11] A. Baeshen et al., "Test–retest reliability of the brain metabolites GABA and Glx with JPRESS, PRESS, and MEGA‐PRESS MRS sequences in vivo at 3T," Journal of Magnetic Resonance Imaging, vol. 51, no. 4, pp. 1181-1191, 2020.
[12] T. K. Koo and M. Y. Li, "A guideline of selecting and reporting intraclass correlation coefficients for reliability research," Journal of chiropractic medicine, vol. 15, no. 2, pp. 155-163, 2016.
Figures