1834
Metabolic biomarkers of IDH status in gliomas by in vivo Magnetic Resonance Spectroscopy1Paris Brain Institute - ICM, Inserm U 1127, CNRS UMR 7225, Sorbonne University, UMR S 1127, Paris, France, 2The Ottawa Hospital, Ottawa, ON, Canada, 3Data Analysis Core, Paris Brain Institute, Paris, France, 4Center for Magnetic Resonance Research, Department of Radiology, University of Minnesota, Minneapolis, MN, United States
Synopsis
Keywords: Spectroscopy, Spectroscopy, Glioma, IDH mutation, brain metabolites, ROC analysis, diagnosis
Motivation: Reliable noninvasive quantification of D-2-hydroxyglutarate (2HG) for diagnosis of isocitrate dehydrogenase (IDH)-mutant gliomas is challenging.
Goal(s): To discriminate between IDH-mutant and wild-type gliomas based on their full metabolic profile.
Approach: Partial Least Squares Discriminant Analysis (PLS-DA) was used to discriminate IDH-mutants from wild-types using in vivo 3T MRS data from 47 patients with a newly diagnosed glioma.
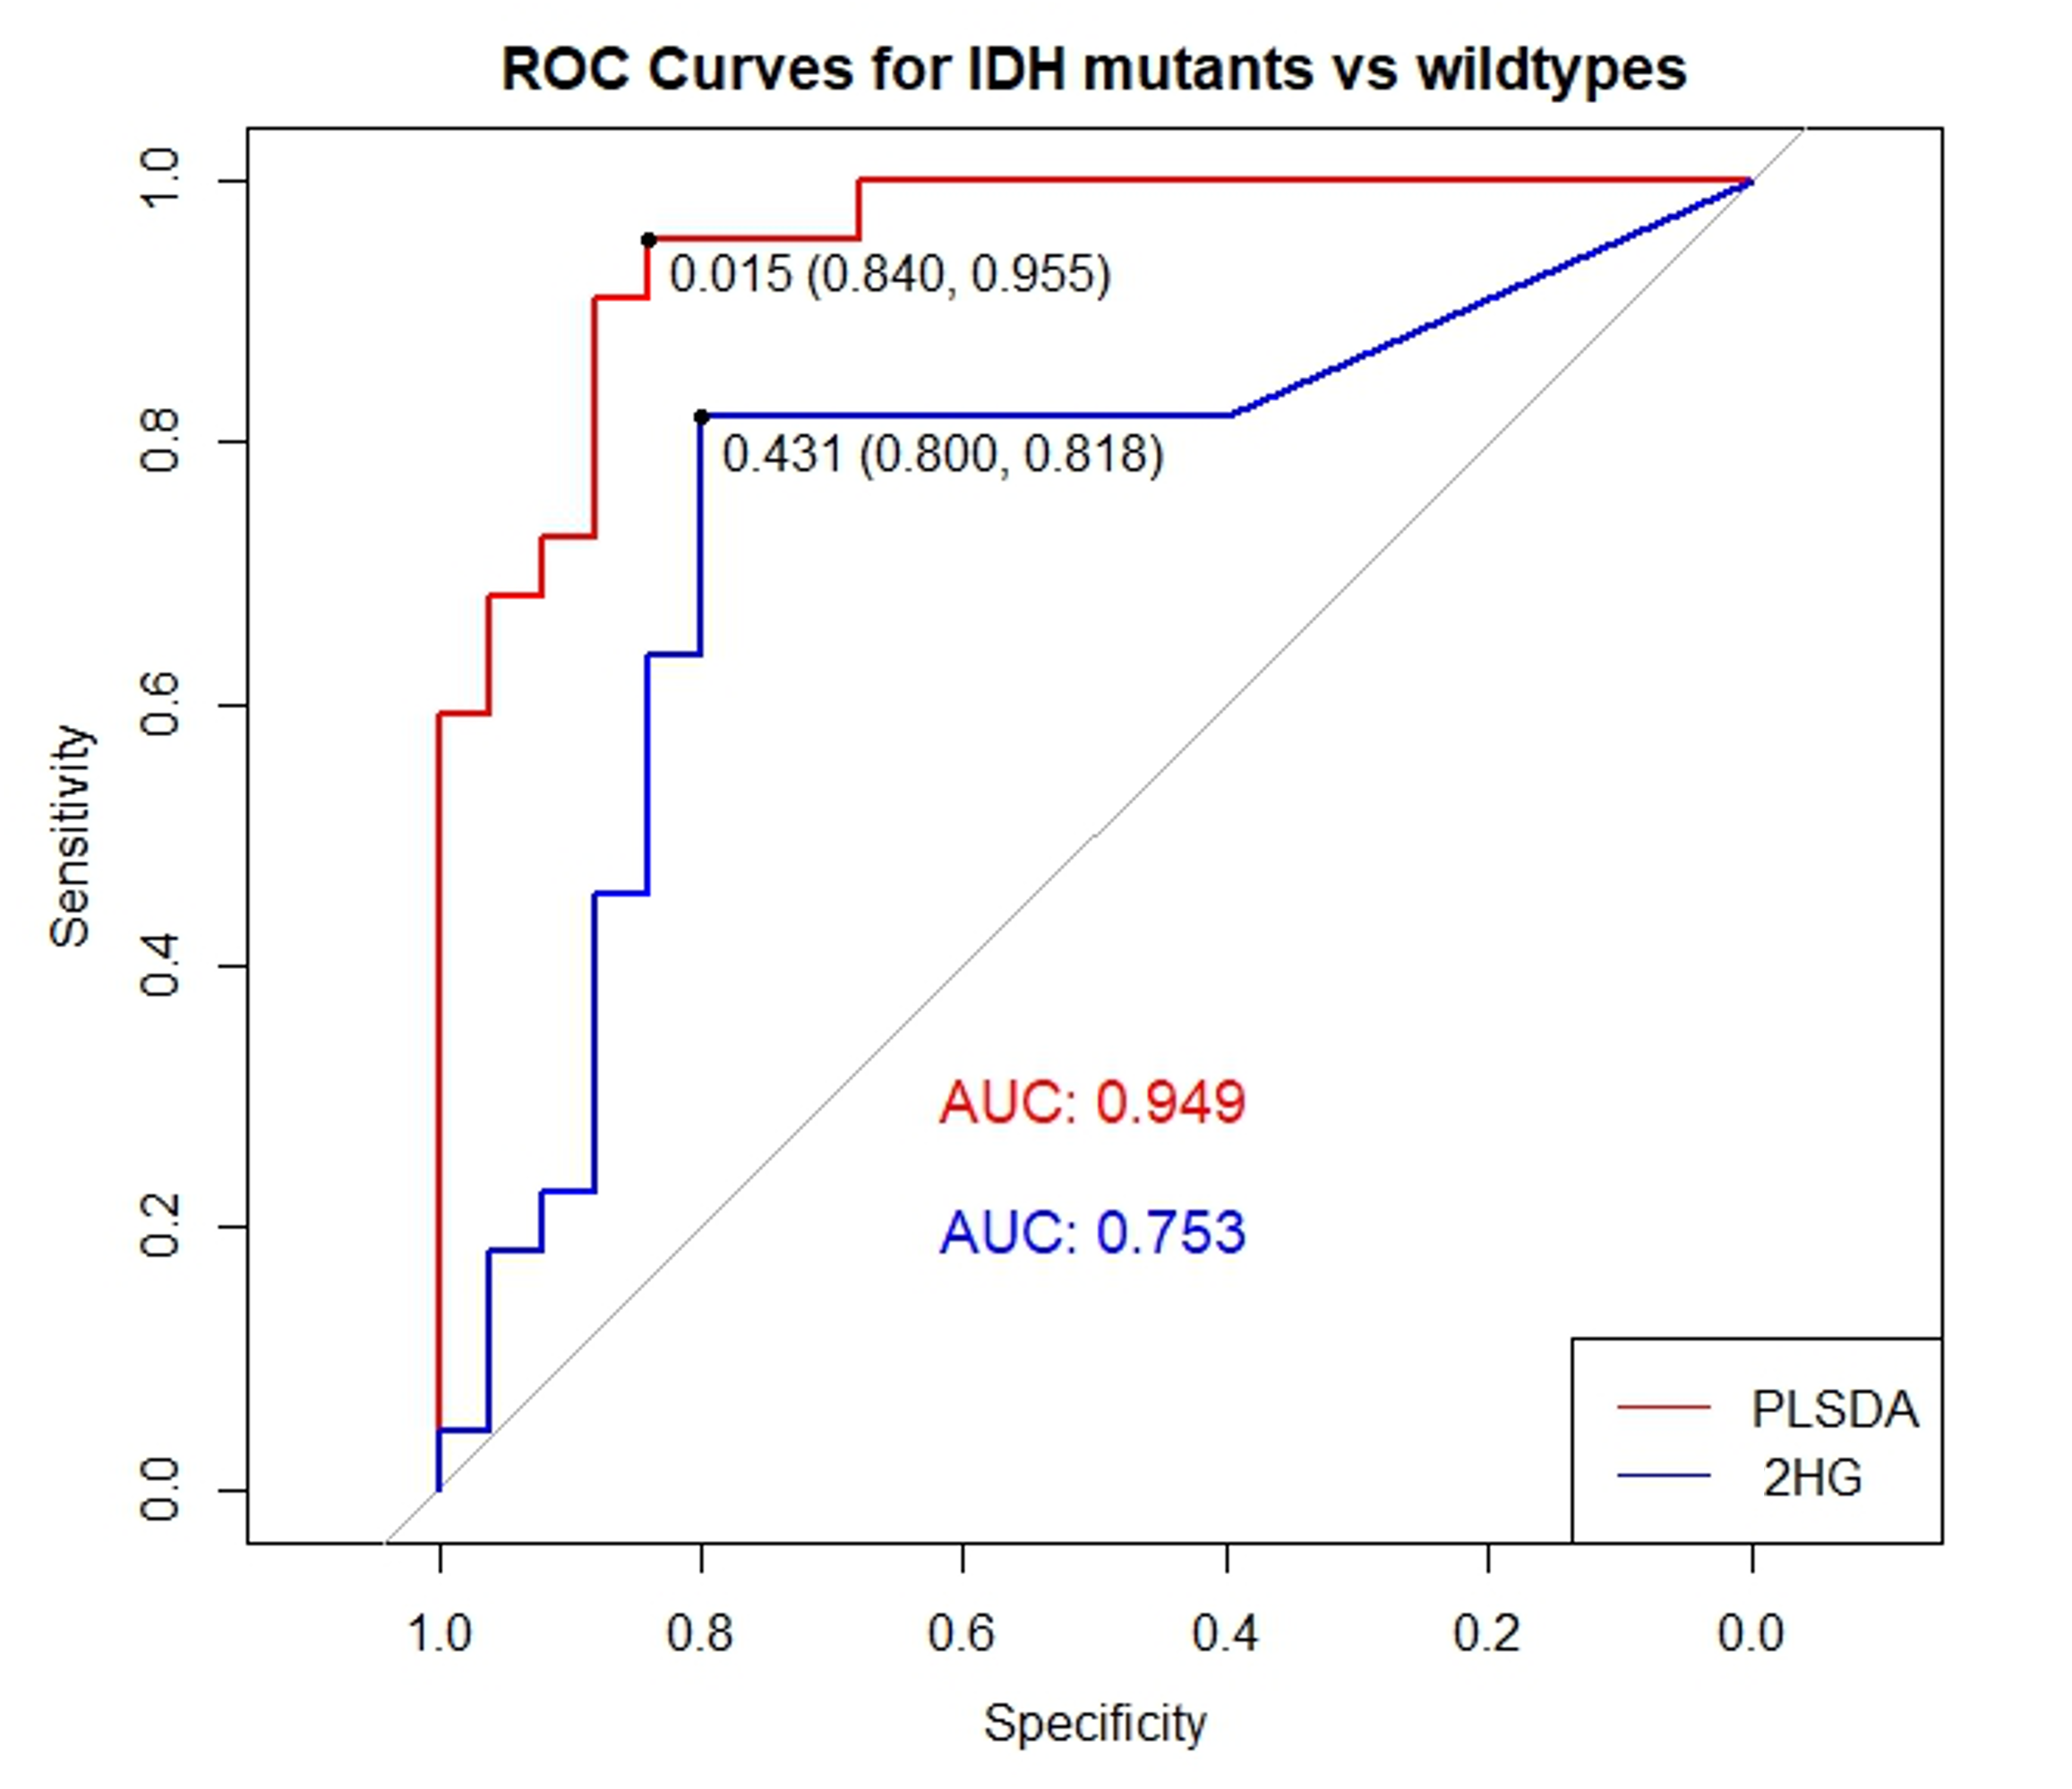
Results: Higher 2HG and lower glutamate + glutamine, glutamate, glycine, and glutathione were observed in IDH-mutants compared to wild-types. The PLS-DA model showed higher accuracy (AUC = 0.949) compared to 2HG alone (AUC = 0.753), underscoring the superiority of a comprehensive approach over single metabolite analysis.
Impact: Exploring in vivo metabolic alterations beyond D-2-hydroxyglutarate is crucial for enhancing diagnostic accuracy in detection of IDH mutations in patients with gliomas, as well as for a deeper understanding of the fundamental biological consequences of this mutation.
INTRODUCTION
Gliomas, the most common primary brain tumors, are classified based on molecular markers, notably isocitrate dehydrogenase (IDH) mutations. Although these mutations lead to the production of the well-known oncometabolite D-2-hydroxyglutarate (2HG)1,2,3, its detection in clinical settings remains limited. The search for other noninvasive metabolic biomarkers in gliomas is crucial to understand the biological consequences of IDH mutations beyond 2HG accumulation, as well as for developing robust strategies for glioma subtyping that can be used in the clinic. This study aims to quantify metabolic differences between IDH-mutant and wild-type gliomas by in vivo MRS at 3T and to explore the utility of advanced statistical modeling to effectively separate these two groups based on their full metabolic profiles.METHODS
Fifty-five patients were included in the study and examined before surgery. Histopathological diagnosis and molecular status were obtained from biopsied or resected tumor tissues according to the 2016 WHO criteria. Edited MRS data were acquired using a 3T scanner (Siemens Healthineers) equipped with a 32-channel receive-only head coil. A single-voxel MEGA-PRESS4 pulse sequence with automatic shimming and CHESS water suppression was used for MRS data acquisition (repetition time/echo time = 2000/60 ms, 64 or 128 pairs of edit-on and edit-off transients). Voxel size was adapted to tumor size and chosen to be bigger than 3 cm3 for adequate SNR. Both edit-off and difference spectra were fitted using LCModel5 and a simulated basis set. The concentrations of metabolites derived from edit-off spectra were scaled by the total choline (tCho) concentration. Spectra quality control was based on tCho linewidth (<13 Hz).STATISTICAL ANALYSIS
Univariate analysis was performed using Mann-Whitney U tests on each metabolite and a Bonferroni-Holm correction to evaluate metabolic differences between wild-type and IDH-mutant gliomas. We then performed a dimensionality reduction with Principal Component Analysis (PCA) analysis. The significant metabolites were retained in a multivariate analysis using Partial Least Squares Discriminant Analysis (PLS-DA) to optimize group separation and rank key metabolites. Finally, the discriminatory power of both the top single metabolite and the multivariate signature derived from the PLS-DA model (1st component) were assessed using AUC values. Statistical significance was determined with a Bonferroni-Holm corrected threshold of p<0.05.RESULTS
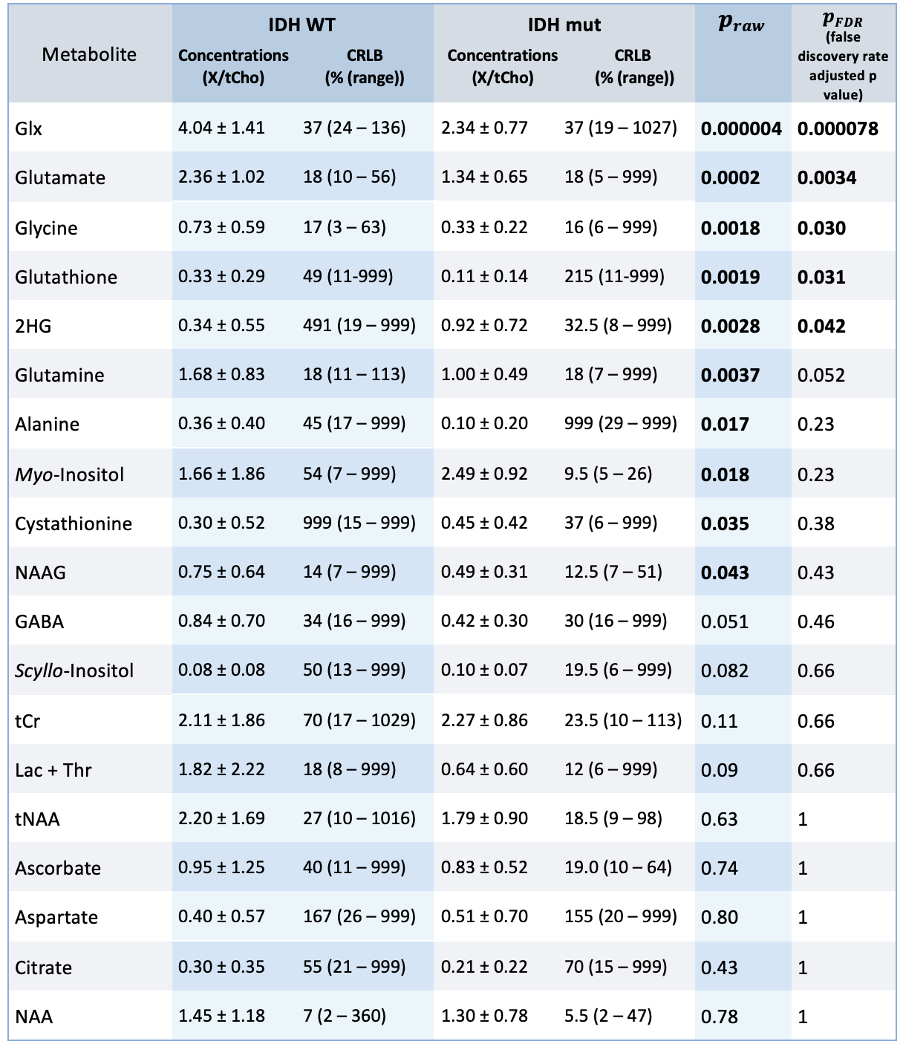
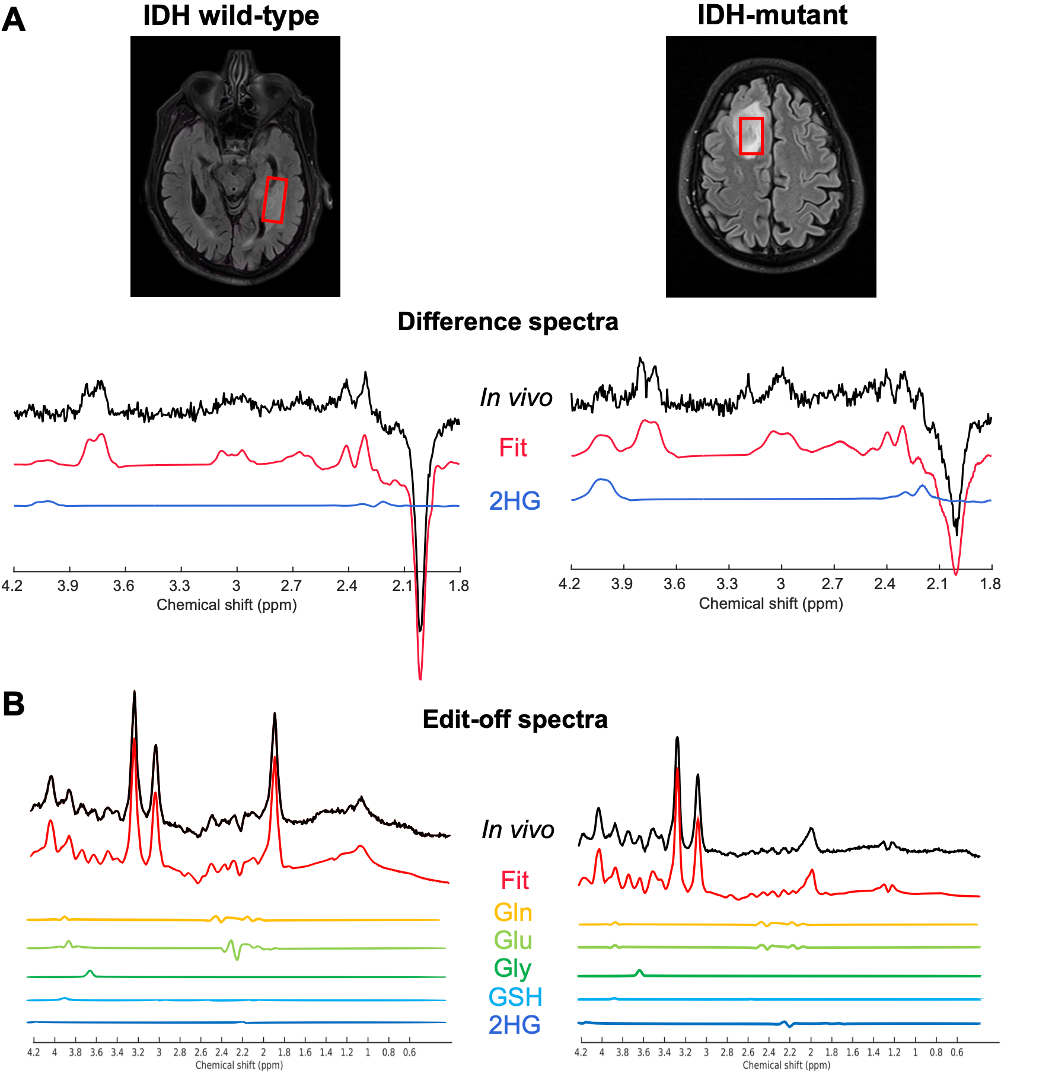
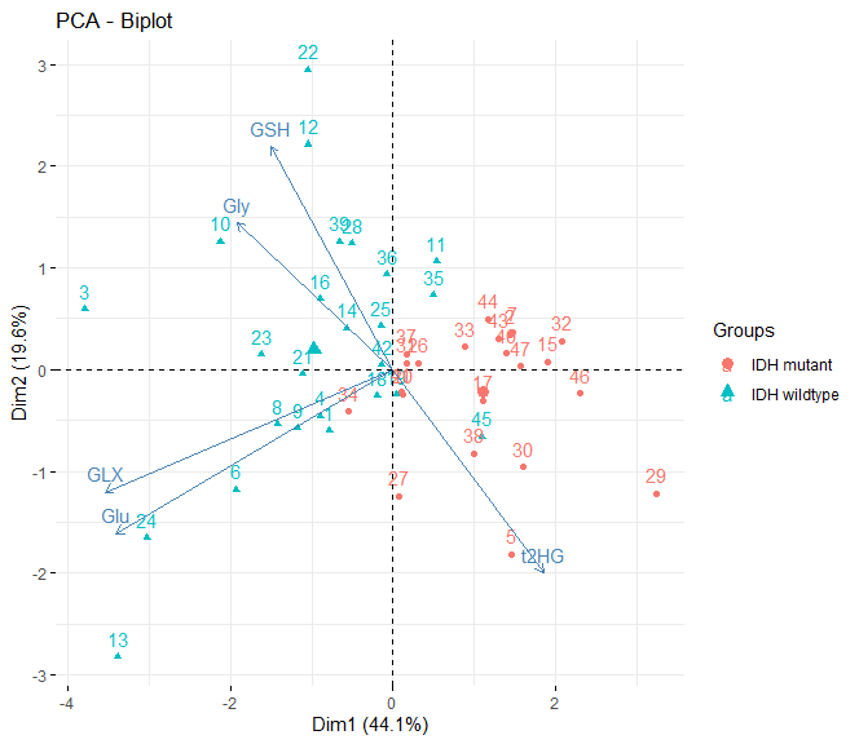
Forty-seven patients were retrospectively included in the study after data exclusion based on quality control (25 IDH wild-types, mean age: 52 ± 17 years; 22 IDH-mutants, mean age: 42 ± 13 years). 2HG quantification from difference spectra (Figure 1A) yielded a specificity and sensitivity for detection of IDH mutation of 0.96 and 0.54, respectively (considering CRLB < 20%). Using edit-off spectra (Figure 1B), the following metabolites were quantified and included in the statistical analysis: alanine, ascorbate, aspartate, citrate, cystathionine, 2HG, gamma-aminobutyric acid (GABA), glutamine (Gln), glutamate (Glu), combined Gln with Glu (Glx), glycine (Gly), glutathione (GSH), myo-inositol, N-acetyl-aspartate (NAA), N-acetyl-aspartatyl-glutamate (NAAG), scyllo-inositol, total creatine (tCr), tCho, NAA+NAAG (tNAA), and combined lactate with threonine (Lac + Thr). Results of the univariate Mann-Whitney U tests are summarized in Table 1. Significant differences between IDH-mutants and wild-types with multiparametric adjustment were observed for Glx (p<0.0001), Glu (p<0.005) as well as Gly, GSH and 2HG (p<0.05). Gln, alanine, myo-inositol, cystathionine, and NAAG had significant raw p values, although they did not survive false discovery rate correction. PCA (Figure 2) and ROC analysis (Figure 3), conducted exclusively on significant metabolites, distinctly separated the two groups, revealing a robust differentiation with an area under the curve (AUC) approaching 0.95. In contrast, using 2HG alone yielded a lower AUC of 0.75 from edit-off spectra and 0.63 from difference spectra.DISCUSSION
While reliable 2HG data are crucial for highly specific detection of IDH mutations, our results demonstrate that a panel of metabolites, including Glx, Glu, Gly, and GSH, collectively may offer superior classification capabilities in a clinical setting. The lower levels of Glu in IDH-mutant vs. wild-type gliomas, suggest a shift from Glu to 2HG accumulation from alpha-ketoglutarate, caused by IDH mutations6,7. Lower Gly levels in IDH-mutant gliomas are in line with previous findings suggesting this metabolite as a marker of tumor proliferation and bad prognosis8. GSH results are also in agreement with in vivo and ex vivo studies suggesting lower GSH in IDH-mutant vs wild-type tissue samples9.Our study demonstrated the superior accuracy of our PLSDA model, compared to the use of 2HG alone, in distinguishing IDH-mutant from wild-type gliomas in a clinical setting. This highlights the efficacy of a multivariate approach, indicating promising clinical implications for accurate diagnosis. Metabolic profiles will be correlated with patient overall survival. A better understanding of metabolic alterations beyond 2HG in gliomas may support novel prognostic and therapeutic developments.Acknowledgements
CD, SL and FB acknowledge support from Investissements d’avenir [grant number ANR-10-IAIHU-06 and ANR-11-INBS-0006]. FB acknowledges support from Agence Nationale de la Recherche [grant number ANR-20-CE17-0002-01]. DD and MM acknowledge support from following National Institutes of Health (NIH) grants: BTRC P41 EB015894 and P30 NS076408. MM acknowledges support from the NIH grant U01CA269110. TBN acknowledges support from Bayer HealthCare/RSNA Research Seed Grant and Cancer Research Society.References
[1] L. Dang et al., « Cancer-associated IDH1 mutations produce 2-hydroxyglutarate », Nature, vol. 462, no 7274, p. 739‑744, déc. 2009, doi: 10.1038/nature08617.
[2] C. Choi et al., « 2-hydroxyglutarate detection by magnetic resonance spectroscopy in IDH-mutated patients with gliomas », Nat Med, vol. 18, no 4, p. 624‑629, janv. 2012, doi: 10.1038/nm.2682.
[3] O. C. Andronesi et al., « Detection of 2-hydroxyglutarate in IDH-mutated glioma patients by in vivo spectral-editing and 2D correlation magnetic resonance spectroscopy », Sci Transl Med, vol. 4, no 116, p. 116ra4, janv. 2012, doi: 10.1126/scitranslmed.3002693.
[4] M. Mescher, H. Merkle, J. Kirsch, M. Garwood, et R. Gruetter, « Simultaneous in vivo spectral editing and water suppression », NMR Biomed, vol. 11, no 6, p. 266‑272, oct. 1998, doi: 10.1002/(sici)1099-1492(199810)11:6<266::aid-nbm530>3.0.co;2-j.
[5] S. W. Provencher, « Estimation of metabolite concentrations from localized in vivo proton NMR spectra », Magn Reson Med, vol. 30, no 6, p. 672‑679, déc. 1993, doi: 10.1002/mrm.1910300604.
[6] H. Nagashima et al., « Diagnostic value of glutamate with 2-hydroxyglutarate in magnetic resonance spectroscopy for IDH1 mutant glioma », Neuro Oncol, vol. 18, no 11, p. 1559‑1568, nov. 2016, doi: 10.1093/neuonc/now090.
[7] F. Ohka et al., « Quantitative metabolome analysis profiles activation of glutaminolysis in glioma with IDH1 mutation », Tumour Biol, vol. 35, no 6, p. 5911‑5920, juin 2014, doi: 10.1007/s13277-014-1784-5.
[8] V. Tiwari et al., « Glycine by MR spectroscopy is an imaging biomarker of glioma aggressiveness », Neuro Oncol, vol. 22, no 7, p. 1018‑1029, juill. 2020, doi: 10.1093/neuonc/noaa034.
[9] F. Branzoli et M. Marjańska, « Magnetic Resonance Spectroscopy of IDH-mutated gliomas: current knowledge on the neurochemical profile », Curr Opin Neurol, vol. 33, no 4, p. 413‑421, août 2020, doi: 10.1097/WCO.0000000000000833.
Figures