1831
Simultaneous Multi-Region Detection of GABA+ and Glx using 3D Spatially Resolved SLOW-editing and EPSI-readout at 7T
1Institute for Diagnostic and Interventional Neuroradiology, Support Center for Advanced Neuroimaging (SCAN), University of Bern, Bern, Switzerland, 2Translational Imaging Center, sitem-insel, Bern, Switzerland, Bern, Switzerland
Synopsis
Keywords: Spectroscopy, Molecular Imaging, GABA, Spectral editing, MRSI
Motivation: Robust B0 and B1+ detection of GABA+ and Glx in 3D or whole brain MRSI using spectral editing is challenging at 7T.
Goal(s): To simultaneously detect GABA+ and Glx in multi-regions and generate 3D maps using SLOW-editing for human brain at 7T.
Approach: SLOW-EPSI was performed on 5 healthy volunteers.
Results: Our method is robust to [-0.3 ppm, +0.3 ppm] B0 and [40%, 250%] B1+ for GABA+/Glx editing. 9-minute acquisition is sufficient for any arbitrarily shaped volume quantification. 18-27 minutes acquisition is sufficient for 3D mapping of GABA+. 9-18 minutes acquisition is sufficient for 3D mapping of Glx.
Impact: Our work presents a large 3D or whole-brain MRSI tool for GABA+ and Glx quantification and mapping at 7T, which allows clinicians to examine changes in GABA+ and Glx in the brain for any arbitrarily shaped volume.
INTRODUCTION
The Mescher-Garwood (MEGA) editing technique has commonly been utilized for in vivo detection of GABA and Glx, particularly in studies with small volume-of-interest utilizing single-voxel spectroscopy (SVS) 1,2 and single-slice MRSI 3,4 at 3T and 7T.A recent method described by our group (SLOW-editing) 5–7 has emerged as a promising alternative to MEGA-editing 8 specifically designed for large 3D volume MRSI at 7T. In this study, we employed the SLOW-editing technique at 7T with 5 healthy young participants, enabling simultaneous measurement of key neuro metabolites, including GABA+ and Glx, across various brain regions.
METHODS
The MRSI was performed on a Siemens 7T-scanner (MAGNETOM Terra, Germany) using the Nova 1Tx32Rx head-coil.The SLOW-EPSI 5,9 sequence parameters: TE = 68 ms, TR = 1500 ms, nominal matrix = 65 × 23 × 9, FOV = 280 × 100 × 70 mm, spatial resolution = 4.3 × 7.8 × 7.8 mm (0.26 ml), averages = 1, and TA = 9:04 min.
Five healthy subjects (average age 32.4, all males) were scanned. Four (#1-4) were measured with one average (9 minute), and one (#5) was measured with 4 averages (36 minutes).
For data reconstruction and pre-post-processing, MIDAS 10, MATLAB R2019b, and spectrIm-QMRS 11 were used.
ROIs/VOIs were selected after data acquisition in consensus with an imaging expert (neuroradiologist) and a spectroscopy expert as follows: gray matter, white matter, the neocortex (frontal and occipital lobe), cingulate gyrus, caudate nucleus, hippocampus, putamen, and thalamus.
TDFDFit 12 was used for the quantification of the data (spectral fitting). Mapping was performed using two methods: 1) Gaussian fitting and 2) peak integration for GABA+ (~2.88-3.15 ppm) and Glx (~3.65-3.85 ppm).
The GABA+/Glx_whole ratio was calculated as the fitting area of GABA+ (3.00 ppm) divided by the mean value of fitting Glx (3.75 ppm) across all regions:
$$\frac{GABA+(location\ i)}{Glx_{whole}}=\frac{A_{GABA+}^i}{A_{Glx}}$$
Where $$$A_{GABA+}^i$$$ is the fitting area of GABA at 3.0 ppm in location i, $$$A_{Glx}$$$ is the average Glx fitting area at 3.75 ppm across all locations.
RESULTS and DISCUSSION
Nine locations were manually selected, and the SLOW-difference spectra are displayed in Figure 1 with corresponding average volume (#1-5): global gray matter (37.9 ml), global white matter (20.0 ml), hippocampus (2.5 ml), cingulate gyrus (6.0 ml), neocortex in frontal lobe (6.9 ml), neocortex in occipital lobe (12.0 ml), caudate nucleus (1.2 ml), putamen (2.5 ml), and thalamus (6.7 ml).The GABA+ and Glx Gaussian fitting (1 to 4 averages) and peak integration (4 averages) maps for subject #5 are displayed in Figure 2. Overall, both GABA+ and Glx exhibit a similar distribution pattern, characterized by higher levels in the gray matter and lower levels in the white matter. Our results demonstrate that achieving high-quality 3D-maps necessitates a TA of 18-27 minutes (corresponding to 2-3 averages) for GABA+, and 9-18 minutes (1-2 averages) for Glx. In addition, the peak integration maps display analogous patterns to Gaussian fitting maps, underscoring the overall flatness of the spectral baseline achieved through the implementation of SLOW-EPSI (Figure 2). Notably, the Gaussian fitting maps exhibit better lateral symmetry compared to the peak integration maps, suggesting that minor baseline fluctuations can be effectively corrected using Gaussian fitting method.
Figure 3 illustrates the robust editing efficiency of the SLOW within a range of [+0.4,-0.3] ppm and [40%, 250%] B1+ for GABA, and [+0.3,-0.4] ppm and [40%, 250%] B1+ for glutamate. Conversely, the editing efficiency of MEGA remains robust within a narrower range of [+0.1,-0.1] ppm and [70%, 130%] B1+ for GABA, and [-0.1,-0.3] ppm and [70%, 130%] B1+ for glutamate.
In Figure 4, the hippocampus exhibited the lowest GABA+ level (median value: 0.031), while the caudate nucleus showed the highest GABA+ level (median value: 0.118). Additionally, the putamen, thalamus, and neocortex in occipital lobe showed global higher GABA+ levels compared to the gray matter, with values of 0.108, 0.092, and 0.091, respectively, which are consistent with study by Finkelman et al.2 at 7T.
Table 1 shows the Cramer-Rao Lower Bound errors (CRLB) of GABA+ fitting. Overall, the majority is well below 20%, while only one case exceeds 50% which was observed in subject #4 for the caudate nucleus, and two are undetectable (subject #1-2, hippocampus).
CONCLUSION
The method presented here measures GABA+ and Glx information in any brain area that can be flexibly selected during data analysis after the examination. Quantification of GABA+ and Glx across multiple brain regions through spectral fitting is achievable within a 9-minute acquisition. Additionally, generating 3D maps for GABA+ and Glx using Gaussian fitting and peak integration necessitates acquisition times of 18-27 minutes and 9-18 minutes, respectively.Acknowledgements
Supported by the Swiss National Science Foundation (SNSF-182569, and SNSF-207997).References
1. Hong D, Rohani Rankouhi S, Thielen JW, van Asten JJA, Norris DG. A comparison of sLASER and MEGA-sLASER using simultaneous interleaved acquisition for measuring GABA in the human brain at 7T. Lundberg P, ed. PLoS One. 2019;14(10):e0223702.
2. Finkelman T, Furman-Haran E, Paz R, Tal A. Quantifying the excitatory-inhibitory balance: A comparison of SemiLASER and MEGA-SemiLASER for simultaneously measuring GABA and glutamate at 7T. Neuroimage. 2022;247:118810.
3. Moser P, Hingerl L, Strasser B, et al. Whole-slice mapping of GABA and GABA+ at 7T via adiabatic MEGA-editing, real-time instability correction, and concentric circle readout. Neuroimage. 2019;184:475-489.
4. Jensen JE, de B. Frederick B, Renshaw PF. Grey and white matter GABA level differences in the human brain using two-dimensional, J-resolved spectroscopic imaging. NMR Biomed. 2005;18(8):570-576.
5. Weng G, Radojewski P, Sheriff S, et al. SLOW: A novel spectral editing method for whole‐brain MRSI at ultra high magnetic field. Magn Reson Med. 2022;88(1):53-70.
6. Weng G, Ermiş E, Maragkou T, et al. Accurate prediction of isocitrate dehydrogenase -mutation status of gliomas using SLOW-editing magnetic resonance spectroscopic imaging at 7 T MR. Neurooncol Adv. 2023;5(1):1-14.
7. Weng G, Radojewski P, Slotboom J. α-D-Glucose as a non-radioactive MRS tracer for metabolic studies of the brain. Sci Rep. 2023;13(1):6159.
8. Mescher M, Merkle H, Kirsch J, Garwood M, Gruetter R. Simultaneous in vivo spectral editing and water suppression. NMR Biomed. 1998;11(6):266-272.
9. Ebel A, Maudsley AA. Improved spectral quality for 3D MR spectroscopic imaging using a high spatial resolution acquisition strategy. Magn Reson Imaging. 2003;21(2):113-120.
10. Maudsley AA, Darkazanli A, Alger JR, et al. Comprehensive processing, display and analysis forin vivo MR spectroscopic imaging. NMR Biomed. 2006;19(4):492-503.
11. Pedrosa de Barros N, Mckinley R, Knecht U, Wiest R, Slotboom J. Automatic quality control in clinical 1H MRSI of brain cancer. NMR Biomed. 2016;29(5):563-575.
12. Slotboom J, Boesch C, Kreis R. Versatile frequency domain fitting using time domain models and prior knowledge. Magn Reson Med. 1998;39(6):899-911.
13. Chen C, Sigurdsson HP, Pépés SE, et al. Activation induced changes in GABA: Functional MRS at 7 T with MEGA-sLASER. Neuroimage. 2017;156:207-213.
Figures
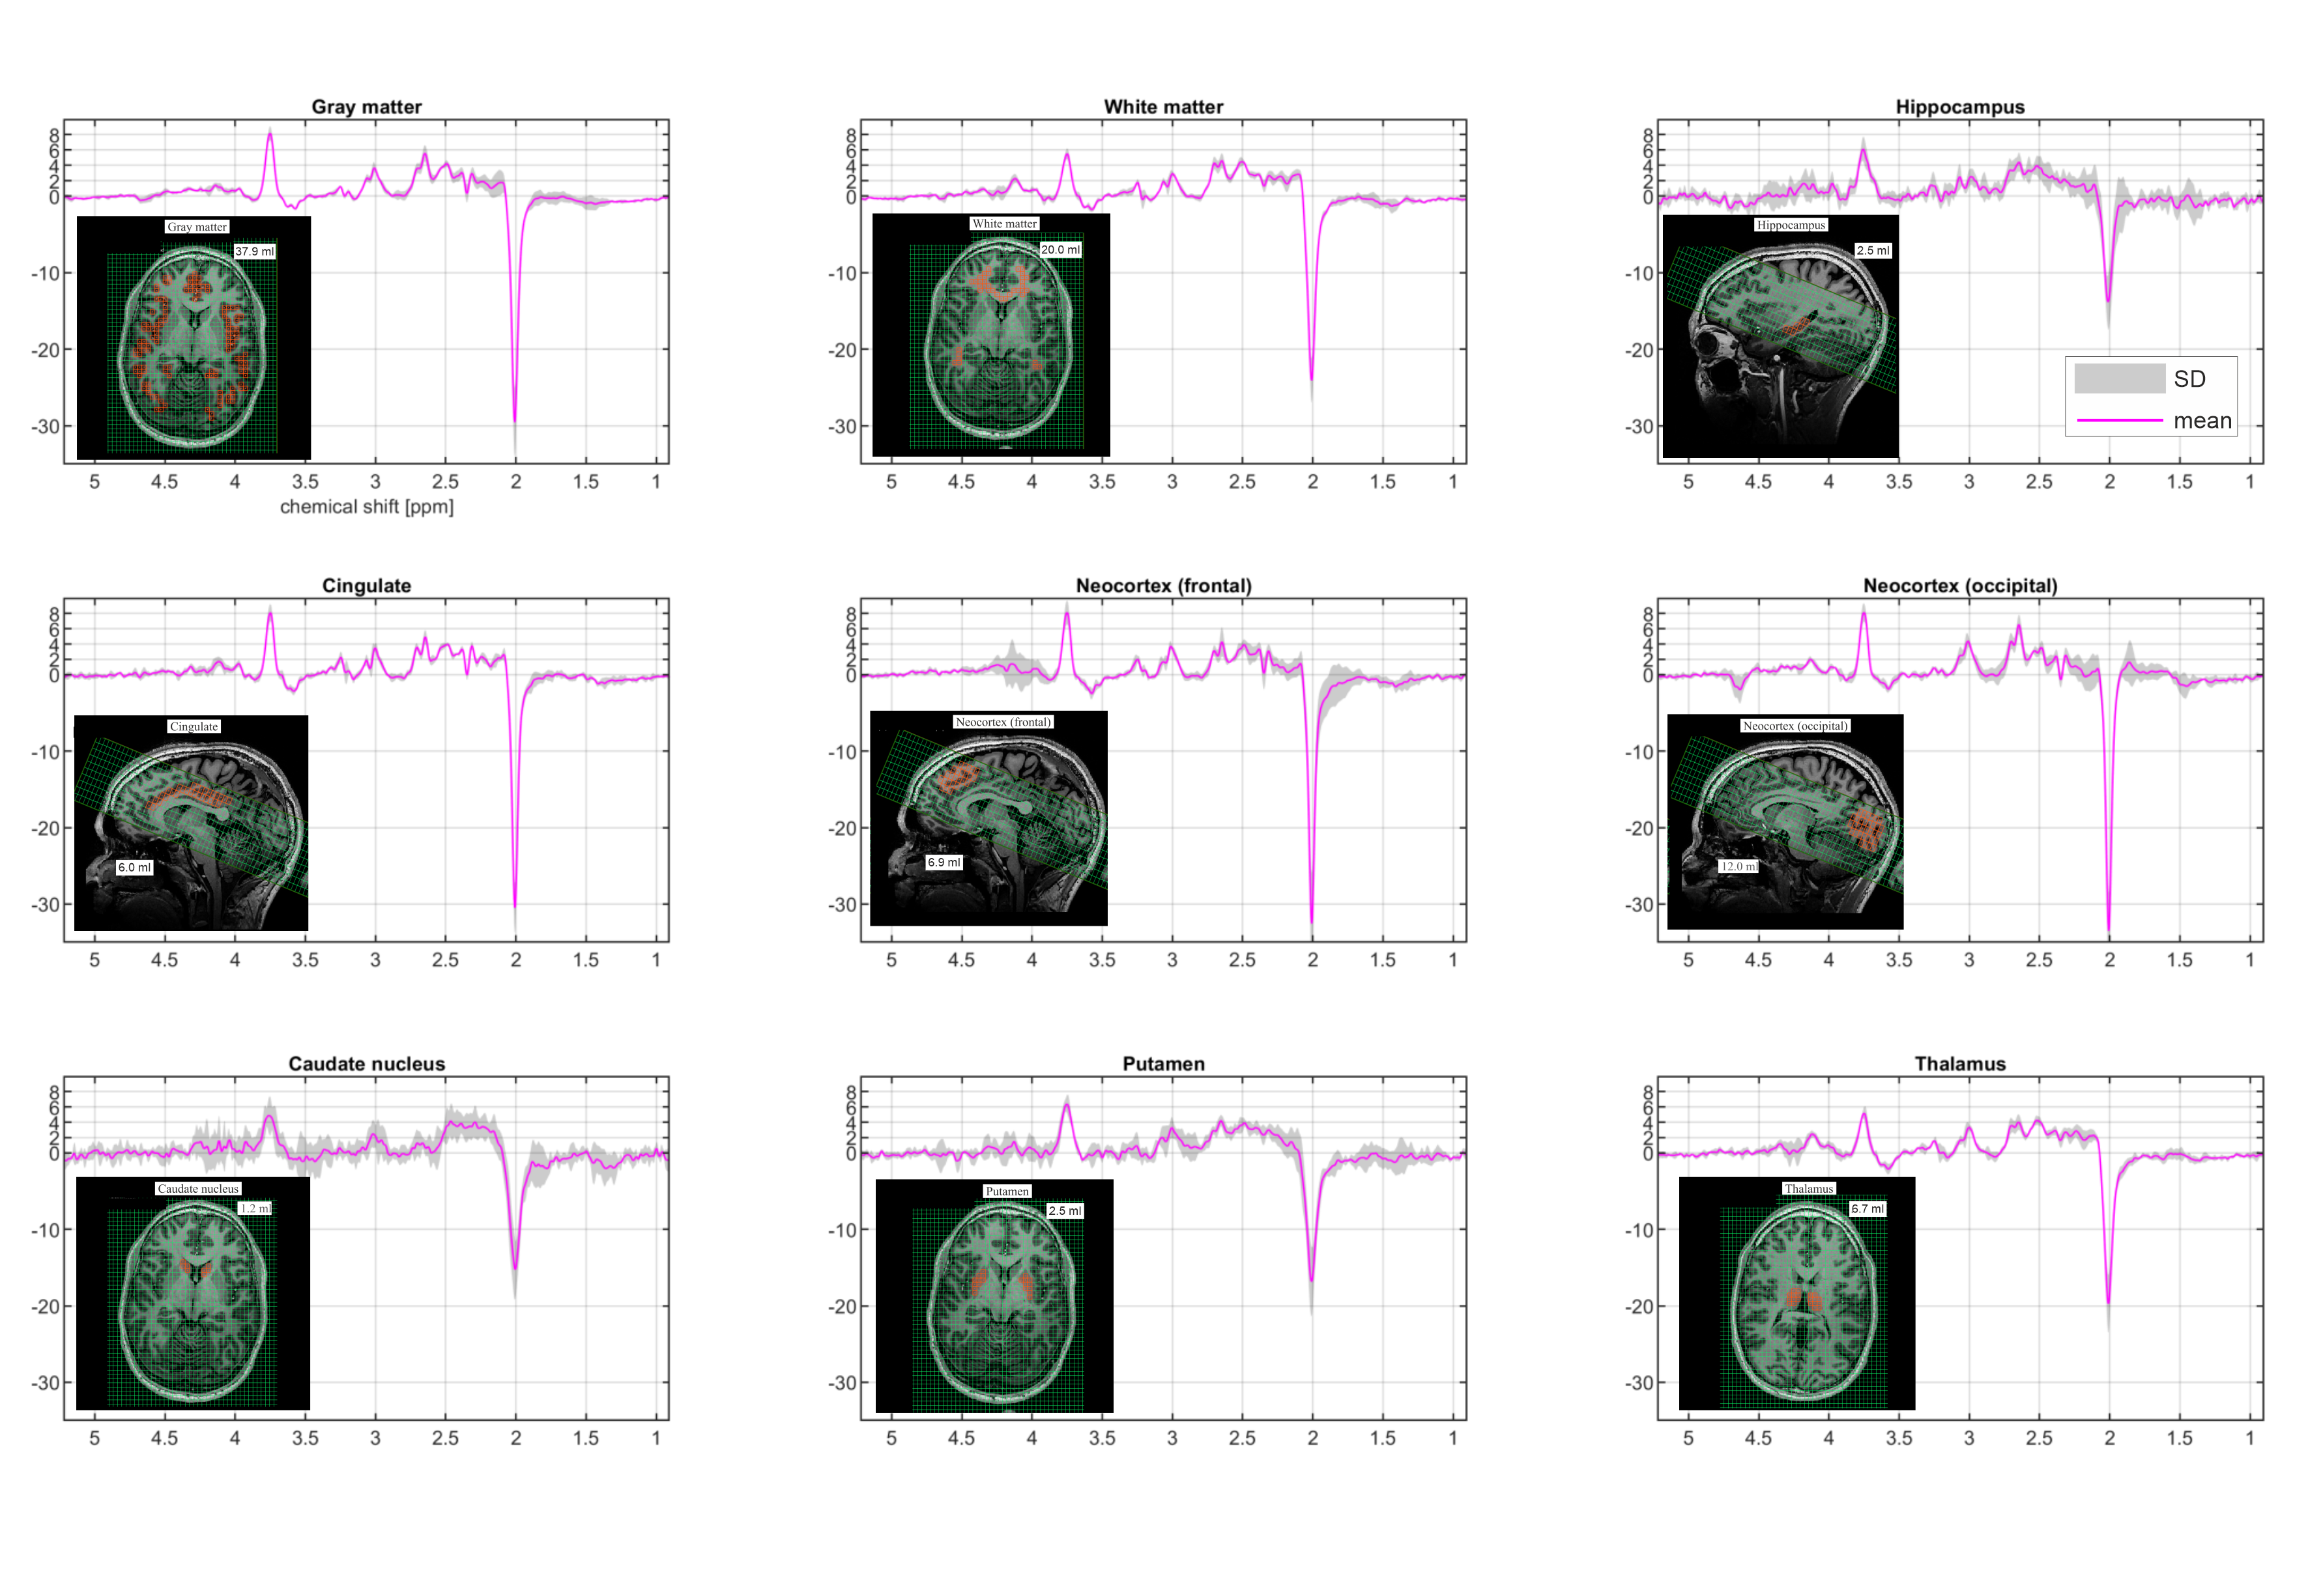
Figure 1: Average spectra (magenta line) and corresponding selected regions (using subject #5 as an example). The gray zone represents the standard deviation observed across all subjects. Note that for simplicity only one slice has been shown and the selected VOIs cover 2-4 slices. Notably, the hippocampus, caudate nucleus and putamen have relatively small volume sizes. Consequently, the standard deviation (SD) throughout their spectra was relatively large, which should fully be attributed to the smaller volume sizes.
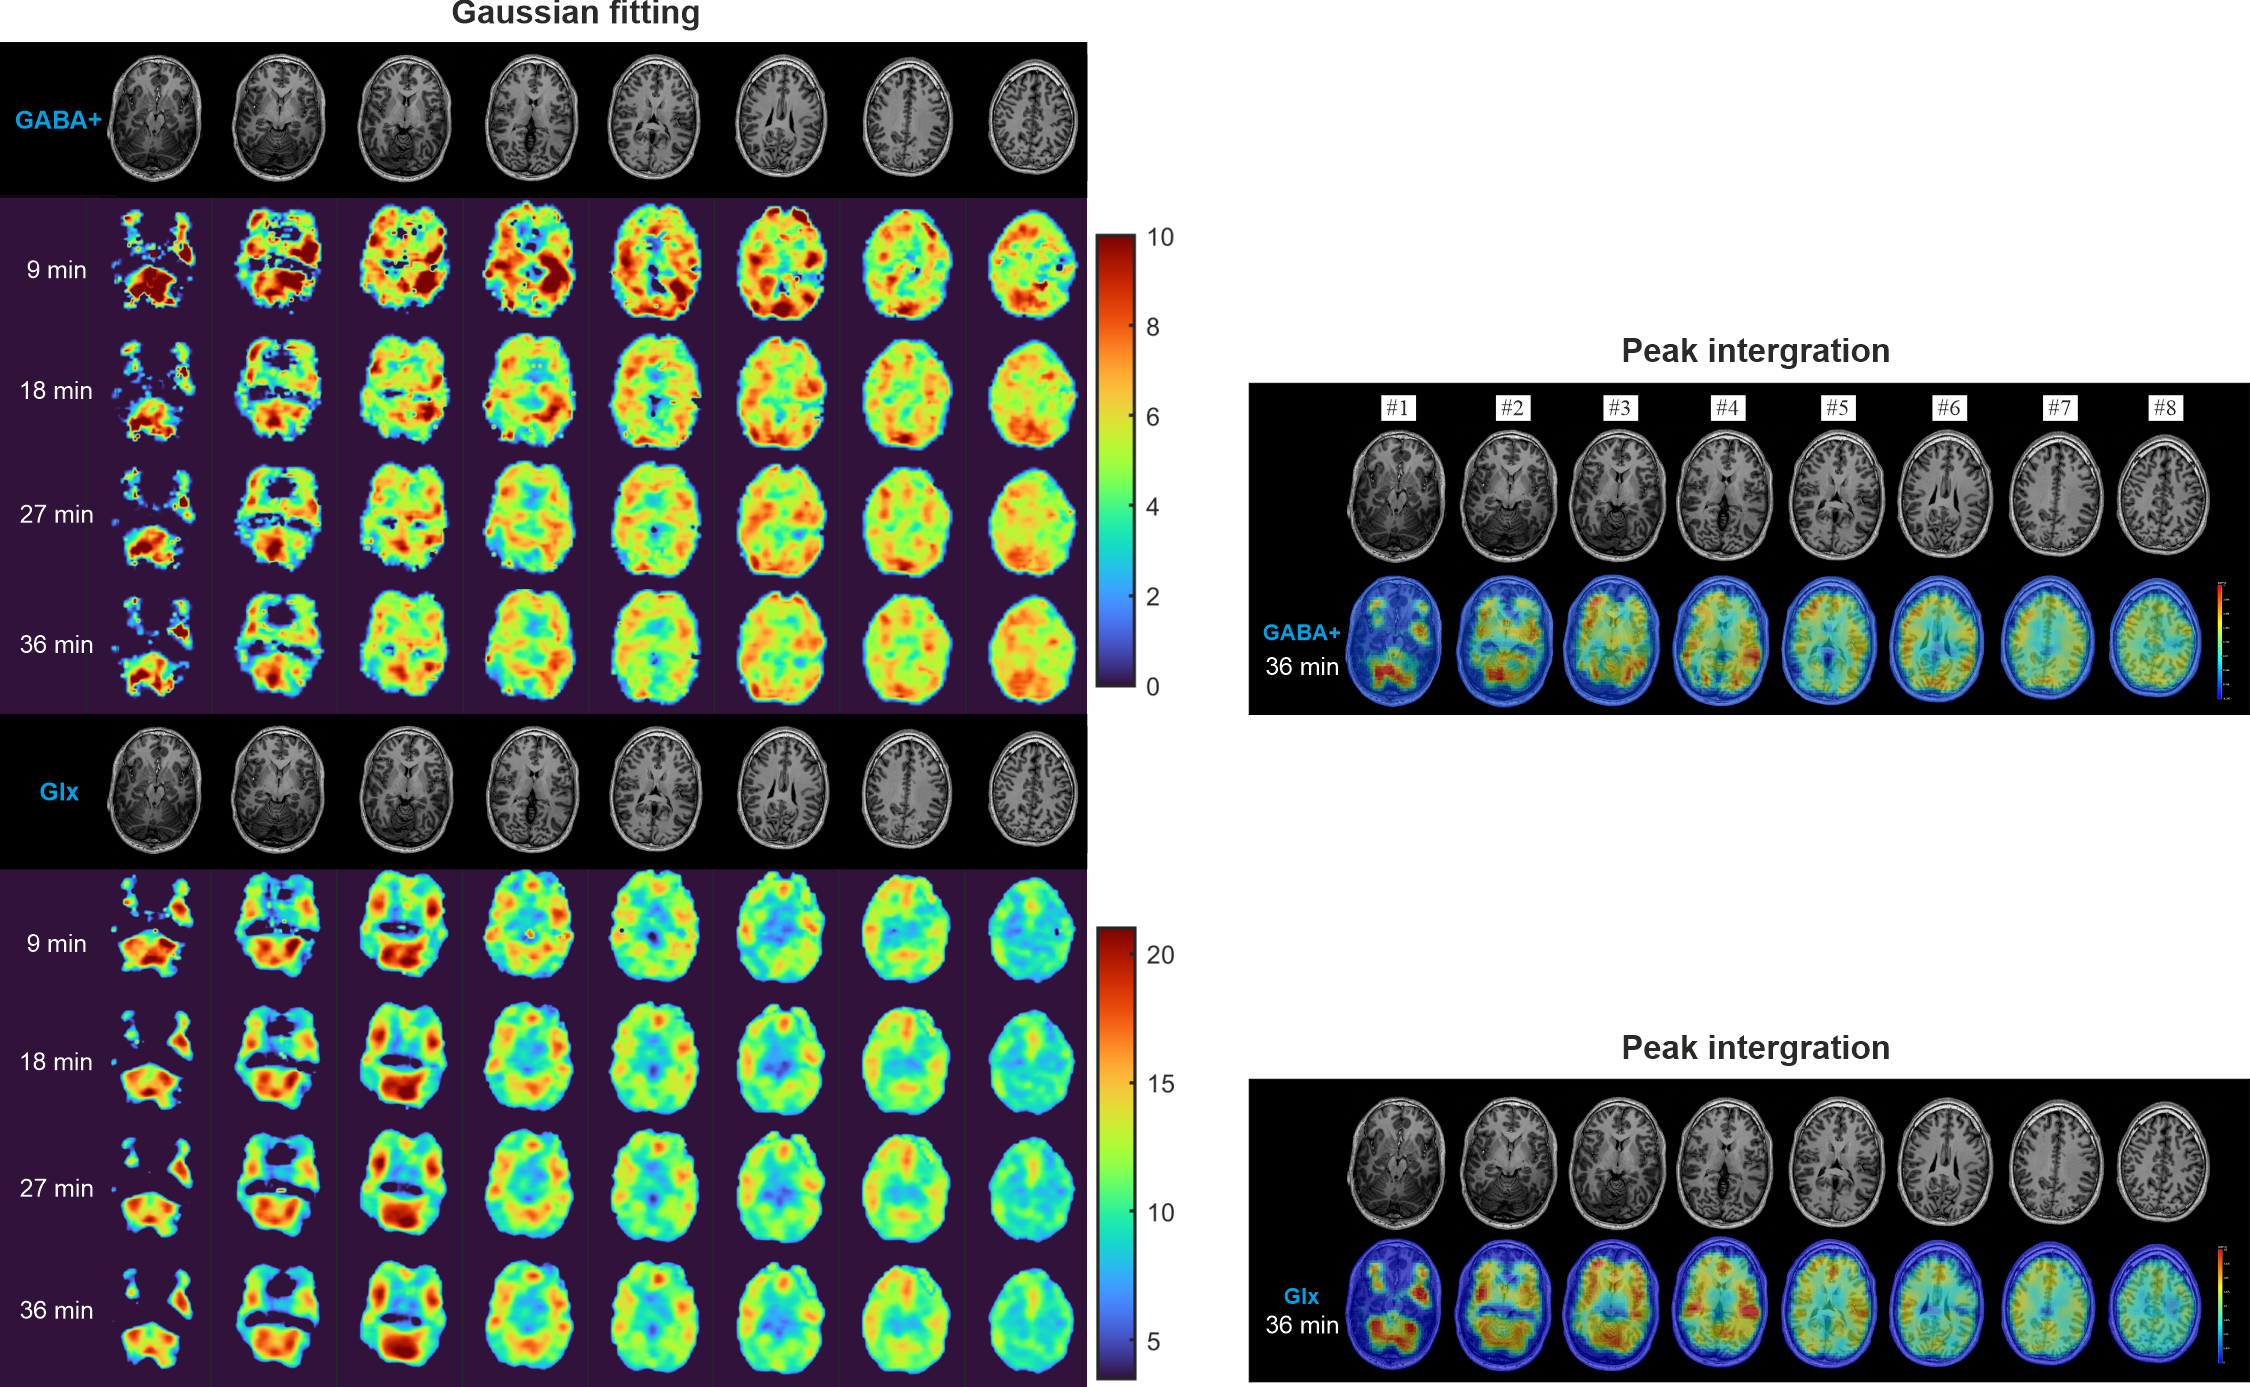
Figure 2: The GABA+ and Glx maps the subject (#5) in arbitrary unit. Left) Gaussian fitting maps with different acquisition time (9-36 minutes corresponding to 1-4 averages). Right) Peak integration maps with 36 minutes acquisition.
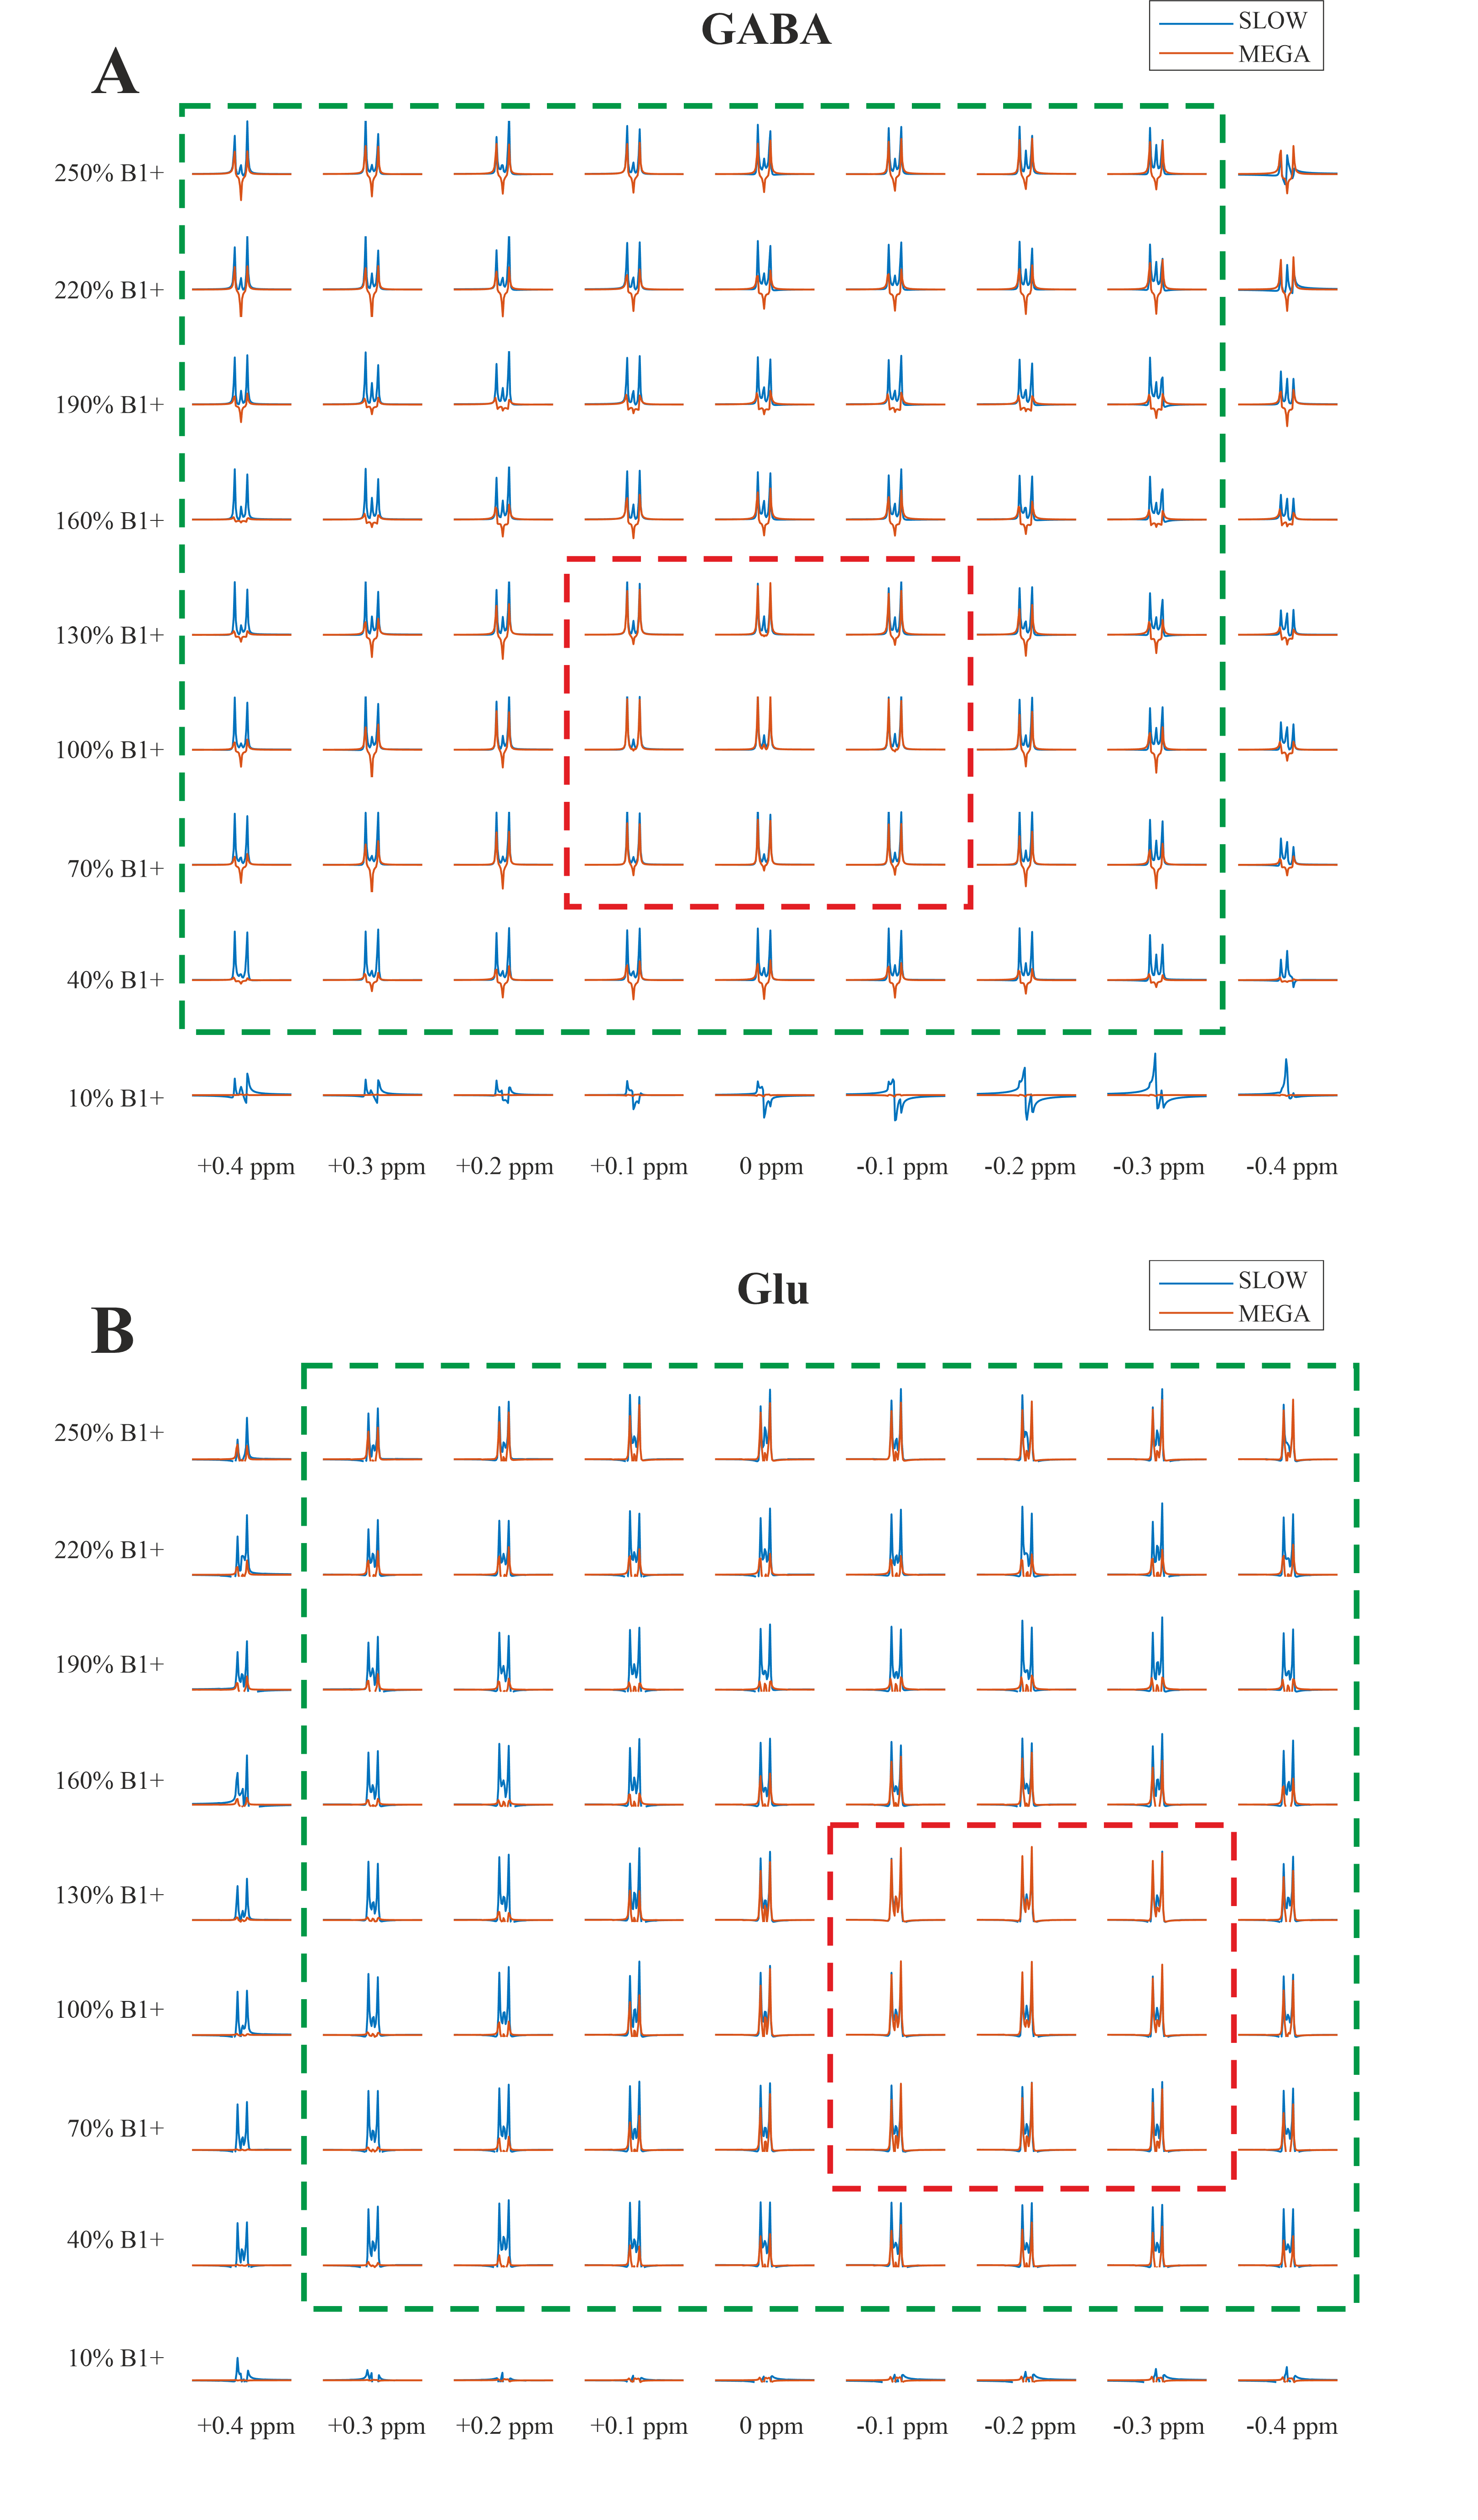
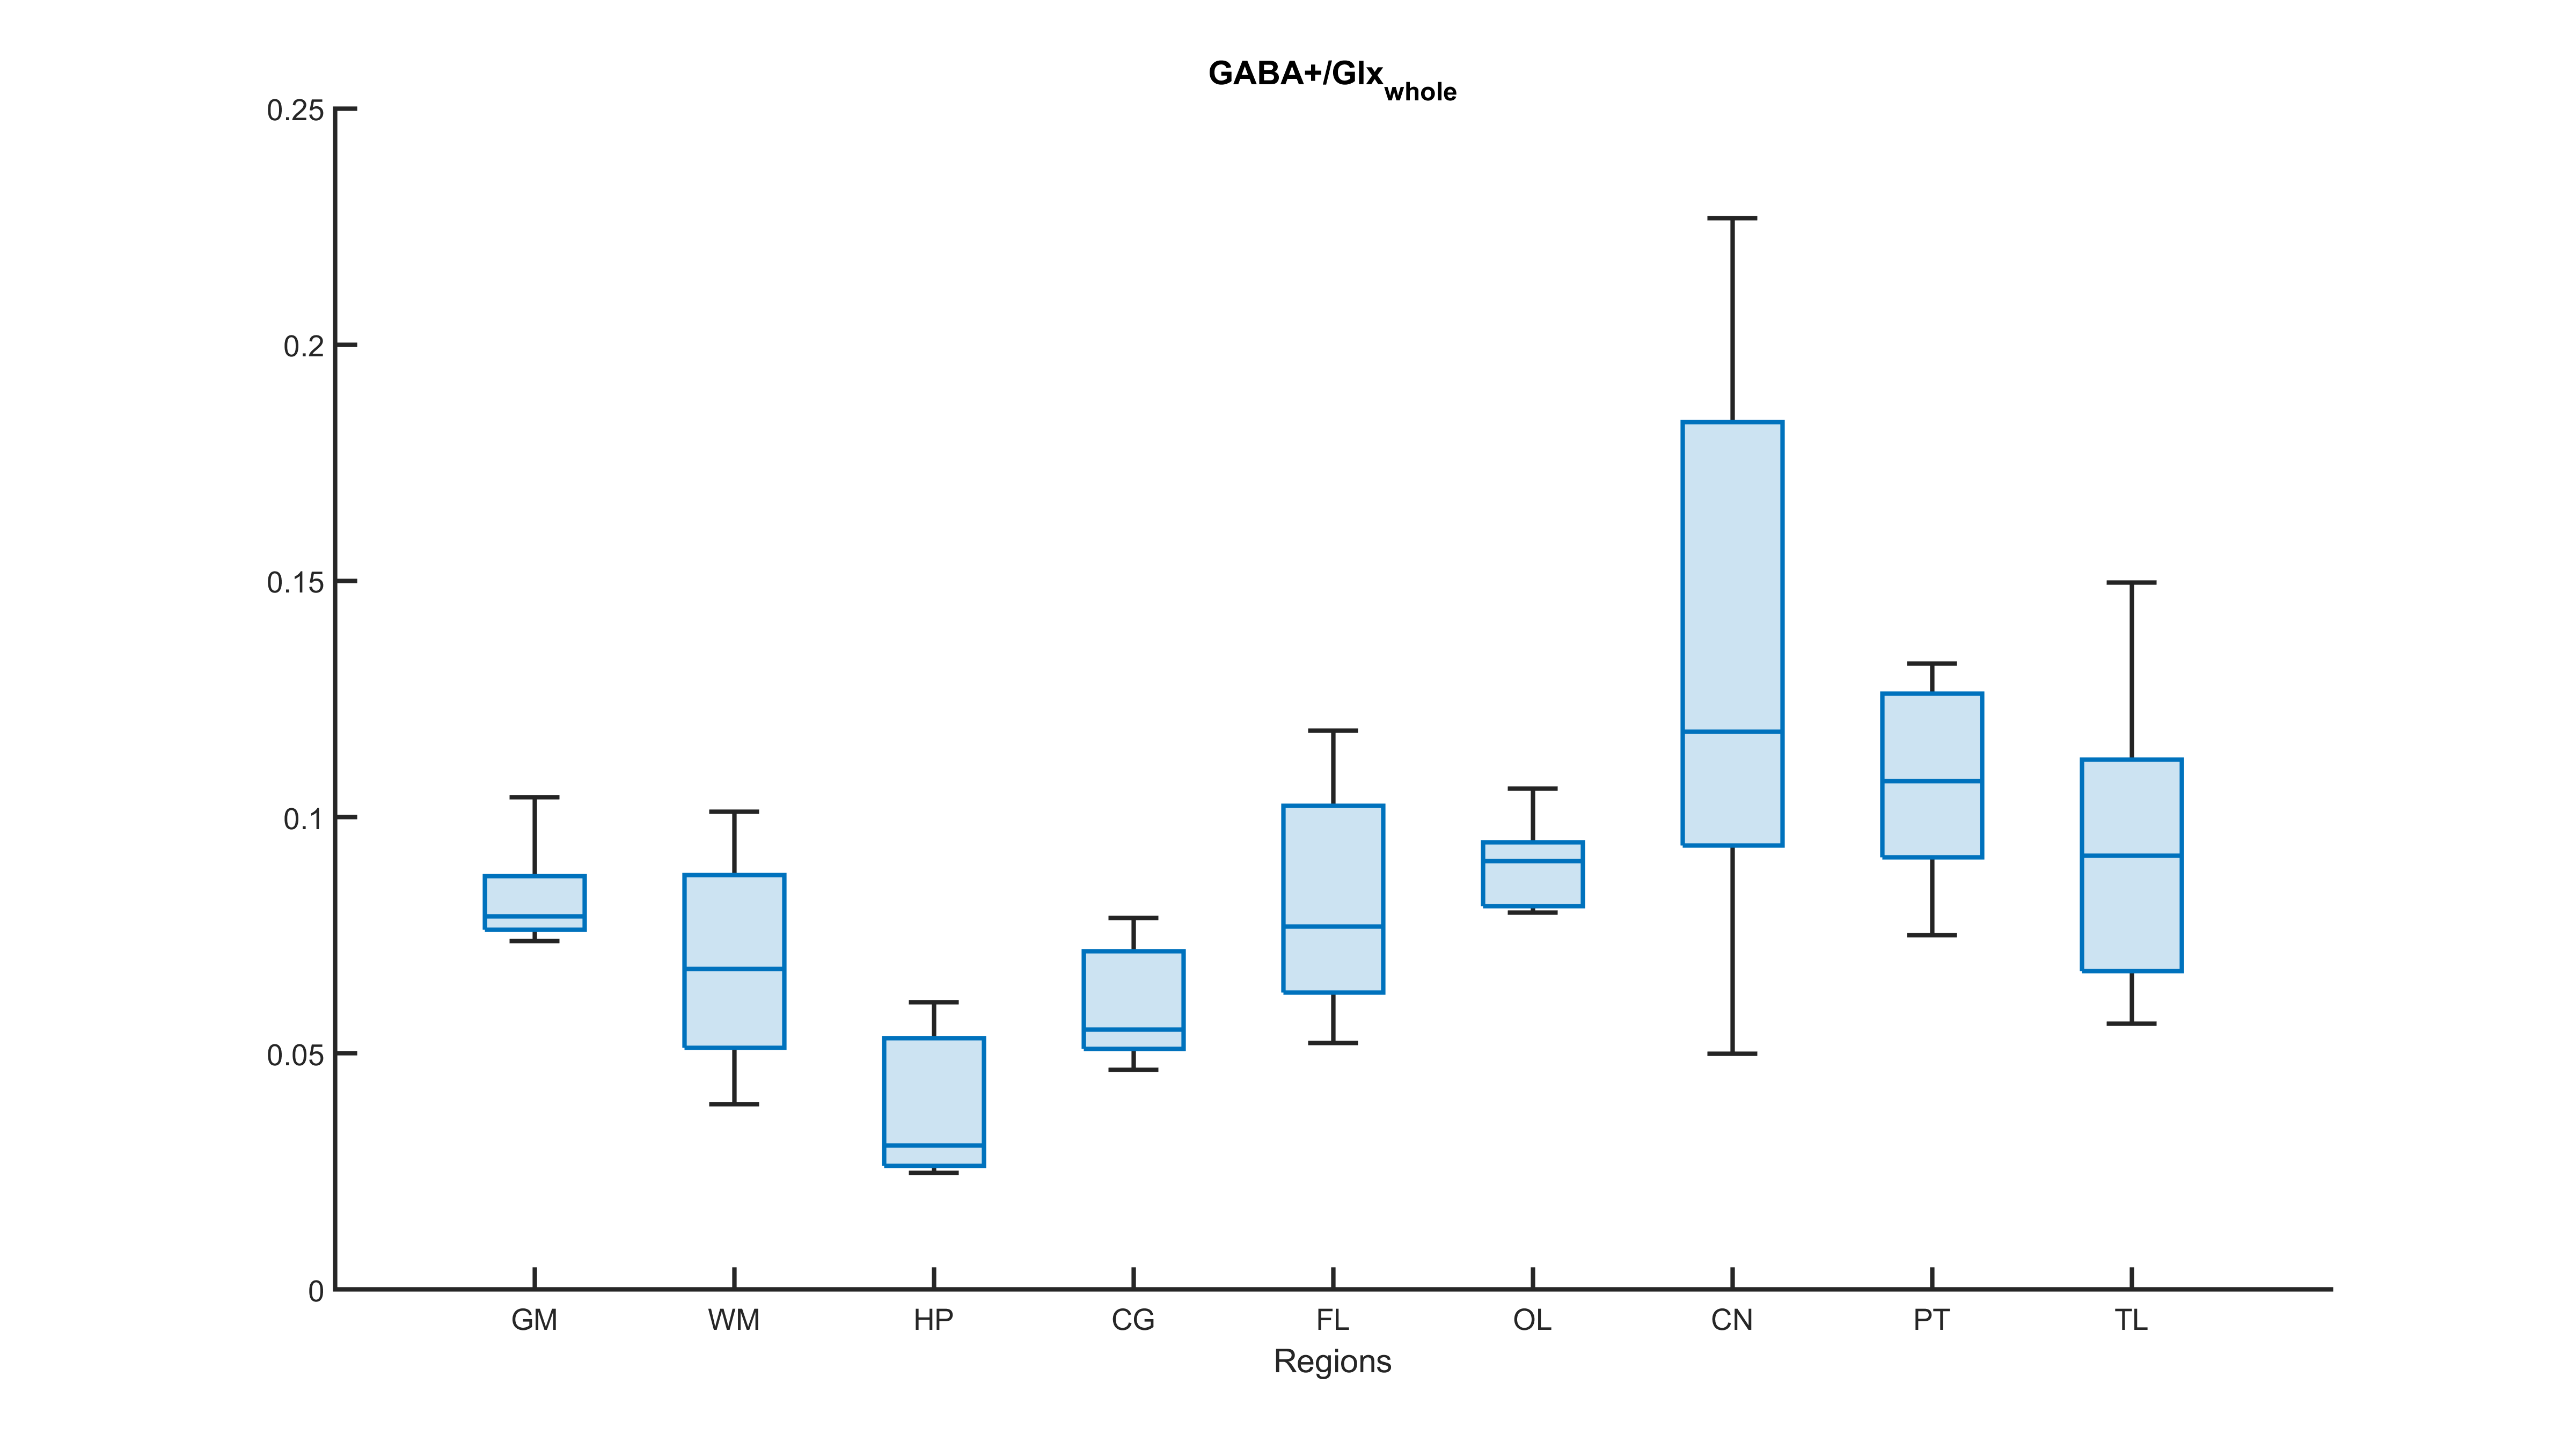
Figure 4: Box and whiskers plot of GABA+/Glx_whole ratio for all subjects. The median values are: 0.07904 (gray matter, GM), 0.06784 (white matter, WM), 0.03052 (hippocampus, HP), 0.05501 (cingulate gyrus, CG), 0.0768 (neocortex in frontal lobe, FL), 0.09065 (neocortex in occipital lobe, OL), 0.1181 (caudate nucleus, CN), 0.1076 (putamen, PT), and 0.09182 (thalamus, TL).
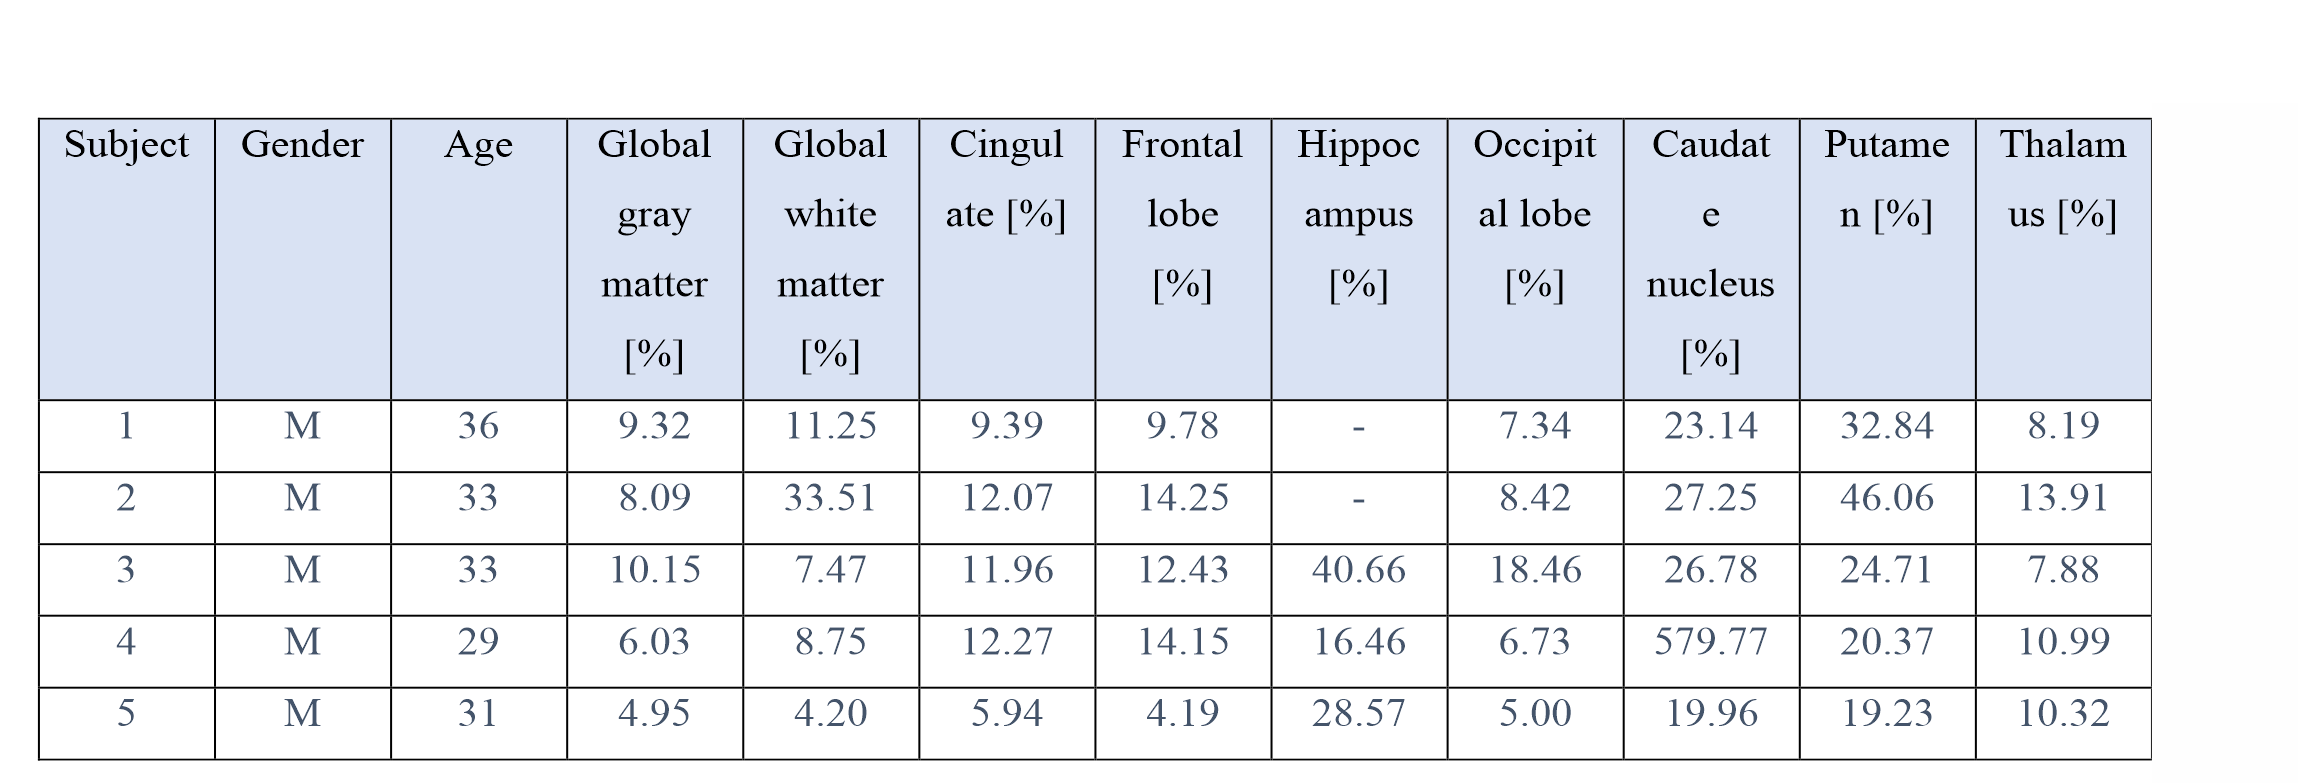
Table 1: Cramer-Rao Lower Bound (CRLB) of GABA+ fitting. ‘-’ means not detected.