1829
Mapping of cerebral metabolite concentrations in brain tumors using 1H-MRSI and quantitative MRI1Institute of Neuroradiology, Goethe University Frankfurt, University Hospital Frankfurt, Frankfurt, Germany, 2University Cancer Center Frankfurt (UCT), Frankfurt am Main, Germany, 3Frankfurt Cancer Institute (FCI), Frankfurt am Main, Germany, 4German Cancer Research Center (DKFZ) Heidelberg and German Cancer Consortium (DKTK), Heidelberg, Germany, 5Brain Imaging Center, Goethe University, Frankfurt, Germany
Synopsis
Keywords: Spectroscopy, Spectroscopy, Water referencing
Motivation: Absolute quantification of the 1H MRS metabolites remains a challenge for 2D MRSI, due to long acquisition times for the unsuppressed water reference and the multiple biases present due to relaxation and inhomogeneity.
Goal(s): To propose a water reference method combining single voxel STEAM and quantitative MRI (qMRI).
Approach: The method is demonstrated and tested against a standard water referencing method on one healthy subject. Its application is demonstrated in a brain tumor patient.
Results: Apart from obtaining absolute metabolite concentrations, corrected for all water relaxation times, 4 qMRI maps (PD, T1, T2* and QSM) maps are also generated.
Impact: We propose a method for absolute quantification of cerebral metabolites in 2D MRSI by combining STEAM and quantitative MRI. The method is tested against a reference method in a healthy subject and its application demonstrated for a brain tumor patient.
Introduction
Proton Magnetic Resonance Spectroscopy (1H-MRS) is a powerful technique capable of measuring in vivo metabolite concentrations1. In brain tumors, changes in the relative and absolute concentrations of metabolites serve as diagnostic markers for tumor types and grades2–4. While 2D MRSI (MRS imaging) measures metabolite concentrations in multiple voxels which can be displayed as metabolite maps5, Single Voxel Spectroscopy (SVS) obtains concentrations from one large voxel only. In order to calculate absolute metabolite concentrations, a reference water signal can be used6,7. Measuring these additional, non-water-suppressed spectra for 2D MRSI typically doubles the already lengthy acquisition time. Here we propose a 1H MRSI quantification approach which uses proton density (PD) from multi-parametric quantitative MRI (mp-qMRI) as water reference. Calibration of the PD values was performed using the water signal intensity from a single-voxel STEAM acquisition. Our approach allows an accurate calculation of metabolite concentrations, both in mmol per Litre of water and mmol per Litre of tissue volume for the entire MRSI slice.Methods
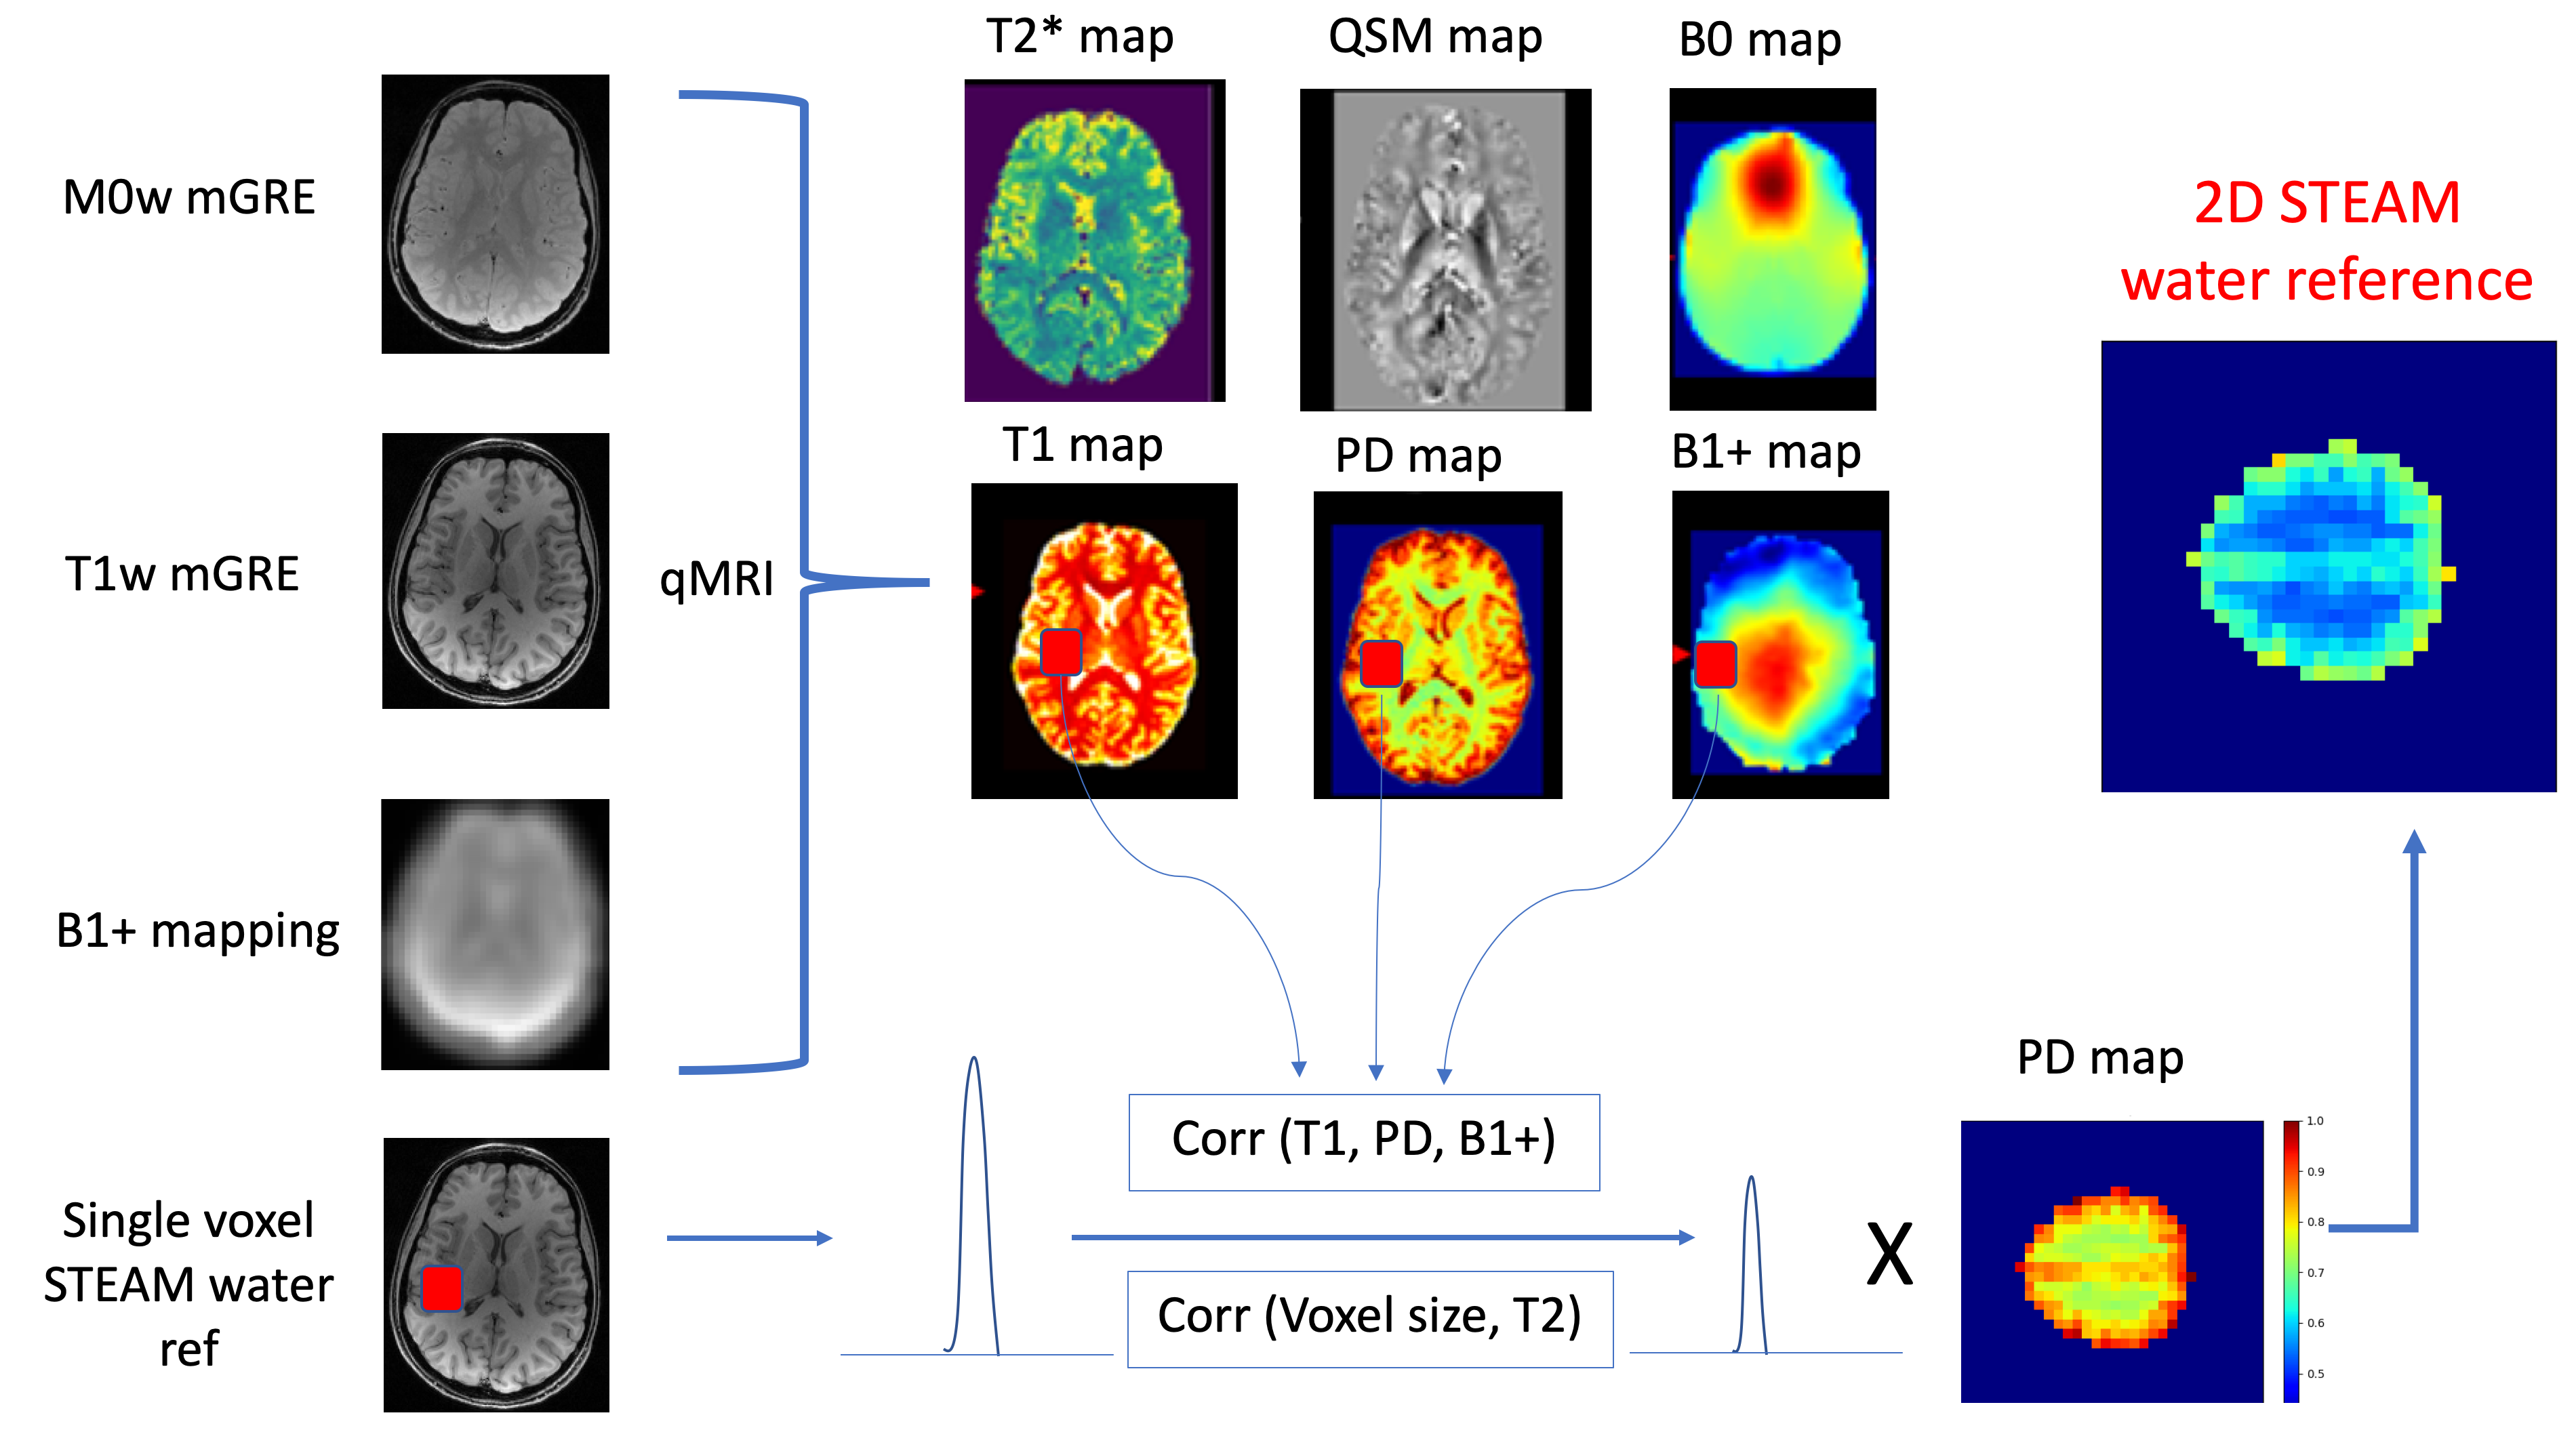
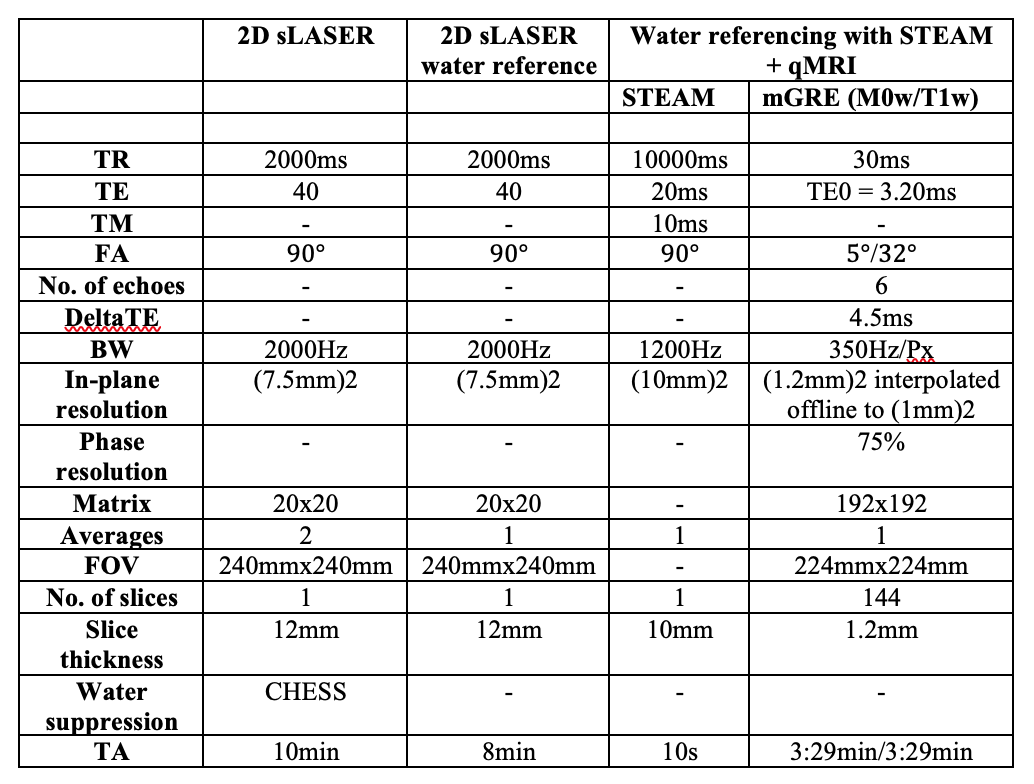
All acquisition parameters for each sequence are listed in Table 1. In vivo measurements were performed on one healthy volunteer and one brain tumor patient on a whole-body 3T MR Scanner (MAGNETOM Prisma (VE11C), Siemens Healthineers, Erlangen, Germany). The qMRI measurements included measuring 2 multi-Echo Gradient-Echo (mGRE) images (M0w and T1w) in order to map PD, T1, T2*, QSM (Fig 1). An additional sequence was acquired for B1+ mapping as described in8. The total measurement time was 8 minutes. MRSI was acquired with 2D semi-LASER (sLASER). A transversal slice just above the ventricles was chosen for the healthy volunteer with the VOI covering a rectangular area. For the brain tumor patient, the slice was positioned to cover the tumor and contralateral normal-appearing white matter (NAWM). The spectroscopic water reference was acquired with the same parameters as the 2D sLASER, but without water suppression and just one average. LCModel was used for spectroscopic data analysis and calibration of metabolite data by the water reference. For the proposed water calibration method, a STEAM spectrum was acquired with the voxel placed in WM (in contralateral NAWM for the brain tumor patient). The signal intensity from the STEAM spectrum was used to calibrate PD from qMRI as outlined in Fig.1. By reslicing the calibrated PD map to the sLASER slice and adjusting to the MRSI resolution, we generated a water reference image with MRS metrics. To calculate the quantitative metabolite maps, the metabolite intensities obtained from LCModel without water referencing were divided voxel-wise by the calibrated PD map. For both methods, the corrections for T1 and T2 relaxation were applied using reference values from literature9.Results
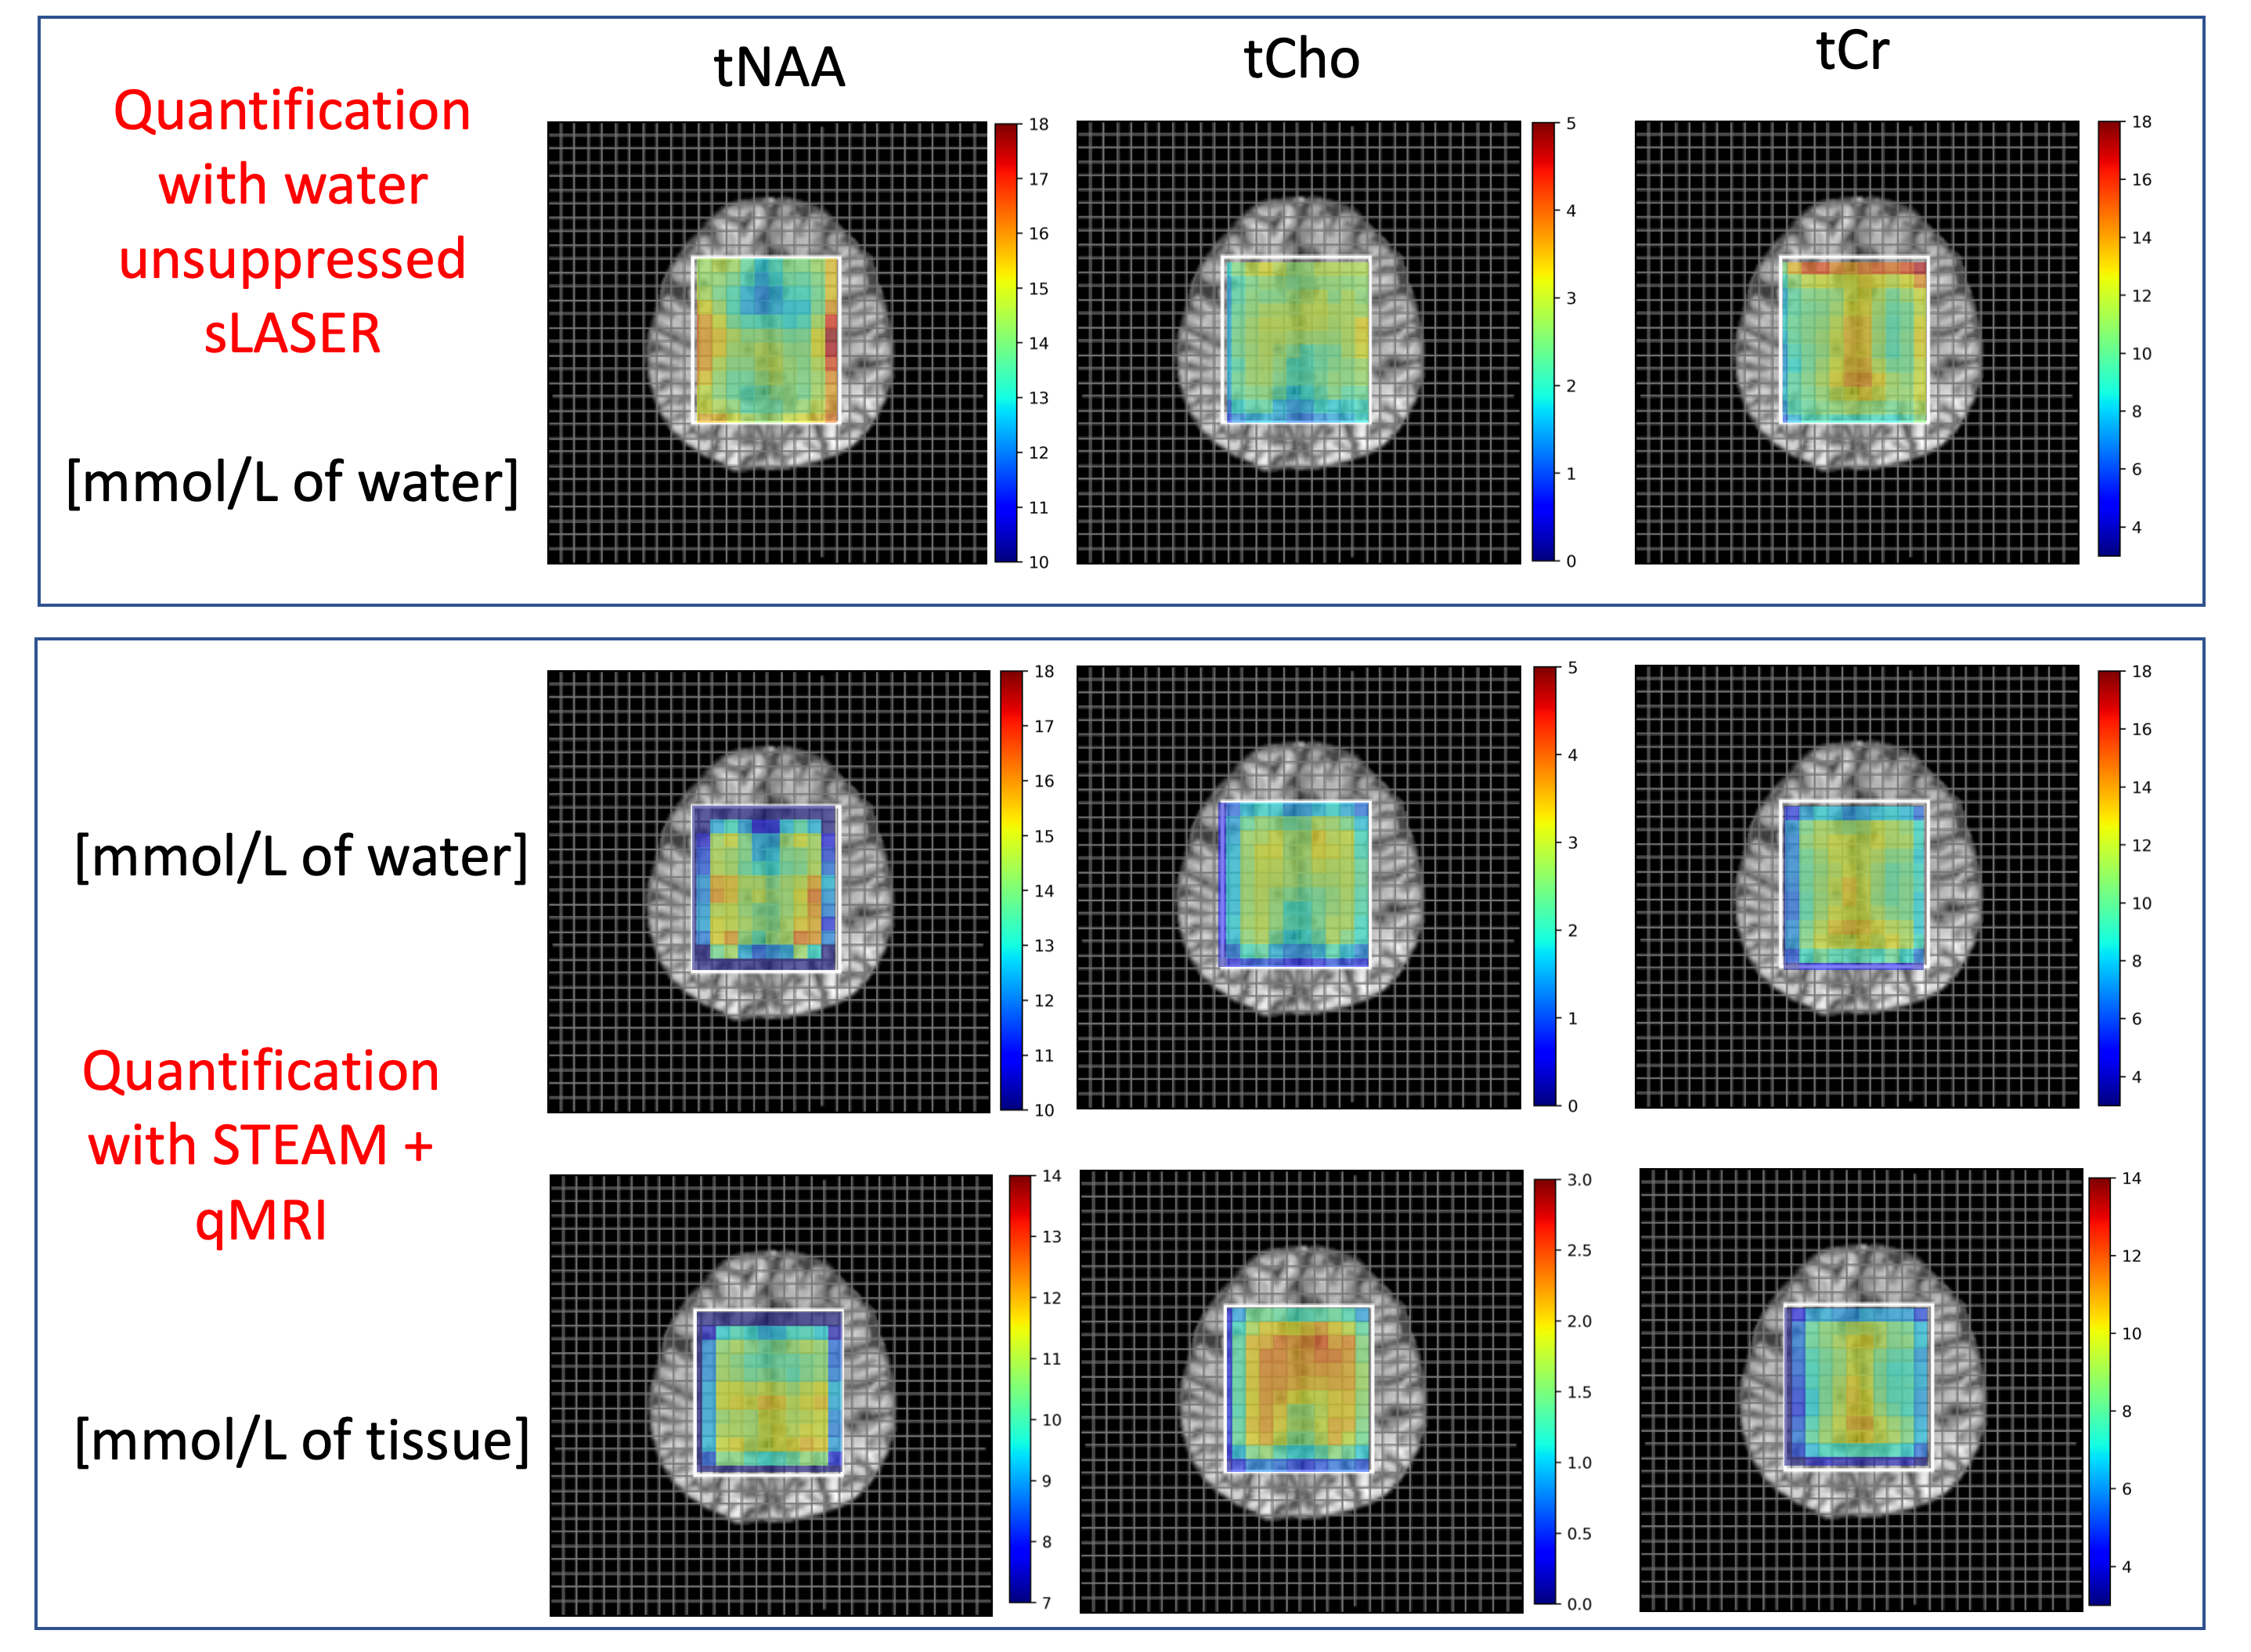
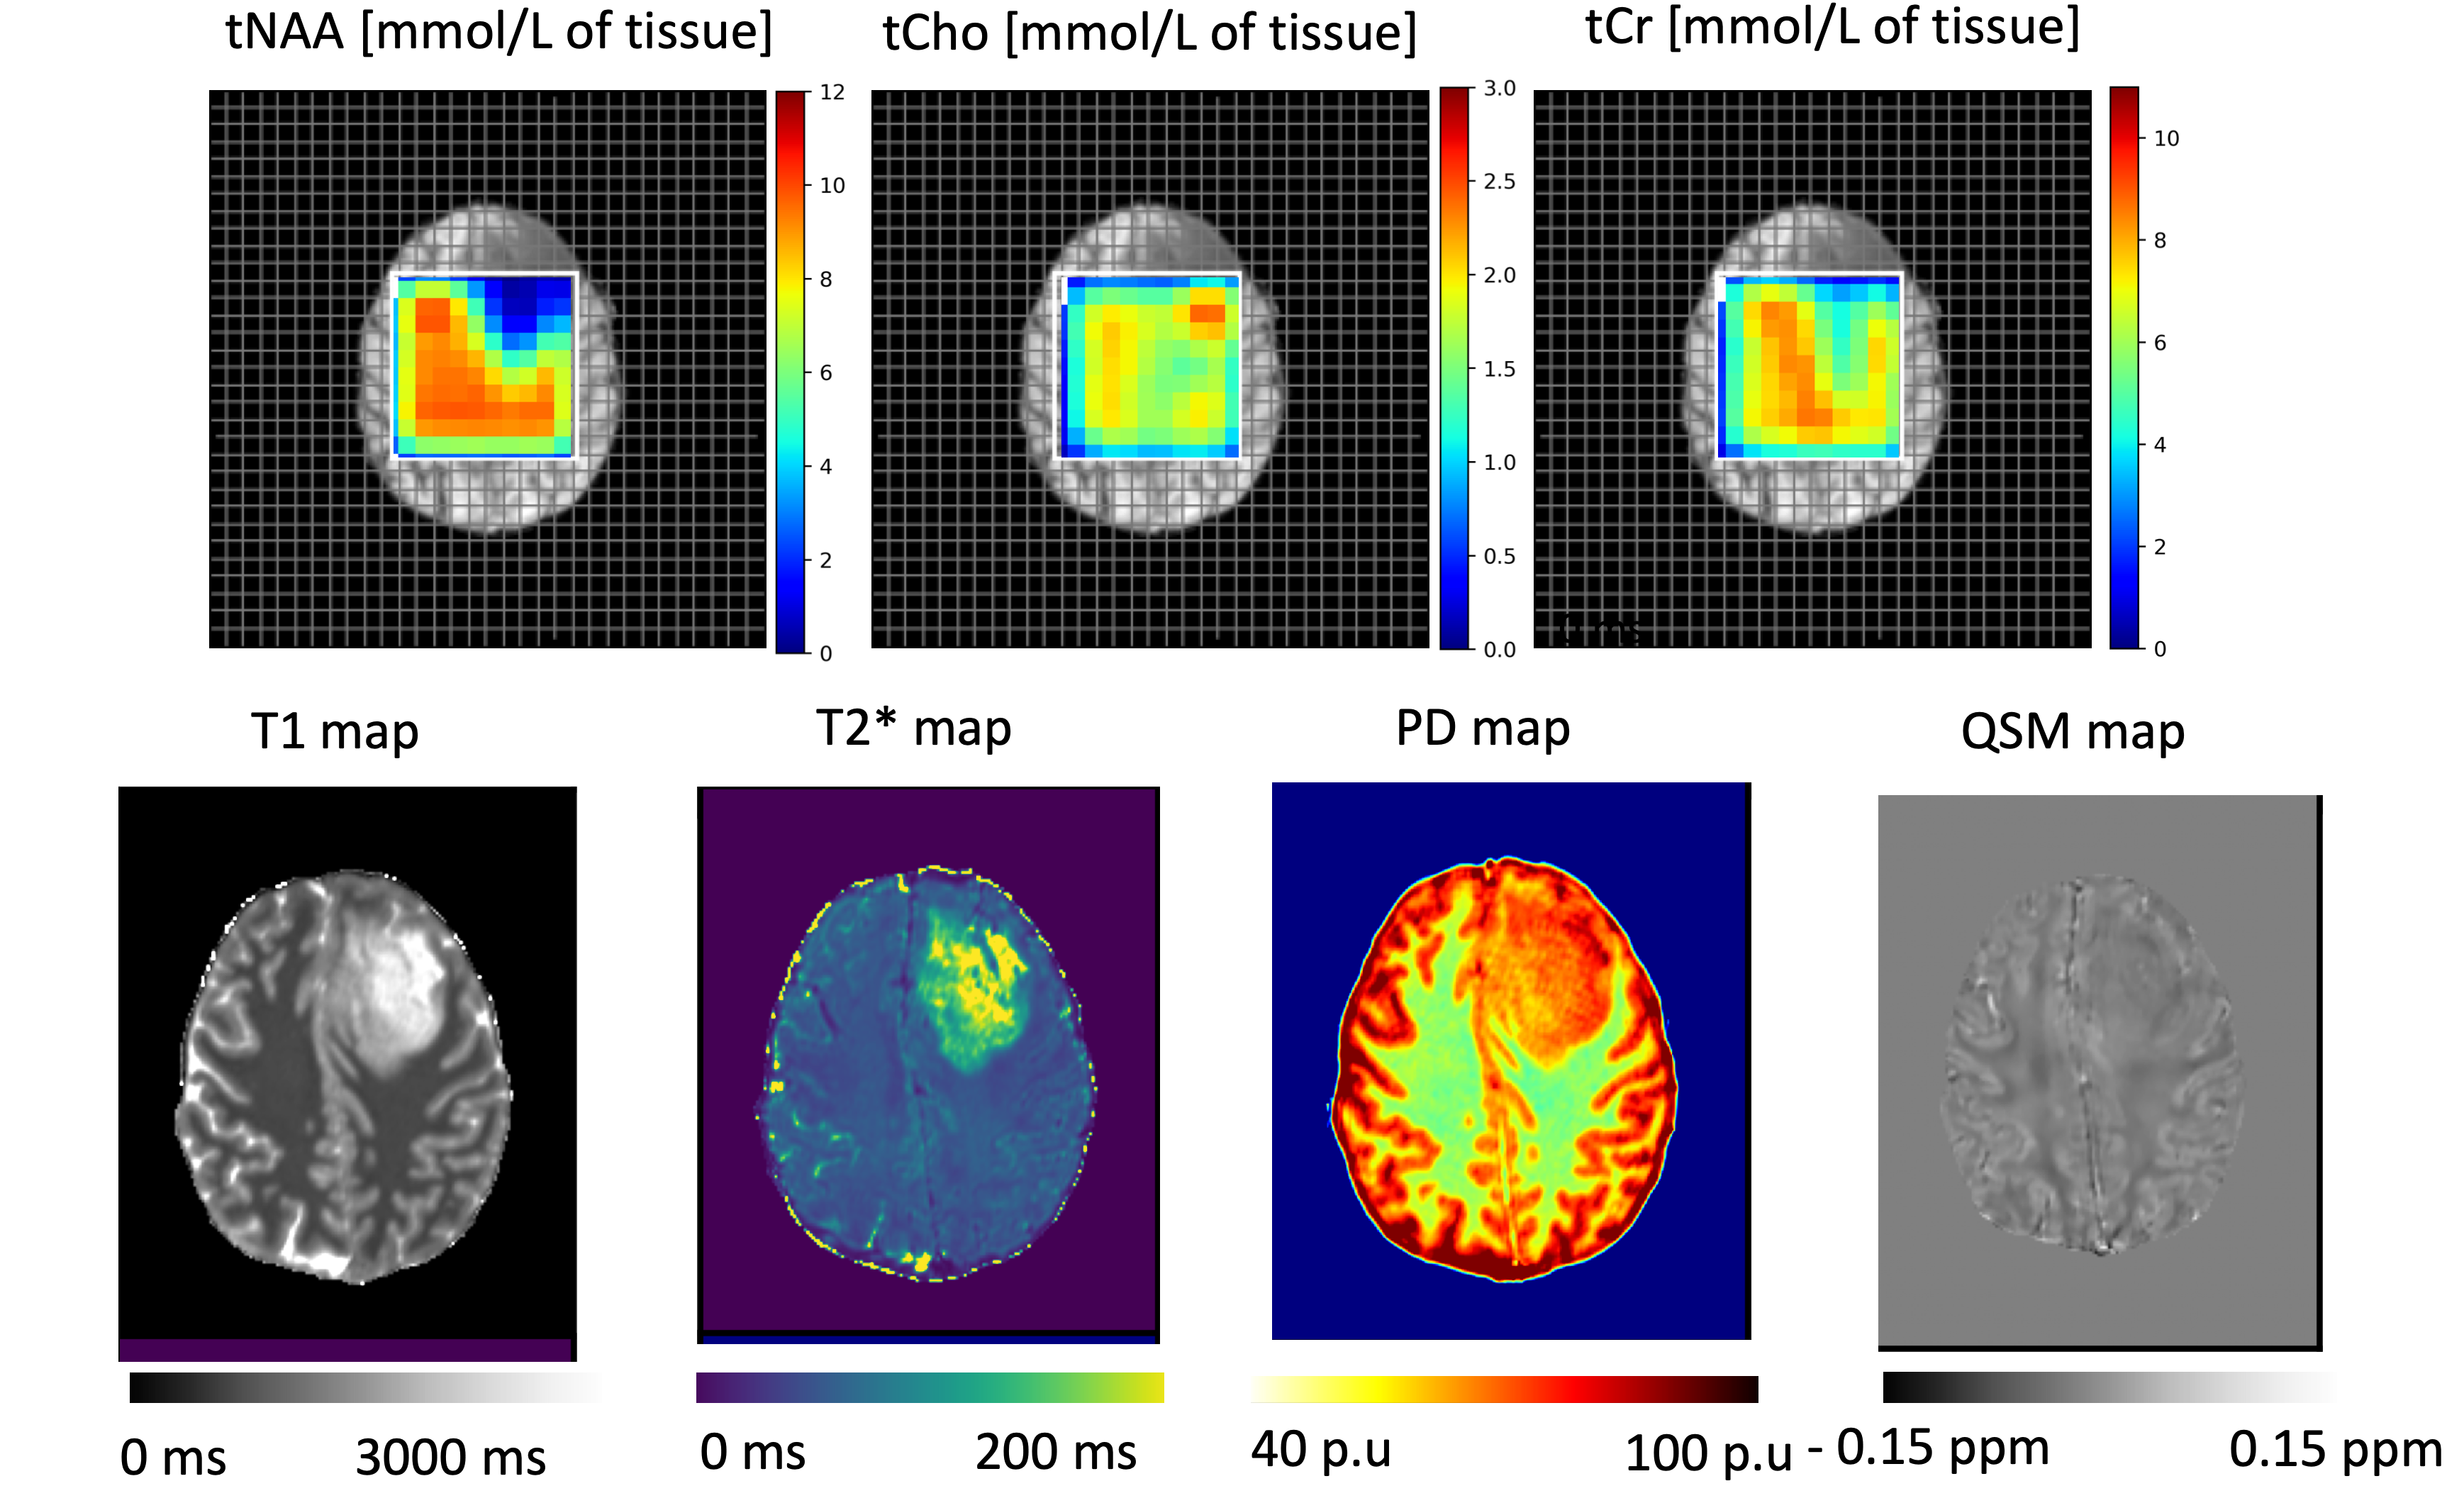
Apart from voxels at the border of the MRSI matrix, there was a good visual agreement between the metabolite maps for total NAA (tNAA), total Choline(tNAA) and total Creatine(tCR) obtained using the proposed method and the reference method as seen in Fig 2 for the healthy volunteer. A quantitative comparison of WM and GM metabolite concentrations is shown in Table 2. The values obtained from both methods agree well with literature values10. The concentrations in mmol/l of tissue derived using PD maps are plotted in Fig 2 (last row). Fig 3 shows the proposed method’s application for a brain tumor patient, providing quantitative metabolite maps for total NAA (tNAA), total choline (tCho) and total creatine (tCr). As expected, tCho is increased in the tumor region while the other metabolites are decreased. The 2 high resolution qMRI maps (PD, T1) used for the proposed method as well as T2* and QSM (additional maps obtained from qMRI) are shown in Fig 3 (lower row).Discussion and Conclusions
We proposed a new method for absolute metabolite quantification in 1H MRSI and its preliminary validation in a healthy subject and a brain tumor patient. It replaces the time-consuming acquisition of an unsuppressed water dataset with a fast qMRI protocol and a single-voxel STEAM acquisition. Our method relies on the ability to transform a PD map into a relaxation corrected water reference image. Thus, with the proposed method, the water reference map is not weighted by T1, T2, or B1+ inhomogeneity both in the healthy tissues and in brain tumors and hence the quantification of the metabolites is more accurate. Additionally, our method provides maps for B1+ and B1- corrections and four qMRI maps for analysis and segmentation tasks. The proposed method would be highly beneficial in brain tumor studies, since the impact of water relaxation on calculated metabolite concentrations is eliminated and since qMRI data are also generated which have their own diagnostic value.Acknowledgements
The authors would like to thank Else Kröner-Fresenius-Stiftung (EKFS) for funding this work.References
1 M. H. Buonocore and R. J. Maddock, “Magnetic resonance spectroscopy of the brain: a review of physical principles and technical methods,” Reviews in the Neurosciences, vol. 26, no. 6, pp. 609–632, Dec. 2015, doi: 10.1515/revneuro-2015-0010.
2 B. D. Weinberg, M. Kuruva, H. Shim, and M. E. Mullins, “Clinical applications of magnetic resonance spectroscopy (MRS) in of brain tumors: from diagnosis to treatment,” Radiol Clin North Am, vol. 59, no. 3, pp. 349–362, May 2021, doi: 10.1016/j.rcl.2021.01.004.
3 A. Horská and P. B. Barker, “Imaging of Brain Tumors: MR Spectroscopy and Metabolic Imaging,” Neuroimaging Clin N Am, vol. 20, no. 3, pp. 293–310, Aug. 2010, doi: 10.1016/j.nic.2010.04.003.
4 F. Padelli et al., “In vivo brain MR spectroscopy in gliomas: clinical and pre-clinical chances,” Clin Transl Imaging, vol. 10, no. 5, pp. 495–515, Oct. 2022, doi: 10.1007/s40336-022-00502-y.
5 “Short echo time 1H‐MRSI of the human brain at 3T with minimal chemical shift displacement errors using adiabatic refocusing pulses - Scheenen - 2008 - Magnetic Resonance in Medicine - Wiley Online Library.” Accessed: Nov. 07, 2023. [Online]. Available: https://onlinelibrary.wiley.com/doi/10.1002/mrm.21302
6 J. F. A. Jansen, W. H. Backes, K. Nicolay, and M. E. Kooi, “1H MR Spectroscopy of the Brain: Absolute Quantification of Metabolites,” Radiology, vol. 240, no. 2, pp. 318–332, Aug. 2006, doi: 10.1148/radiol.2402050314.
7 J. Near et al., “Preprocessing, analysis and quantification in single-voxel magnetic resonance spectroscopy: experts’ consensus recommendations,” NMR in Biomedicine, vol. 34, no. 5, p. e4257, 2021, doi: 10.1002/nbm.4257.
8 S. Volz, U. Nöth, A. Rotarska-Jagiela, and R. Deichmann, “A fast B1-mapping method for the correction and normalization of magnetization transfer ratio maps at 3 T,” Neuroimage, vol. 49, no. 4, pp. 3015–3026, Feb. 2010, doi: 10.1016/j.neuroimage.2009.11.054.
9 V. Mlynárik, S. Gruber, and E. Moser, “Proton T (1) and T (2) relaxation times of human brain metabolites at 3 Tesla,” NMR Biomed, vol. 14, no. 5, pp. 325–331, Aug. 2001, doi: 10.1002/nbm.713.
10 J. Frahm, H. Bruhn, M. L. Gyngell, K. D. Merboldt, W. Hänicke, and R. Sauter, “Localized proton NMR spectroscopy in different regions of the human brain in vivo. Relaxation times and concentrations of cerebral metabolites,” Magnetic Resonance in Medicine, vol. 11, no. 1, pp. 47–63, 1989, doi: 10.1002/mrm.1910110105.
Figures