1828
Non-Water-Suppressed Semi-LASER Localization for MR Spectroscopy of the Human Skeletal Muscle at 3T1Advanced Imaging Research Center, UT Southwestern Medical Center, Dallas, TX, United States, 2Radiology, UT Southwestern Medical Center, Dallas, TX, United States
Synopsis
Keywords: Spectroscopy, Spectroscopy, Skeletal muscle, SVS, pulse sequence
Motivation: Due to the dependence on the type and orientation of the skeletal muscle, it is a challenge to perform 1H MRS to characterize the muscle features in this highly organized structure.
Goal(s): The aim of this work was to implement a non-water-suppressed semi-LASER (sLASER) sequence to characterize up- and downfield metabolites in human skeletal muscle in vivo at 3T.
Approach: This was achieved through optimizing the crusher scheme and phase cycling schemes in sLASER and combining it with metabolite cycled.
Results: High quality spectra were obtained from different muscle fibers of 8 healthy volunteers to characterize both up- and downfield metabolites.
Impact: We demonstrated the application of metabolite-cycled semi-LASER spectroscopy in human skeletal muscles at 3T. Up- and downfield parts of the spectrum were detected with high quality enabling the detection of important metabolites including carnosine providing unique insight into human physiology.
Introduction:
Proton (1H) MR spectroscopy (MRS) of skeletal muscle provides unique insight into human physiology complementing the information from 31P- and 13C-MRS1. Depending on the type and orientation of the muscle, 1H MRS spectra exhibit a mixture of features including residual dipolar couplings. 1H-MRS permits the assessment of several muscle metabolites in vivo, including carnosine, which has pathophysiological relevance in multiple diseases. It is visible in the downfield region of 1H spectra and its quantification are hindered due to the baseline distortion caused by the water sidebands2 observed in conventional MRS technique like PRESS. Conventional water suppression techniques may also attenuated these muscle metabolites complicating detection and quantification3. Further, PRESS technique with slice selection using standard RF pulses, suffers from a magnetic field strength-dependent chemical shift displacement (CSD) error, non-uniform refocusing, and spatially dependent magnetization transfer4. Semi-Localization through Adiabatic SElective Refocusing (sLASER) has been demonstrated to minimize these artifacts5-7. Here, we present a non-water-suppressed sLASER sequence to characterize up- and downfield metabolites in human skeletal muscle in vivo at 3T. This was achieved through optimizing the crusher and phase cycling schemes in sLASER and combine it with metabolite cycled (MC)7 to account for inhomogeneous transmit fields and minimizing CSD.Materials and Methods:
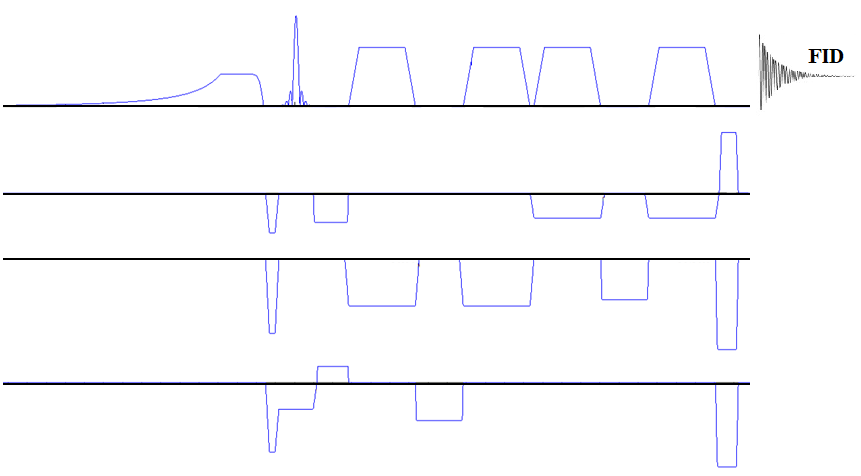
An asymmetric adiabatic inversion pulse optimized for MC7 at 3T was incorporated with a crusher scheme and 16-step phase cycling scheme optimized sLASER to study for both upfield and downfield metabolites (Figure 1). The characteristics of the inversion pulse for MC were: pulse duration=22.4 ms, frequency factor=2, and frequency offset=±200 Hz. The sequence was evaluated in the skeletal muscle of eight healthy volunteers (age, 20-30 years). Written informed consent was given by all subjects, and were approved by the institutional review board.All data were collected on a 3T Prisma MRI scanner (Siemens, Erlangen, Germany) using a home-built 2-channel 31P/1H calf coil with two interleaved birdcages8. Placement of the spectroscopy voxel was facilitated using a high-resolution 3D-MPRAGE scan9. The MC-sLASER acquisition parameters were: voxel size=8-3.375 cm3, TE=4 ms, TR=2 s, averages=64, 1024 spectral points, bandwidths=2000 Hz with scan time ~2.16 min. No OVS was applied. For comparisons, PRESS spectra were acquired with the same scan parameters with global water suppression performed using WET10 and TE=30 ms. For PRESS, a non-water-suppressed scan with one average was also recorded for eddy current correction and estimation of coil sensitivities. B0 shimming was done using FAST(EST)MAP11. Acquired data were extracted, reconstructed and post-processed7 with a library of custom MATLAB-based program. For calculation of the metabolites concentrations, the spectra were analyzed using LCModel12.
Results:
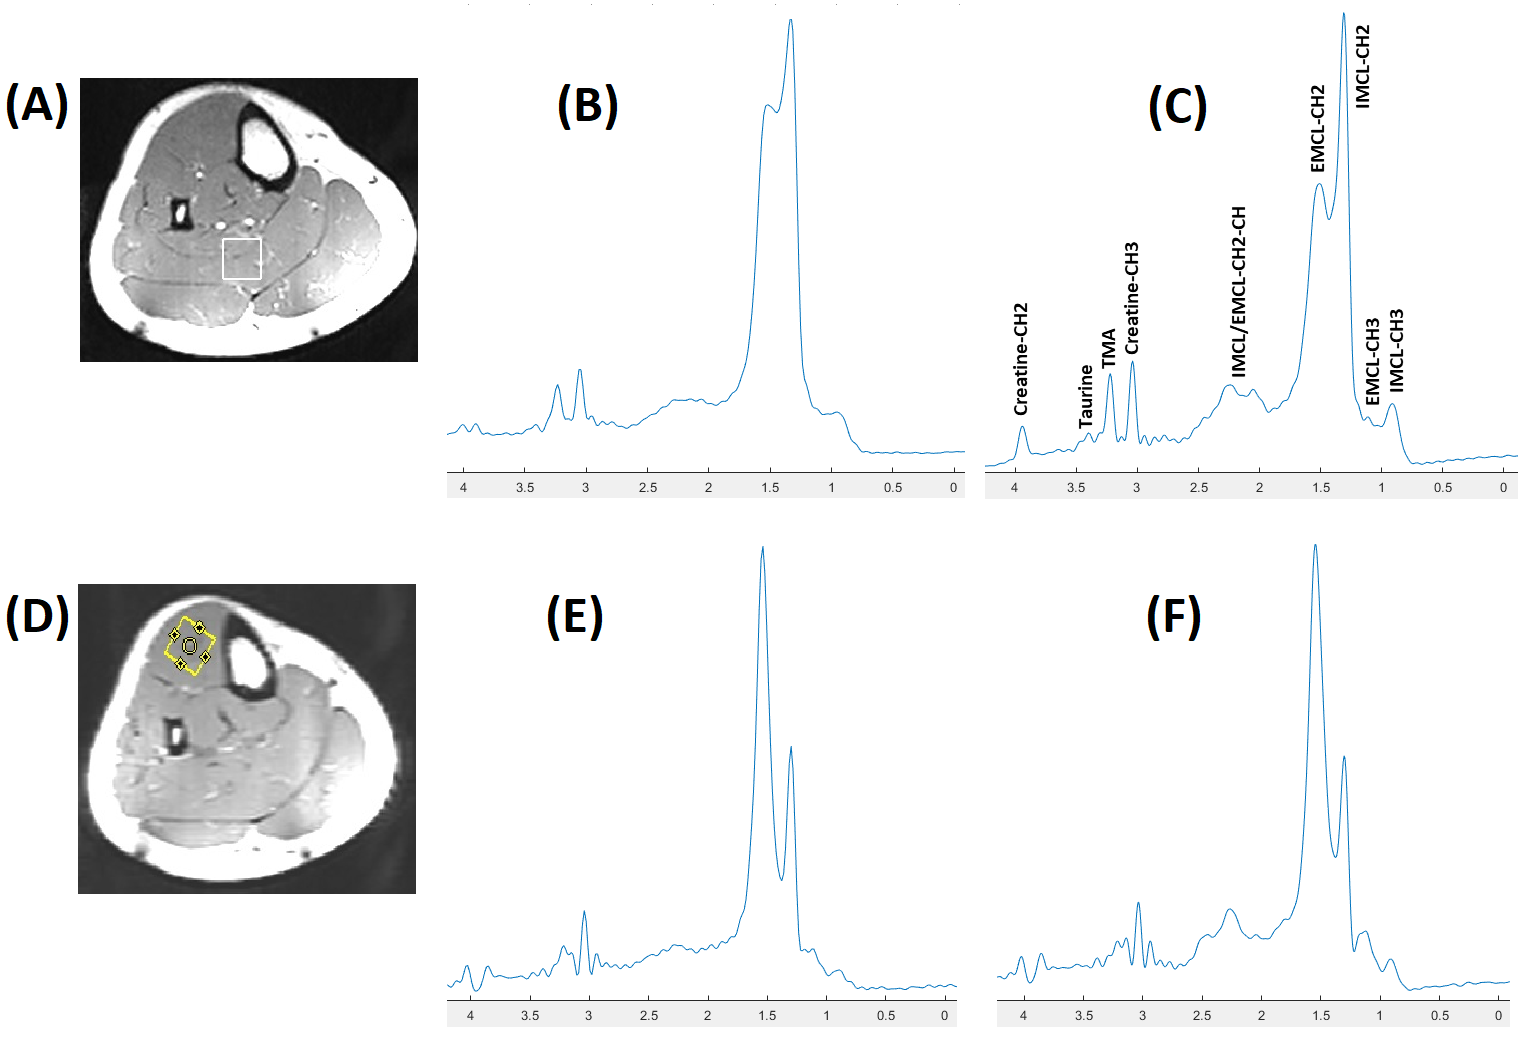
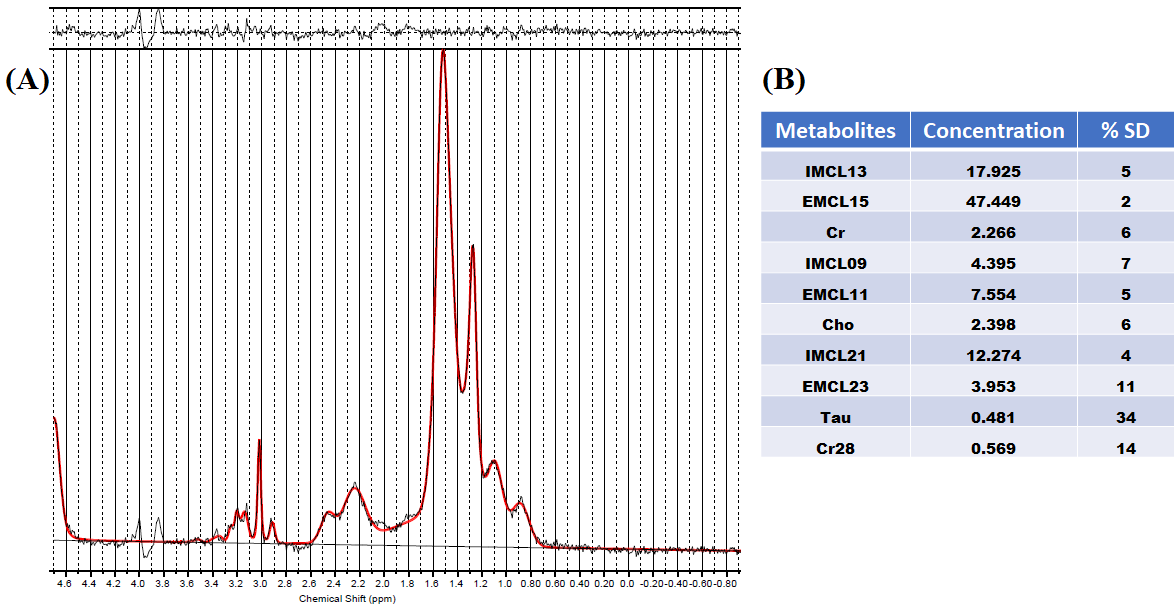
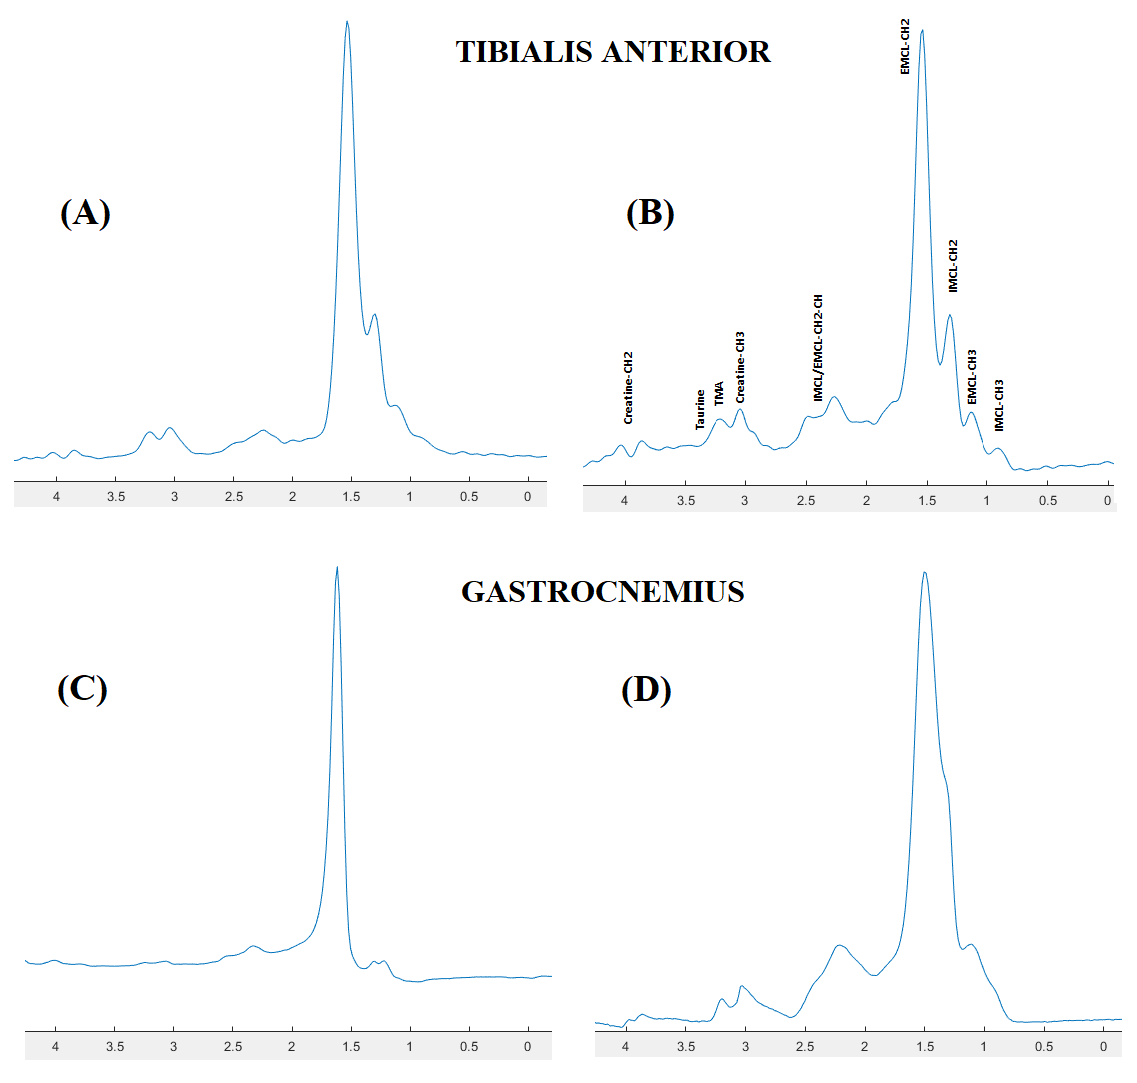
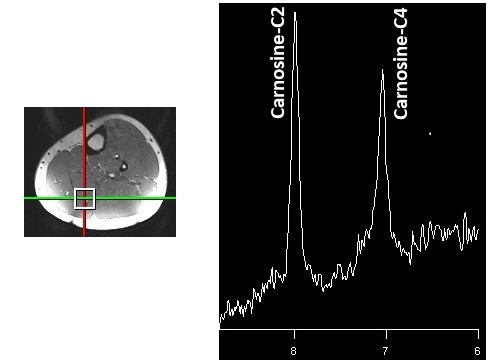
Spectra from the soleus and tibialis anterior voxel of a volunteer, as acquired with PRESS and MC-sLASER, are illustrated in Figure 2. Clear differences between the two sequences were observed regarding the shape of the peaks of Creatine-CH2, Taurine, TMA in soleus and IMCL/EMCL-CH3, IMCL/EMCL-CH2-CH in both soleus and tibialis anterior. The LCModel fit (Figure 3(A)) shows an almost flat baseline and a high-quality fit for MC-sLASER from the tibialis anterior of a healthy volunteer. Except for the Creatine-CH2 and taurine peak all other metabolites were quantified with SD less than 20% (Figure 3(B)). To test the robustness of mc-sLASER against experimental imperfections including B0 shim quality, additional spectra were acquired with automatic B0 shim mode (Figure 4). Despite inferior shimming mc-sLASER performed better then PRESS likely due to its lower chemical shift displacement. The downfield spectrum of a healthy volunteer acquired using mc-sLASER is demonstrated in Figure 5 showing successful detection of carnosine C2 and C4 resonances.Discussion:
In this study, an optimized MC-sLASER was introduced to measure metabolite content from human skeletal muscle at 3T. Using the MC-sLASER, both the upfield and downfield parts of the spectrum including resonances that exchange protons with water were detected with good quality. Compared to PRESS, MC-sLASER showed better muscle characteristics even with poor shimming. Although a bigger voxel is suggested1 for the detection of carnosine, we were able to observe it with MC-sLASER even with a voxel size of 3.375cm3. The SNR benefit of MC-sLASER is inherent7 in comparison to PRESS and is a suitable technique for skeletal muscle with its reduced CSD. Further, this technique can be used to study water magnetization transfer rates in human skeletal muscle3 which can yield insights into metabolite compartmentation.Conclusion:
In conclusion, this study has demonstrated the application of metabolite cycled semi-LASER spectroscopy in human skeletal muscles at 3T. While these initial results are promising, further optimization and validation with a large pool of human subjects is needed. Future work will address absolute quantification of carnosine and other observed resonances.Acknowledgements
This work was performed in the Advance Imaging Research Center at University of Texas Southwestern Medical center Dallas. This work was supported by Cancer Prevention and Research Institute of Texas (CPRIT) grant / RR180056.References
- Krššák M, Lindeboom L, Schrauwen-Hinderling V, et al. Proton magnetic resonance spectroscopy in skeletal muscle: Experts' consensus recommendations. NMR Biomed. 2021;34(5):e4266.
- Lievens E, Van Vossel K, Van de Casteele F, et al. CORP: quantification of human skeletal muscle carnosine concentration by proton magnetic resonance spectroscopy. J Appl Physiol. 2021;131(1):250-264.
- MacMillan EL, Boesch C, Kreis R. Magnetization exchange observed in human skeletal muscle by non-water-suppressed proton magnetic resonance spectroscopy. Magn Reson Med. 2013;70(4):916-924.
- Scheenen TWJ, Klomp DWJ, Wijnen JP, Heerschap A. Short echo time 1H-MRSI of the human brain at 3T with minimal chemical shift displacement errors using adiabatic refocusing pulses. Magn Reson Med. 2008;59(1):1–6.
- Slotboom J, Bovee WMMJ. Adiabatic slice-selective RF pulses and a single-shot adiabatic localization pulse sequence. Concepts Magn Reson. 1995;7:193-217.
- Landheer K, Gajdošík M, Juchem C. A semi-LASER, single-voxel spectroscopic sequence with a minimal echo time of 20.1 ms in the human brain at 3 T. NMR Biomed. 2020;33(9):e4324.
- Giapitzakis IA, Shao T, Avdievich N, et al. Metabolite-cycled STEAM and semi-LASER localization for MR spectroscopy of the human brain at 9.4T. Magn Reson Med. 2018;79(4):1841-1850.
- Zhang B, Lowrance D, Zaha D, et al. 3 Tesla 31P/1H Calf Muscle Coil for 1H and 31P MRI / MRS integrated with NIRS. Proc. Intl Soc Mag Reson Med. 2023; 31, 1062.
- Mugler JP 3rd, Brookeman JR. Three-dimensional magnetizationprepared rapid gradient-echo imaging (3D MP RAGE). Magn Reson Med. 1990;15:152–157.
- Ogg RJ, Kingsley PB, Taylor JS. WET, a T1- and B1-insensitive water-suppression method for in vivo localized 1H NMR spectroscopy. J Magn Reson B 1994;104(1):1–10.
- Gruetter R. Automatic, localized in vivo adjustment of all first- and second-order shim coils. Magn Reson Med. 1993;29(6):804-811.
- Provencher SW. Automatic quantitation of localized in vivo 1H spectra with LCModel. NMR Biomed 2001;14:260–264.
Figures