1826
Metabolic imaging at 14.1T in the rat brain: preliminary results for PRESS-MRSI vs FID-MRSI1Centre d'Imagerie Biomedical - CIBM, Lausanne, Switzerland, 2Animal Imaging and Technology, EPFL, Lausanne, Switzerland
Synopsis
Keywords: Spectroscopy, Spectroscopy, MRSI, UHF, PRESS, FID
Motivation: Valuable in the preclinical realm, Magnetic Resonance Spectroscopic Imaging encounters issues with long acquisition time and low signal-to-noise ratio. Numerous excitation schemes allow for metabolic mapping.
Goal(s): The current study aims at comparing, with relevant quality metrics, preclinical application of two 1H-MRSI localization schemes at 14.1T: FID-MRSI and PRESS-MRSI.
Approach: Both FID and PRESS-MRSI datasets were acquired on the rodent brain in identical conditions (n=3) and processed using the same workflow for objective analysis.
Results: An increased coverage and SNR per unit of time were observed for FID-MRSI. Both methods reached similar quantitative results for two different brain regions.
Impact: Objective assessment of preclinical 1H-FID and 1H-PRESS-MRSI allows for exploration of their respective limitations and optimization of both localization schemes for different case studies found in preclinical research.
Introduction
Metabolic imaging via MR spectroscopic imaging (MRSI) is extremely valuable in clinical and preclinical applications1,2. Its routine application remains challenging due to long acquisition times, low signal-to-noise ratio (SNR), development of in-house acquisition sequences and processing pipelines. Enormous advancements have been made in clinical applications regarding the spatial coverage, spatial resolution, acquisition speed, artifact suppression, number of detectable metabolites2. In this context, FID-MRSI minimizes the T2 relaxation and eliminates J-evolution, increasing SNR in a considerably short acquisition time. It also reduces chemical shift displacement errors and sensitivity to B0 inhomogeneity.To the best of our knowledge, at the present time, traditional phase encoded MRSI using STEAM, PRESS or SPECIAL excitation schemes (TEs between 2-10ms), is still used for quantitative metabolite mapping for 1H preclinical applications3–6. Recently, 1H-FID-MRSI has been implemented on preclinical scanners providing robust, reproducible and high-quality metabolic maps with significantly reduced technical limitations and time7,8.
The aim of the present study was to compare side by side PRESS-MRSI with FID-MRSI in preclinical settings at 14.1T in the rat brain.
Methods
All data were acquired in the rat brain at 14.1T (Bruker/Magnex Scientific) using a homemade transmit/receive quadrature surface coil. T2-weighted Turbo-RARE images (slices=60, thk=0.2mm, TR=3000ms, NA=10, RAREfactor=6, 128x128) were acquired in coronal direction to position the MRSI slice. MAPSHIM was used, first in an ellipsoid covering the full brain, then in a voxel of 10x10x2mm3 centered on the MRSI slice (water linewidths=25-29Hz). Single slice 1H-FID-MRSI (TR=811ms, 52° flip angle, acquisition delay=1.3ms, acquisition time of 13min) and PRESS-MRSI (TR=2000ms, 90/180/180°, TE=10.2ms, acquisition time of 32min, TR was fixed for reasonable acquisition time) measurements were performed in identical conditions on 3 rats (2mm slice centered on the hippocampus, FOV=24x24mm2, matrix=31x31, nominal voxel size=0.77x0.77x2mm3, 1024 spectral points, cartesian k-space sampling). VAPOR water suppression9 and saturation slabs or outer volume suppression (OVS) were used to minimize the lipid contamination in FID-MRSI and PRESS-MRSI, respectively.All data were processed with the MRS4Brain toolbox (in-house developed end-to-end processing pipeline with a graphical user interface for Bruker 1H-FID-MRSI7). Identical processing steps were used for both sequences, except for the retrospective skull lipids removal using the metabolite-lipid spectral orthogonality approach10 which was not used for PRESS-MRSI due to OVS presence.
LCModel was used combined with acquisition specific metabolites basis-sets (simulated using NMRScope-B/jMRUI11) and in vivo acquired macromolecules (double inversion-recovery) under identical in vivo conditions as metabolites. tCr was used as a reference for both sequences. Semi-automatic quality control steps as displayed in Figure 1 were used. The atlas-based segmentation from MRS4Brain toolbox was used for voxel selection in two brain regions using coronal MRI acquisitions: hippocampus and a mix of striatum and cortex.
Results and Discussion
Figure 1 displays the quality control steps as provided by MRS4Brain toolbox. As can be seen on the water power maps, for the same shimmed volume (10x10x2mm3) FID-MRSI provided an increased brain coverage. The linewidth and ∆B0 maps showed similar variations, while the SNR per unit time map highlighted ~40% increase for FID-MRSI acquisitions. Overall the quality of the spectra in the middle of the excited VOI was similar for both sequences with an increased SNR for FID-MRSI as shown in Figure 2, in line with the increased SNR per unit of time.Figure 3 highlights the metabolite maps of three representative metabolites out of eight quantified. FID-MRSI maps showed an increased brain coverage even after the application of quality control criteria (min. SNR, max. FWHM, max. CRLBs limits). Some differences in metabolite concentrations were noted between the two sequences (Figures 3&4&5) which might be related to the lack of metabolite T1 and T2 corrections, macromolecules or fitting issues, something requiring further investigations together with the retrospective efficiency of lipid suppression. Despite these differences Figures 4 and 5 show good agreement in metabolite concentration estimates when averaging over 3 rats in striatum and hippocampus, respectively. For PRESS-MRSI a decreased SNR towards the border of the maps was observed leading to the overestimation of some metabolites (i.e. NAA+NAAG).
Conclusion
Both sequences provided robust, reproducible and high-quality metabolic mapping of brain metabolites. Furthermore, our results highlighted an increased brain coverage combined with a significant reduction in the acquisition time when using 1H-FID-MRSI. Some differences in metabolite concentration were also observed between the two sequences, requiring further investigations.Acknowledgements
We acknowledge access to the facilities and expertise of the CIBM Center for Biomedical Imaging founded and supported by Lausanne University Hospital (CHUV), University of Lausanne (UNIL), Ecole polytechnique fédérale de Lausanne (EPFL), University of Geneva (UNIGE) and Geneva University Hospitals (HUG). Financial support was provided by the Swiss National Science Foundation (Project No. 310030_201218).
References
(1) Maudsley, A. A.; Andronesi, O. C.; Barker, P. B.; Bizzi, A.; Bogner, W.; Henning, A.; Nelson, S. J.; Posse, S.; Shungu, D. C.; Soher, B. J. Advanced Magnetic Resonance Spectroscopic Neuroimaging: Experts’ Consensus Recommendations. NMR in Biomedicine 2021, 34 (5). https://doi.org/10.1002/nbm.4309.
(2) Bogner, W.; Otazo, R.; Henning, A. Accelerated MR Spectroscopic Imaging—a Review of Current and Emerging Techniques. NMR in Biomedicine 2021, 34 (5). https://doi.org/10.1002/nbm.4314.
(3) Geppert, C.; Dreher, W.; Leibfritz, D. PRESS-Based Proton Single-Voxel Spectroscopy and Spectroscopic Imaging with Very Short Echo Times Using Asymmetric RF Pulses. MAGMA 2003, 16 (3), 144–148. https://doi.org/10.1007/s10334-003-0016-6.
(4) Delgado-Goñi, T.; Ortega-Martorell, S.; Ciezka, M.; Olier, I.; Candiota, A. P.; Julià-Sapé, M.; Fernández, F.; Pumarola, M.; Lisboa, P. J.; Arús, C. MRSI-Based Molecular Imaging of Therapy Response to Temozolomide in Preclinical Glioblastoma Using Source Analysis. NMR in Biomedicine 2016, 29 (6), 732–743. https://doi.org/10.1002/nbm.3521.
(5) Cudalbu, C. In Vivo Studies of Brain Metabolism in Animal Models of Hepatic Encephalopathy Using 1H Magnetic Resonance Spectroscopy. Metabolic Brain Disease 2013, 28 (2), 167–174. https://doi.org/10.1007/s11011-012-9368-9.
(6) Mlynarik, V.; Gambarota, G.; Kohler, I.; Gruetter, R. Short-TE Proton Spectroscopic Imaging of the Neurochemical Profile in the Rat Brain at 1 ?L Resolution. Proc. ISMRM 2007, 15, 1247.
(9) Tkac, I.; Starcuk, Z.; Choi, I. Y.; Gruetter, R. In Vivo H-1 NMR Spectroscopy of Rat Brain at 1 Ms Echo Time. Magn Reson Med 1999, 41 (4), 649–656. https://doi.org/Doi 10.1002/(Sici)1522-2594(199904)41:4<649::Aid-Mrm2>3.0.Co;2-G.
(10) Klauser, A.; Courvoisier, S.; Kasten, J.; Kocher, M.; Guerquin-Kern, M.; Ville, D. V. D.; Lazeyras, F. Fast High-Resolution Brain Metabolite Mapping on a Clinical 3T MRI by Accelerated 1H-FID-MRSI and Low-Rank Constrained Reconstruction. Magnetic Resonance in Medicine 2019, 81 (5), 2841–2857. https://doi.org/10.1002/mrm.27623.
(11) Starčuk, Z.; Starčuková, J. Quantum-Mechanical Simulations for in Vivo MR Spectroscopy: Principles and Possibilities Demonstrated with the Program NMRScopeB. Analytical Biochemistry 2017, 529, 79–97. https://doi.org/10.1016/j.ab.2016.10.007.
Figures
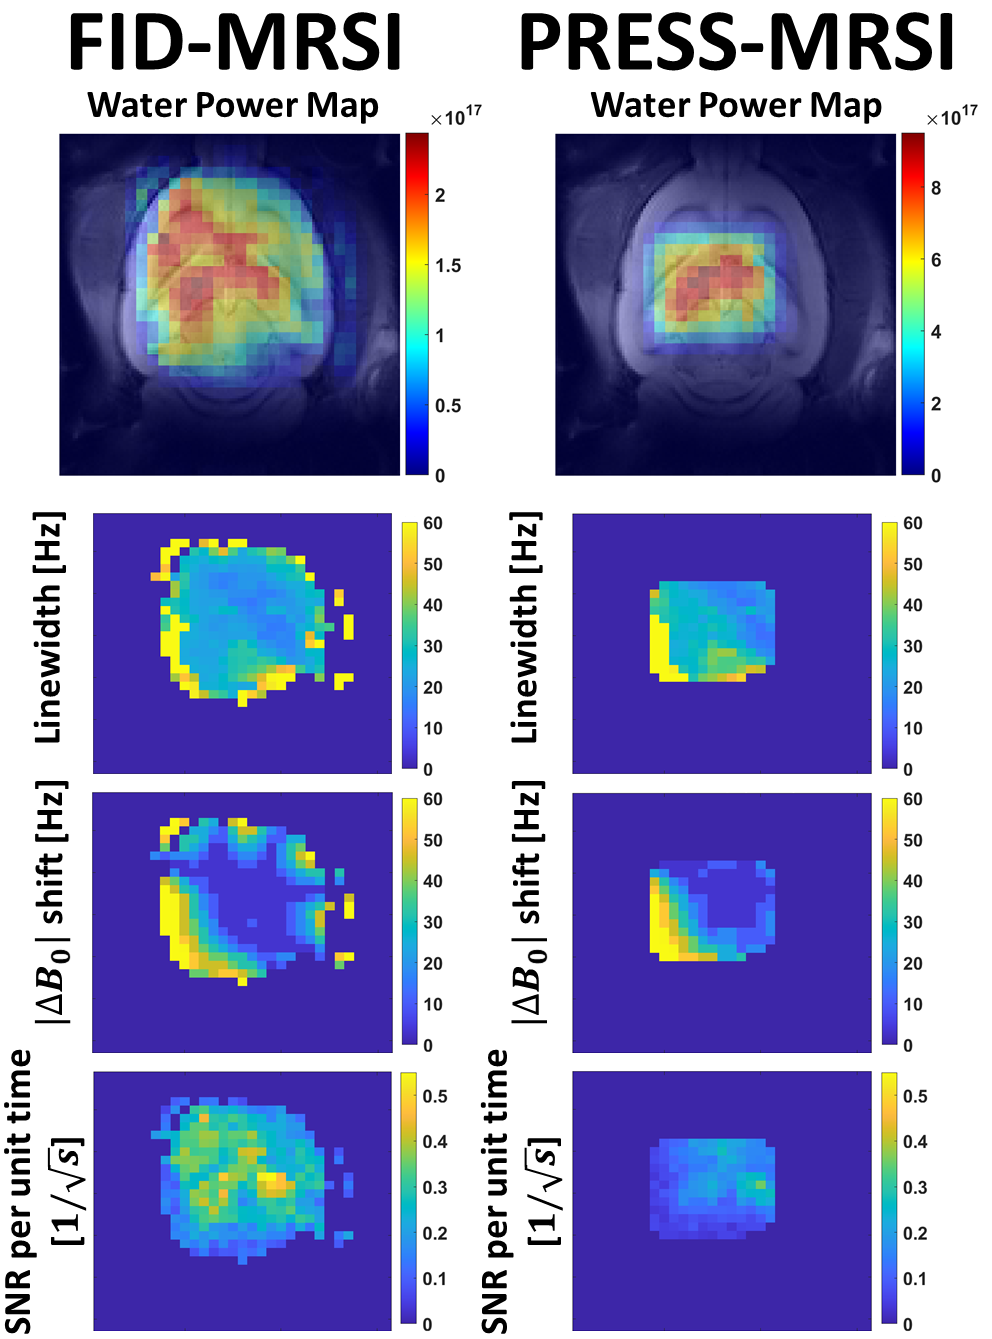
Figure 1: Representative quality control steps as provided by MRS4Brain toolbox for both acquisition sequences.
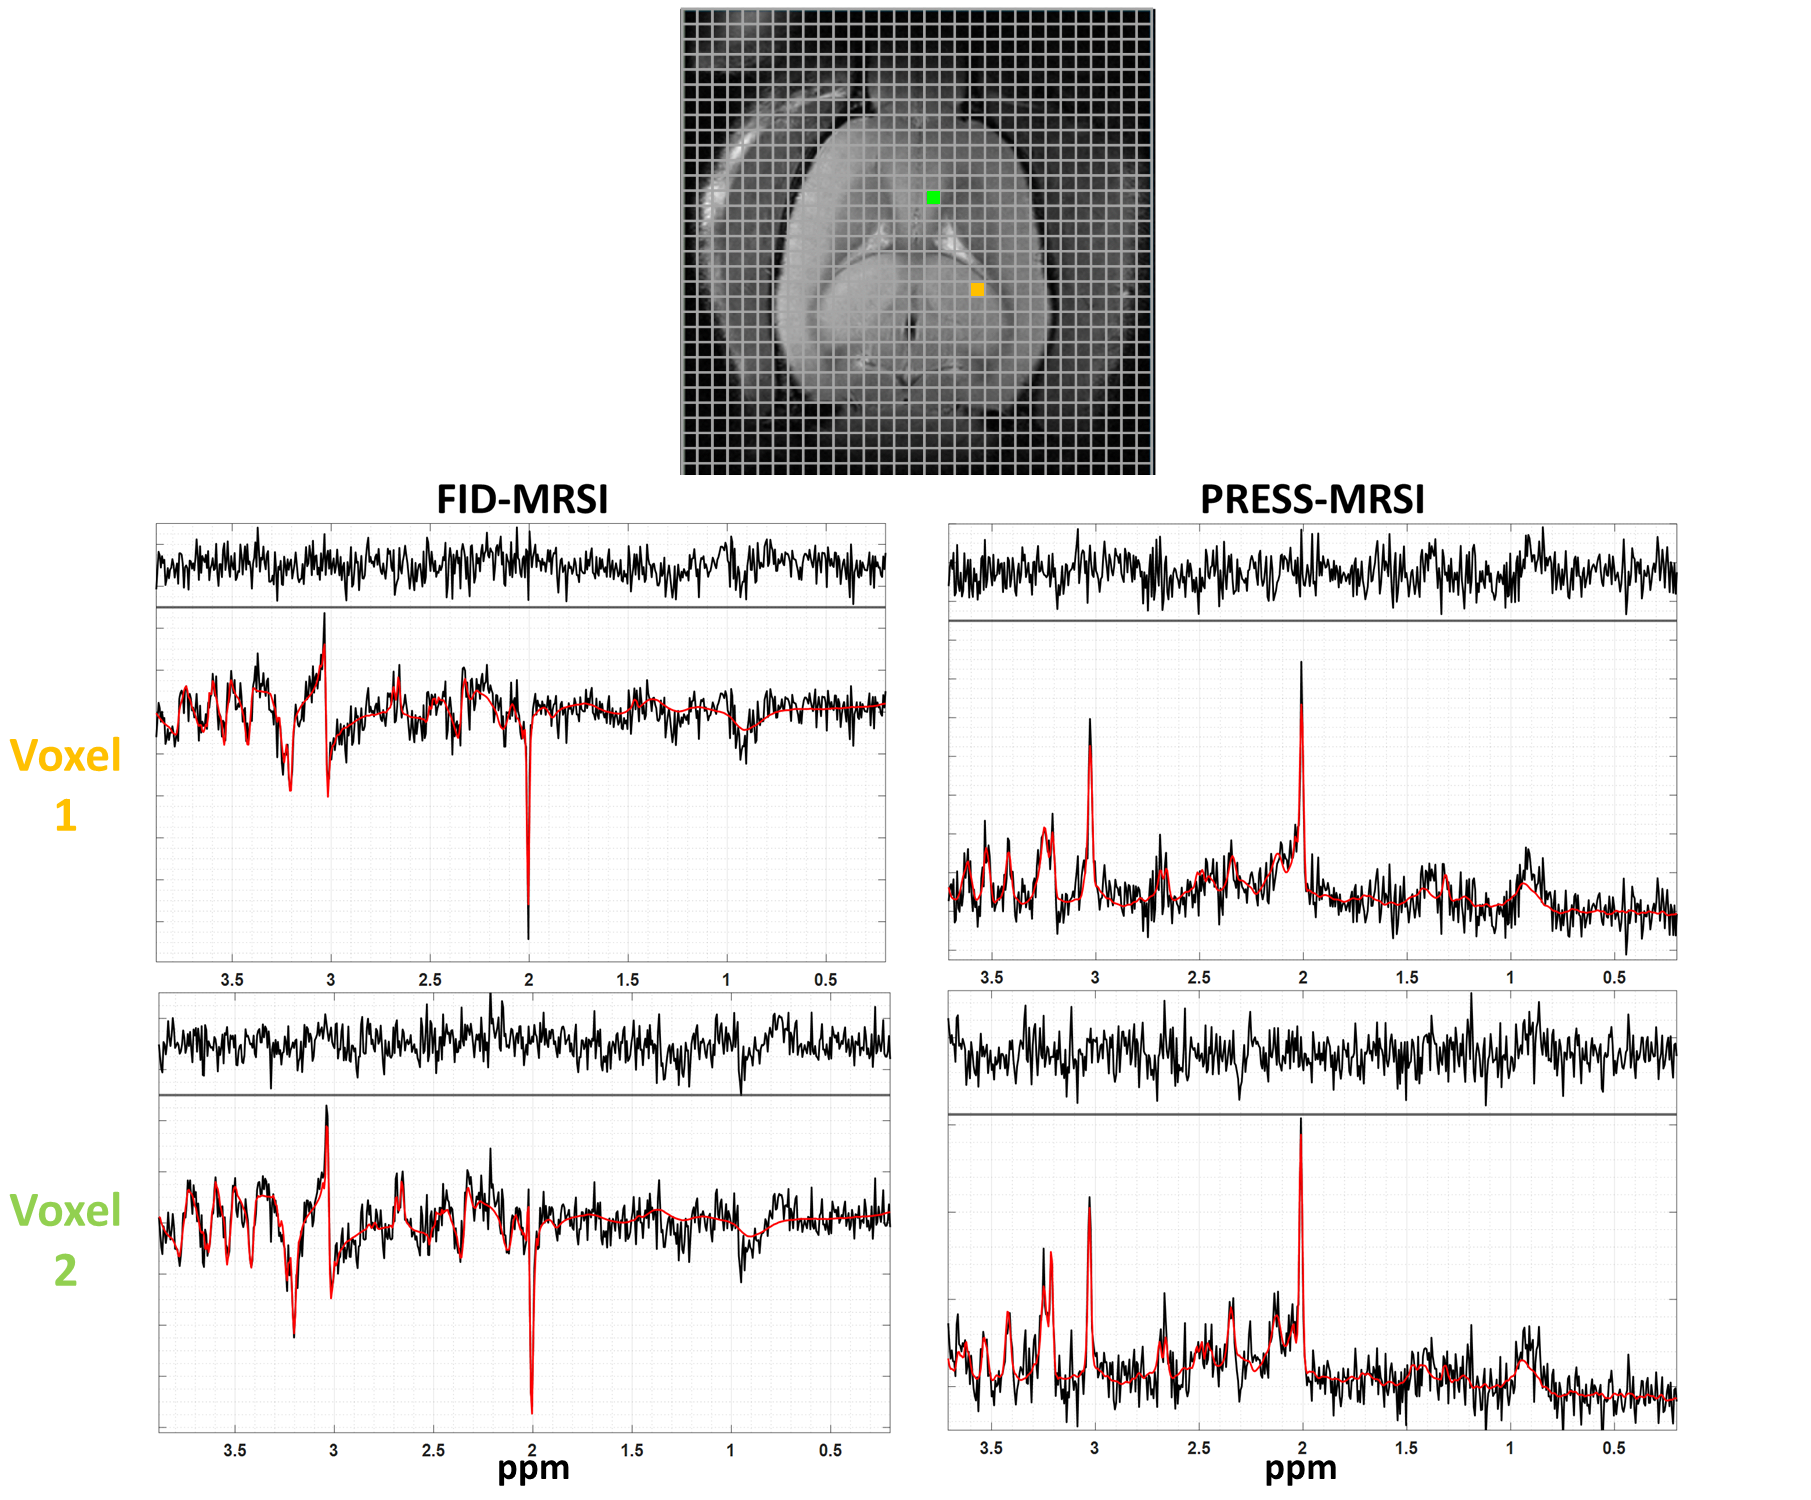
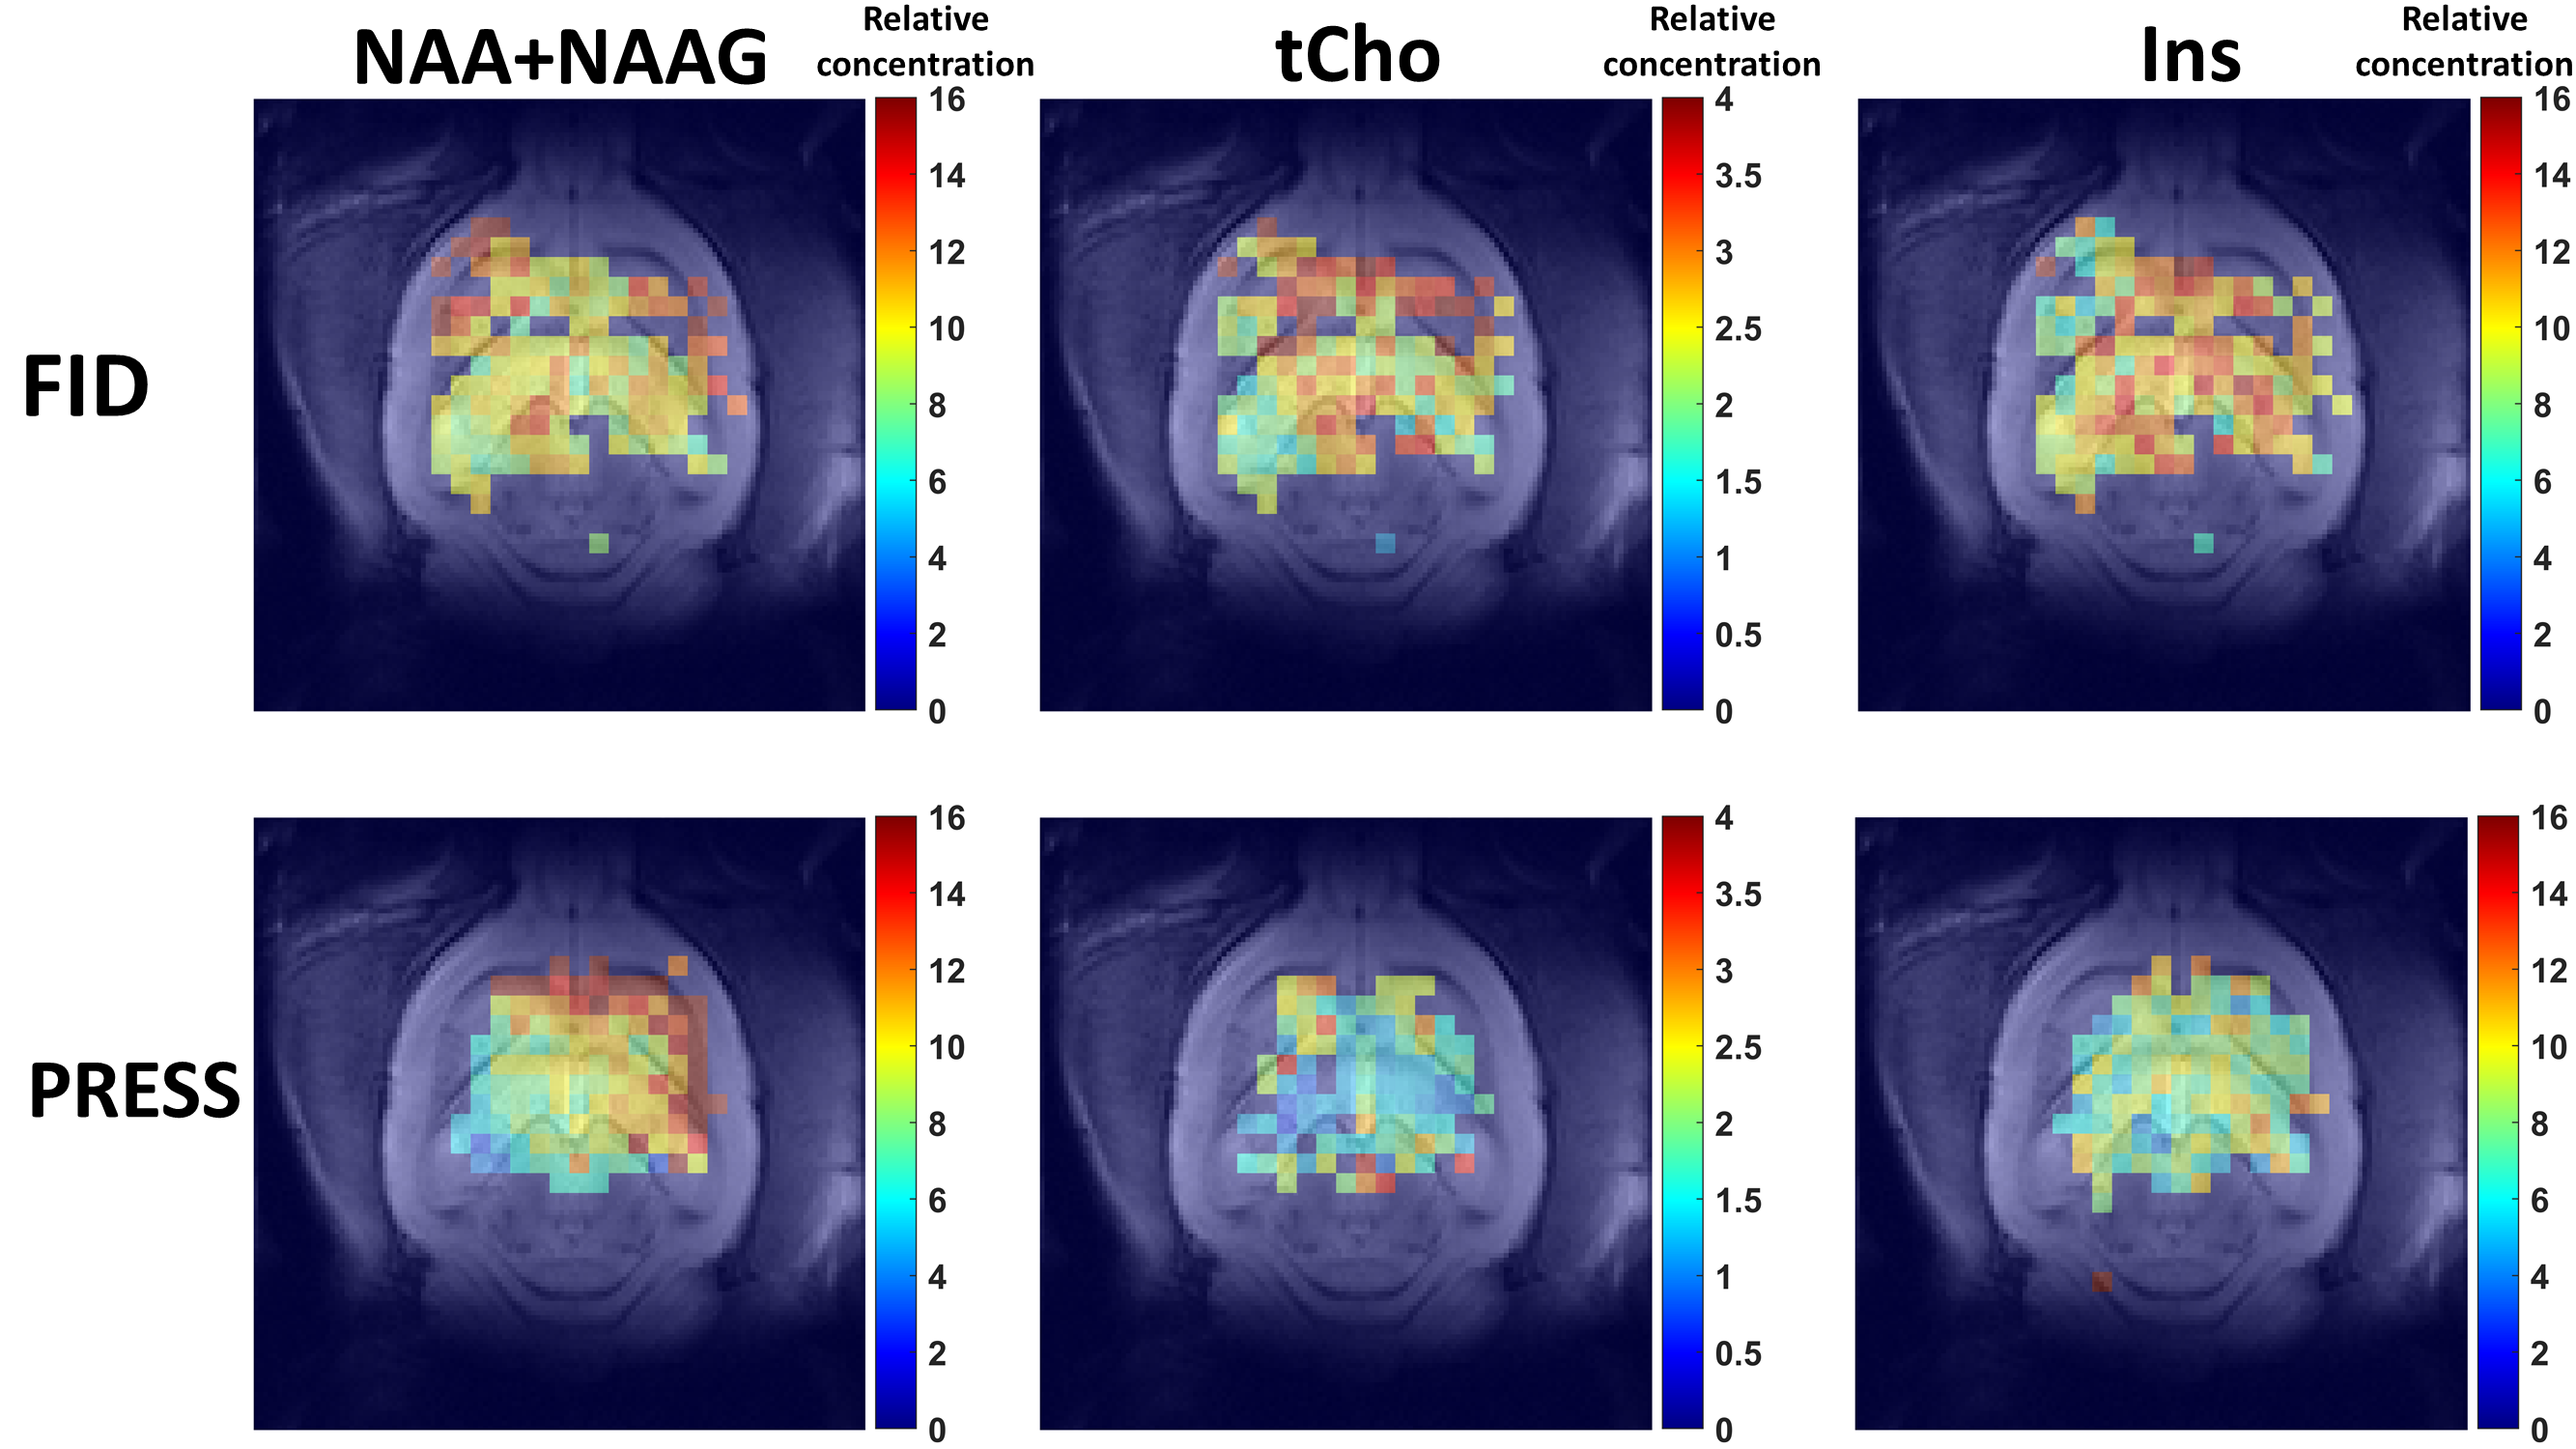
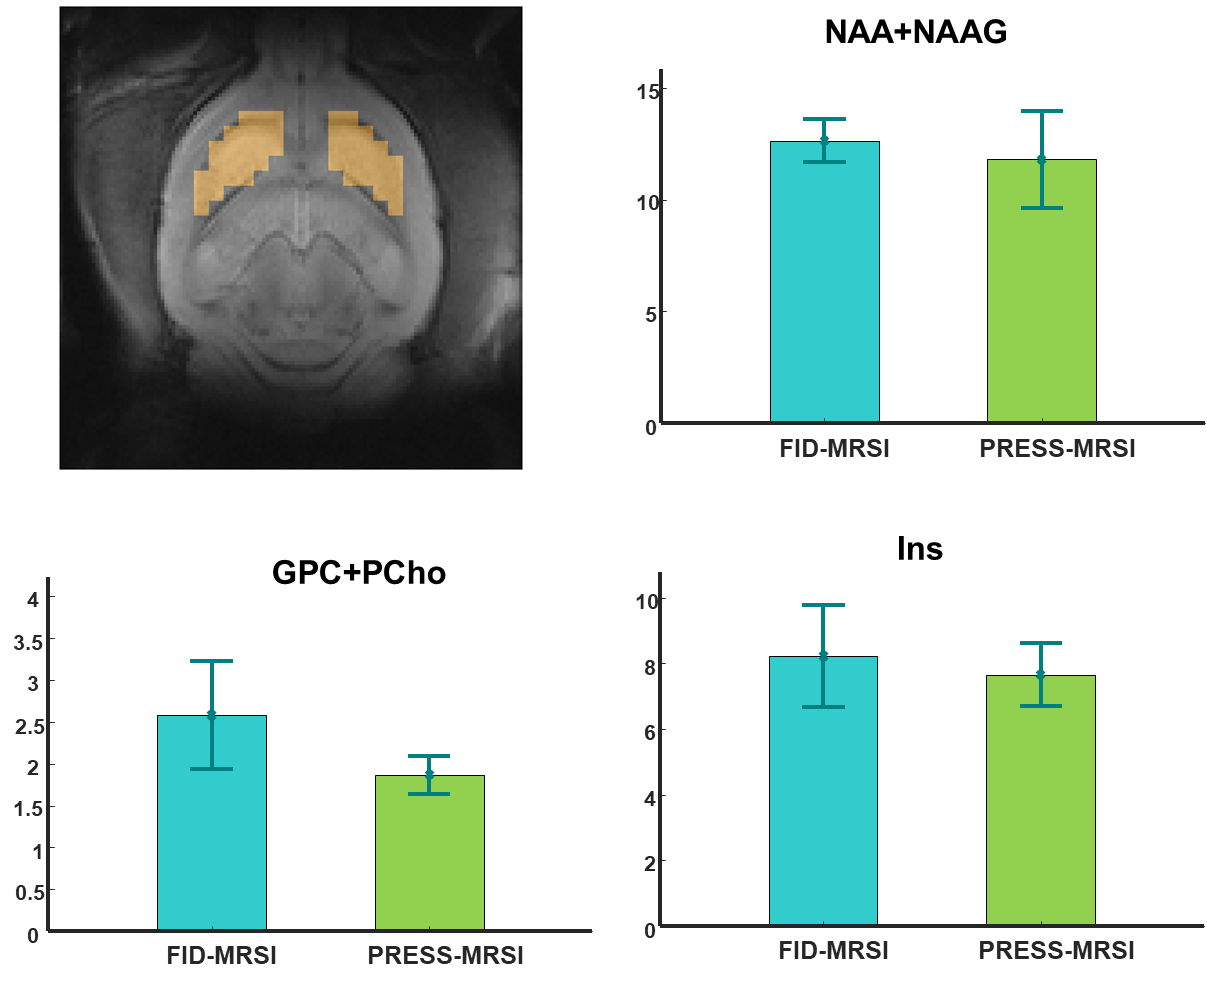
Figure 4: Relative Concentration estimates (mean and SD, 3 rats, /tCr) of three representative metabolites in the striatum using FID-MRSI and PRESS-MRSI. The overall selection mask derived from the segmentation for voxels selection in the striatum is displayed with the anatomical image.
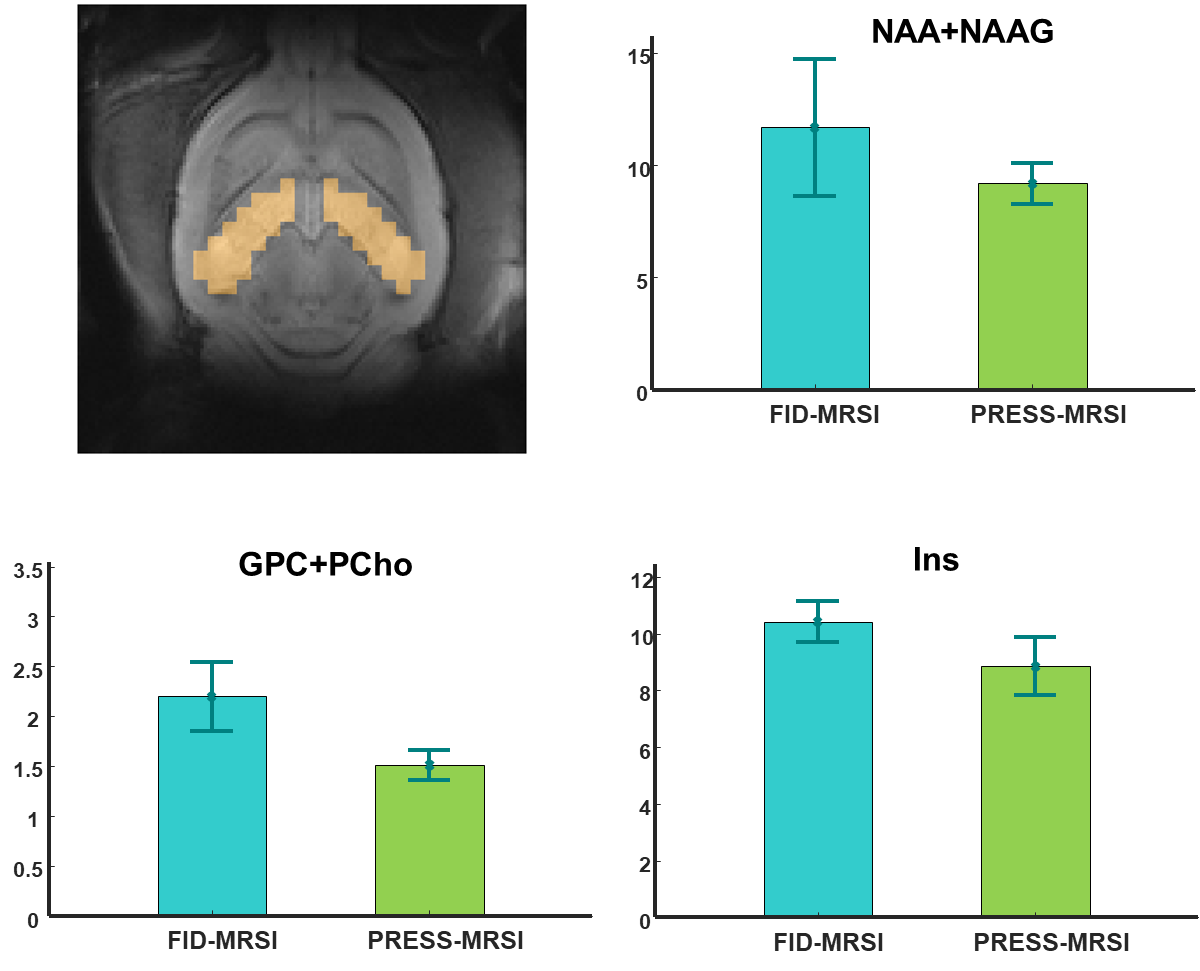
Figure 5: Relative Concentration estimates (mean and SD, 3 rats, /tCr) of three representative metabolites in the hippocampus using FID-MRSI and PRESS-MRSI. The overall selection mask derived from the segmentation for voxels selection in the hippocampus is displayed with the anatomical image.