1825
Investigating redox imbalance in first-episode schizophrenia using 7T functional MRS1Western University, London, ON, Canada, 2Dalhousie University, Halifax, NS, Canada, 3McGill University, Montreal, QC, Canada
Synopsis
Keywords: Spectroscopy, Molecular Imaging, functional MRS, schizophrenia, redox, glutathione
Motivation: Redox imbalance in schizophrenia may help to explain the full range of observable schizophrenia symptoms.
Goal(s): Our goal was to use a more appropriate tool to measure dynamic changes in neurometabolites in schizophrenia compared to traditional MRS techniques.
Approach: We used functional MRS with a cognitive Stroop task to investigate glutathione dynamics as well as associated glutamate and glutamine dynamics.
Results: Glutathione levels increased during task and stayed elevated for healthy subjects, but not for patients.
Impact: By demonstrating abnormal anterior cingulate cortex glutathione response to short-term cognitive battery in first-episode schizophrenia, we offer novel support and added framework behind potential redox imbalances in schizophrenia and their utility in managing symptom treatment.
Introduction
Redox imbalance has been implicated in contributing to observable schizophrenia symptoms. As the brain’s main antioxidant, glutathione is expected to mount a response to redox imbalances and oxidative stress. Previous studies suggest that higher baseline glutathione levels may be an indicator of faster symptom improvement in response to antipsychotic treatment1,2. However, traditional MRS techniques do not capture potential dynamic or regulatory behavior of neurometabolites, which may provide more accurate understandings of the molecular mechanisms behind schizophrenia symptoms. To this end, we propose the use of functional MRS (fMRS) to investigate potential antioxidant response abnormalities in response to short-term cognitive stress in the early stages of schizophrenia.Methods
We recruited 33 first-episode schizophrenia (FES) and 23 patient-matched healthy control (HC) volunteers to undergo proton fMRS (1H-fMRS) using a Siemens MAGENTOM head-only 7-Tesla MRI scanner (8-Tx/32-Rx RF coil). Using a long echo-time semi-LASER pulse sequence (TR = 7500ms, TE = 100ms, 128 averages), glutathione, glutamate, and glutamine concentrations were measured with a 2 x 2 x 2 cm3 voxel placed in the dorsolateral anterior cingulate cortex. The fMRS paradigm consisted of four blocks (baseline, task, recovery 1, recovery 2) with the color-word Strop task used as the cognitive task in the second block. All transient spectrum collected per block were phase- and frequency-corrected prior to averaging into a single spectrum to be used for further post-processing, spectral fitting, and quantification.Results
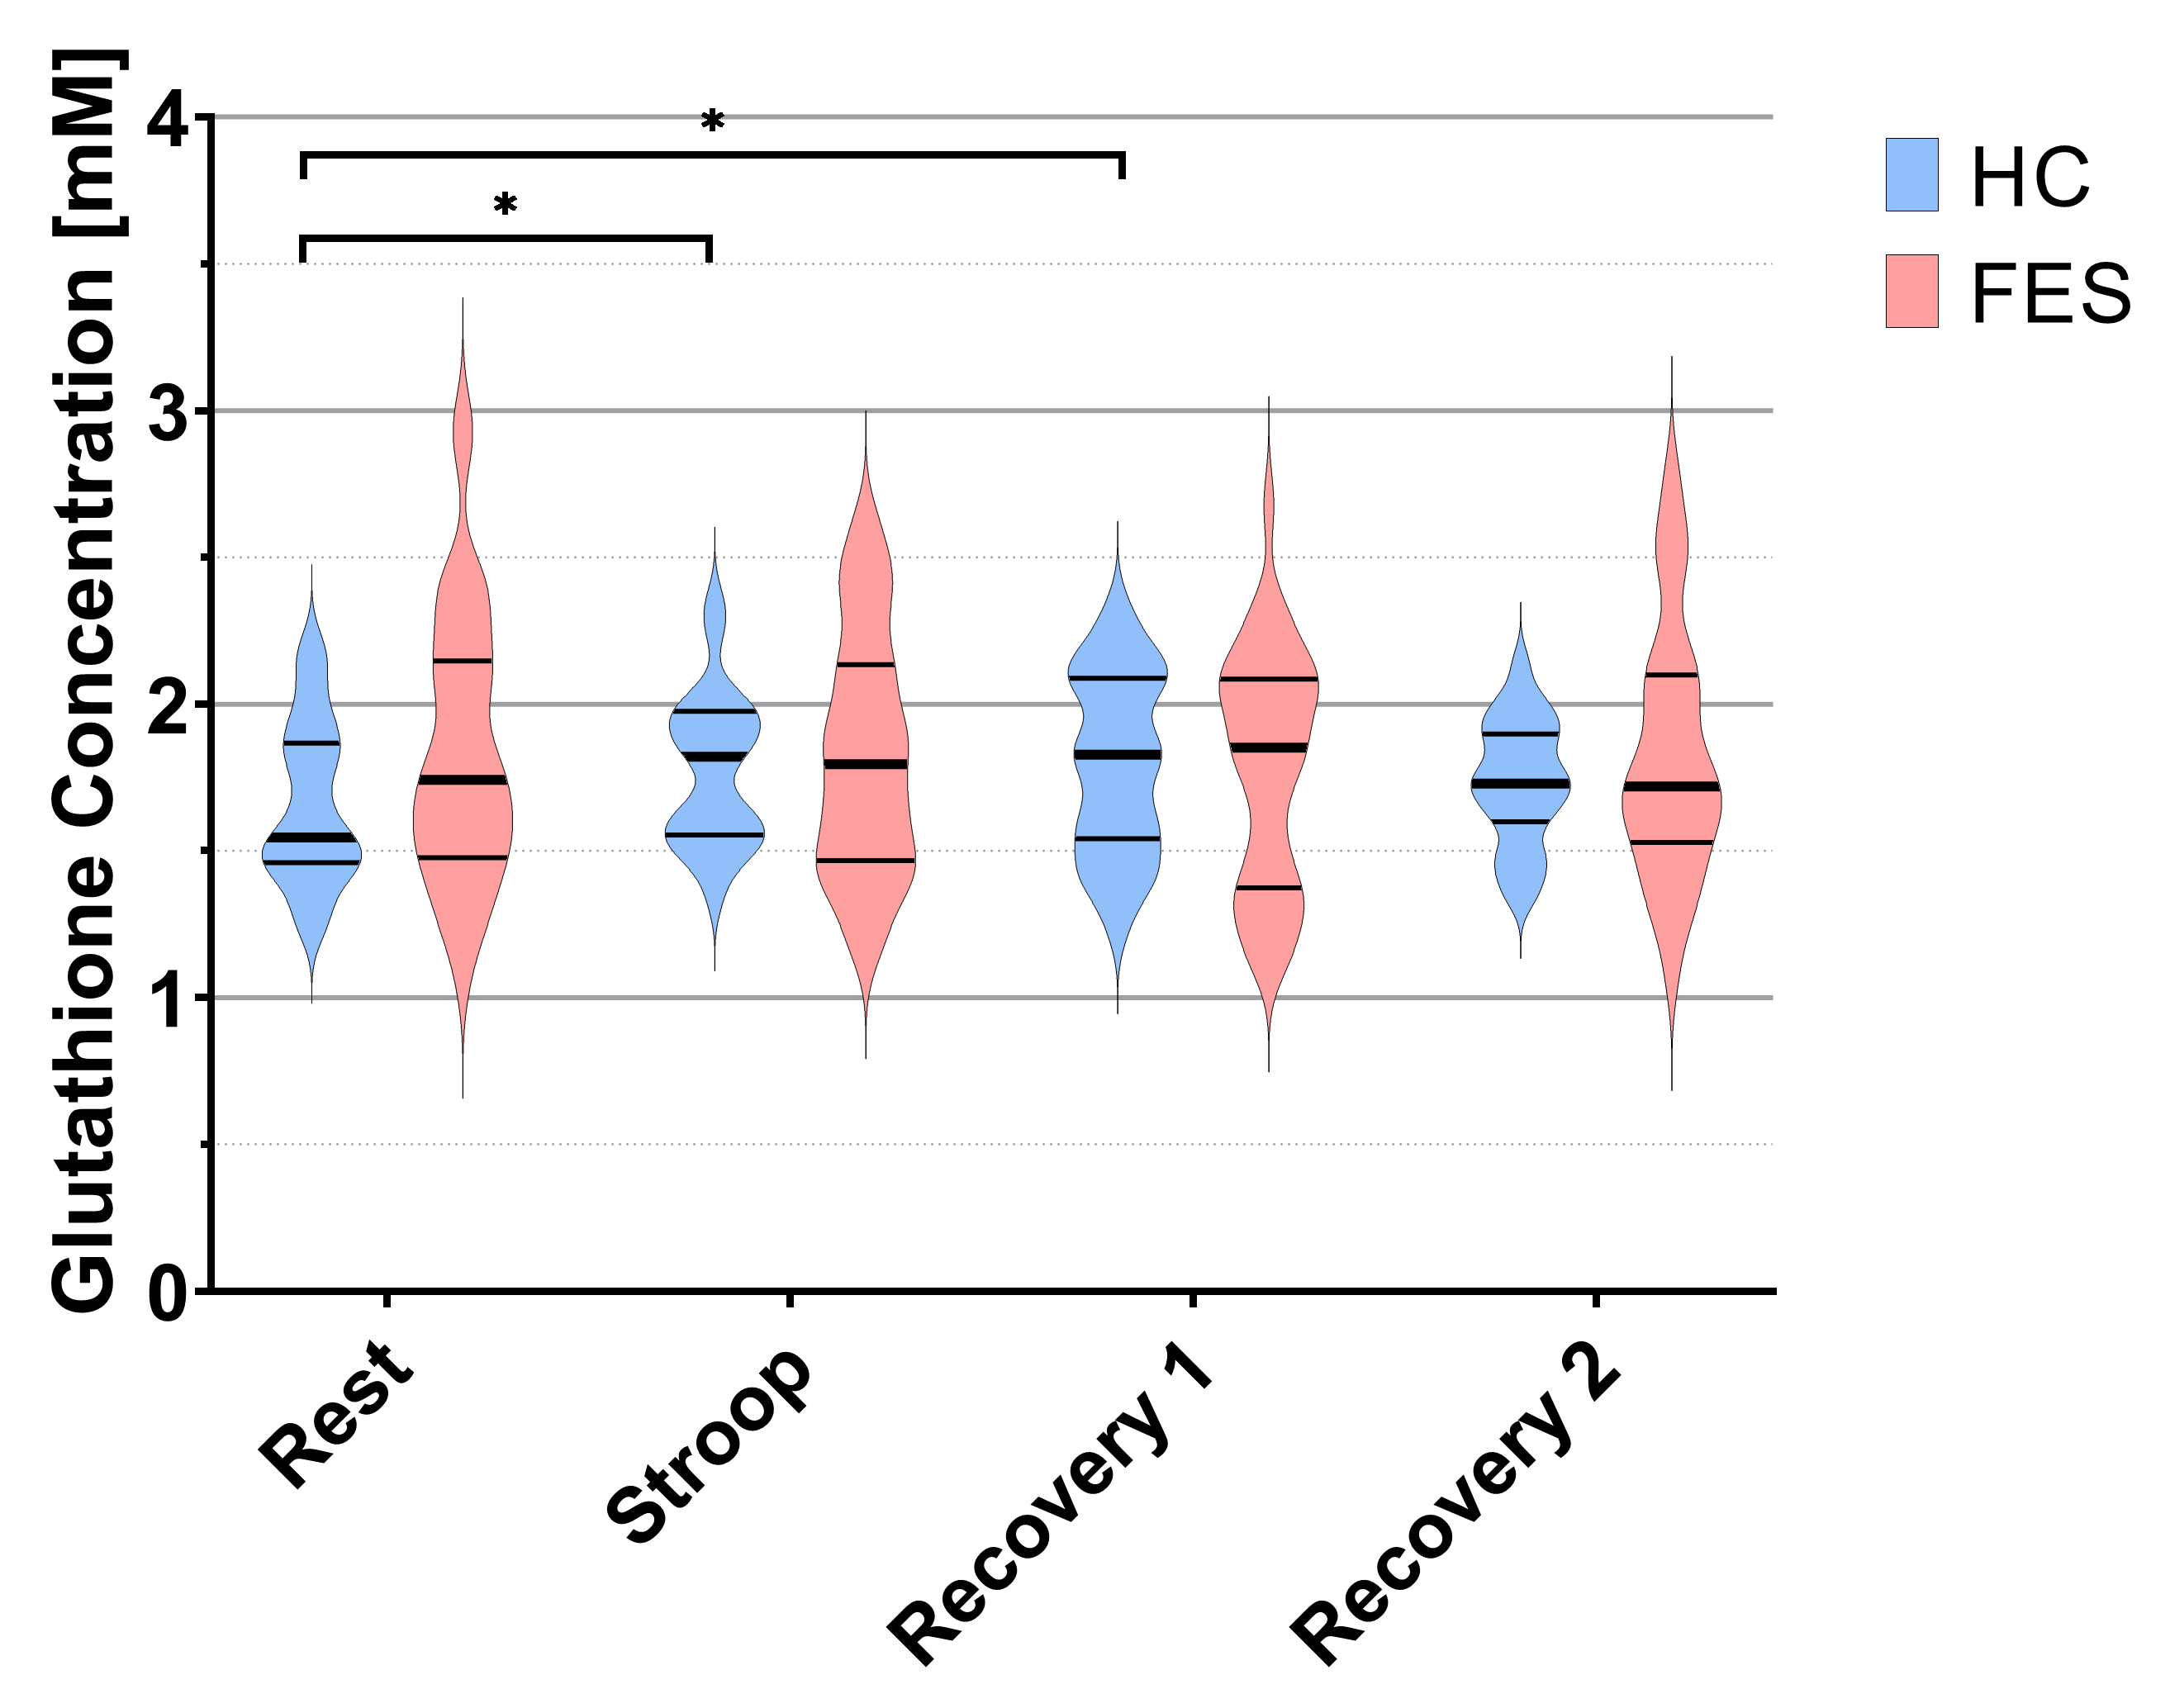
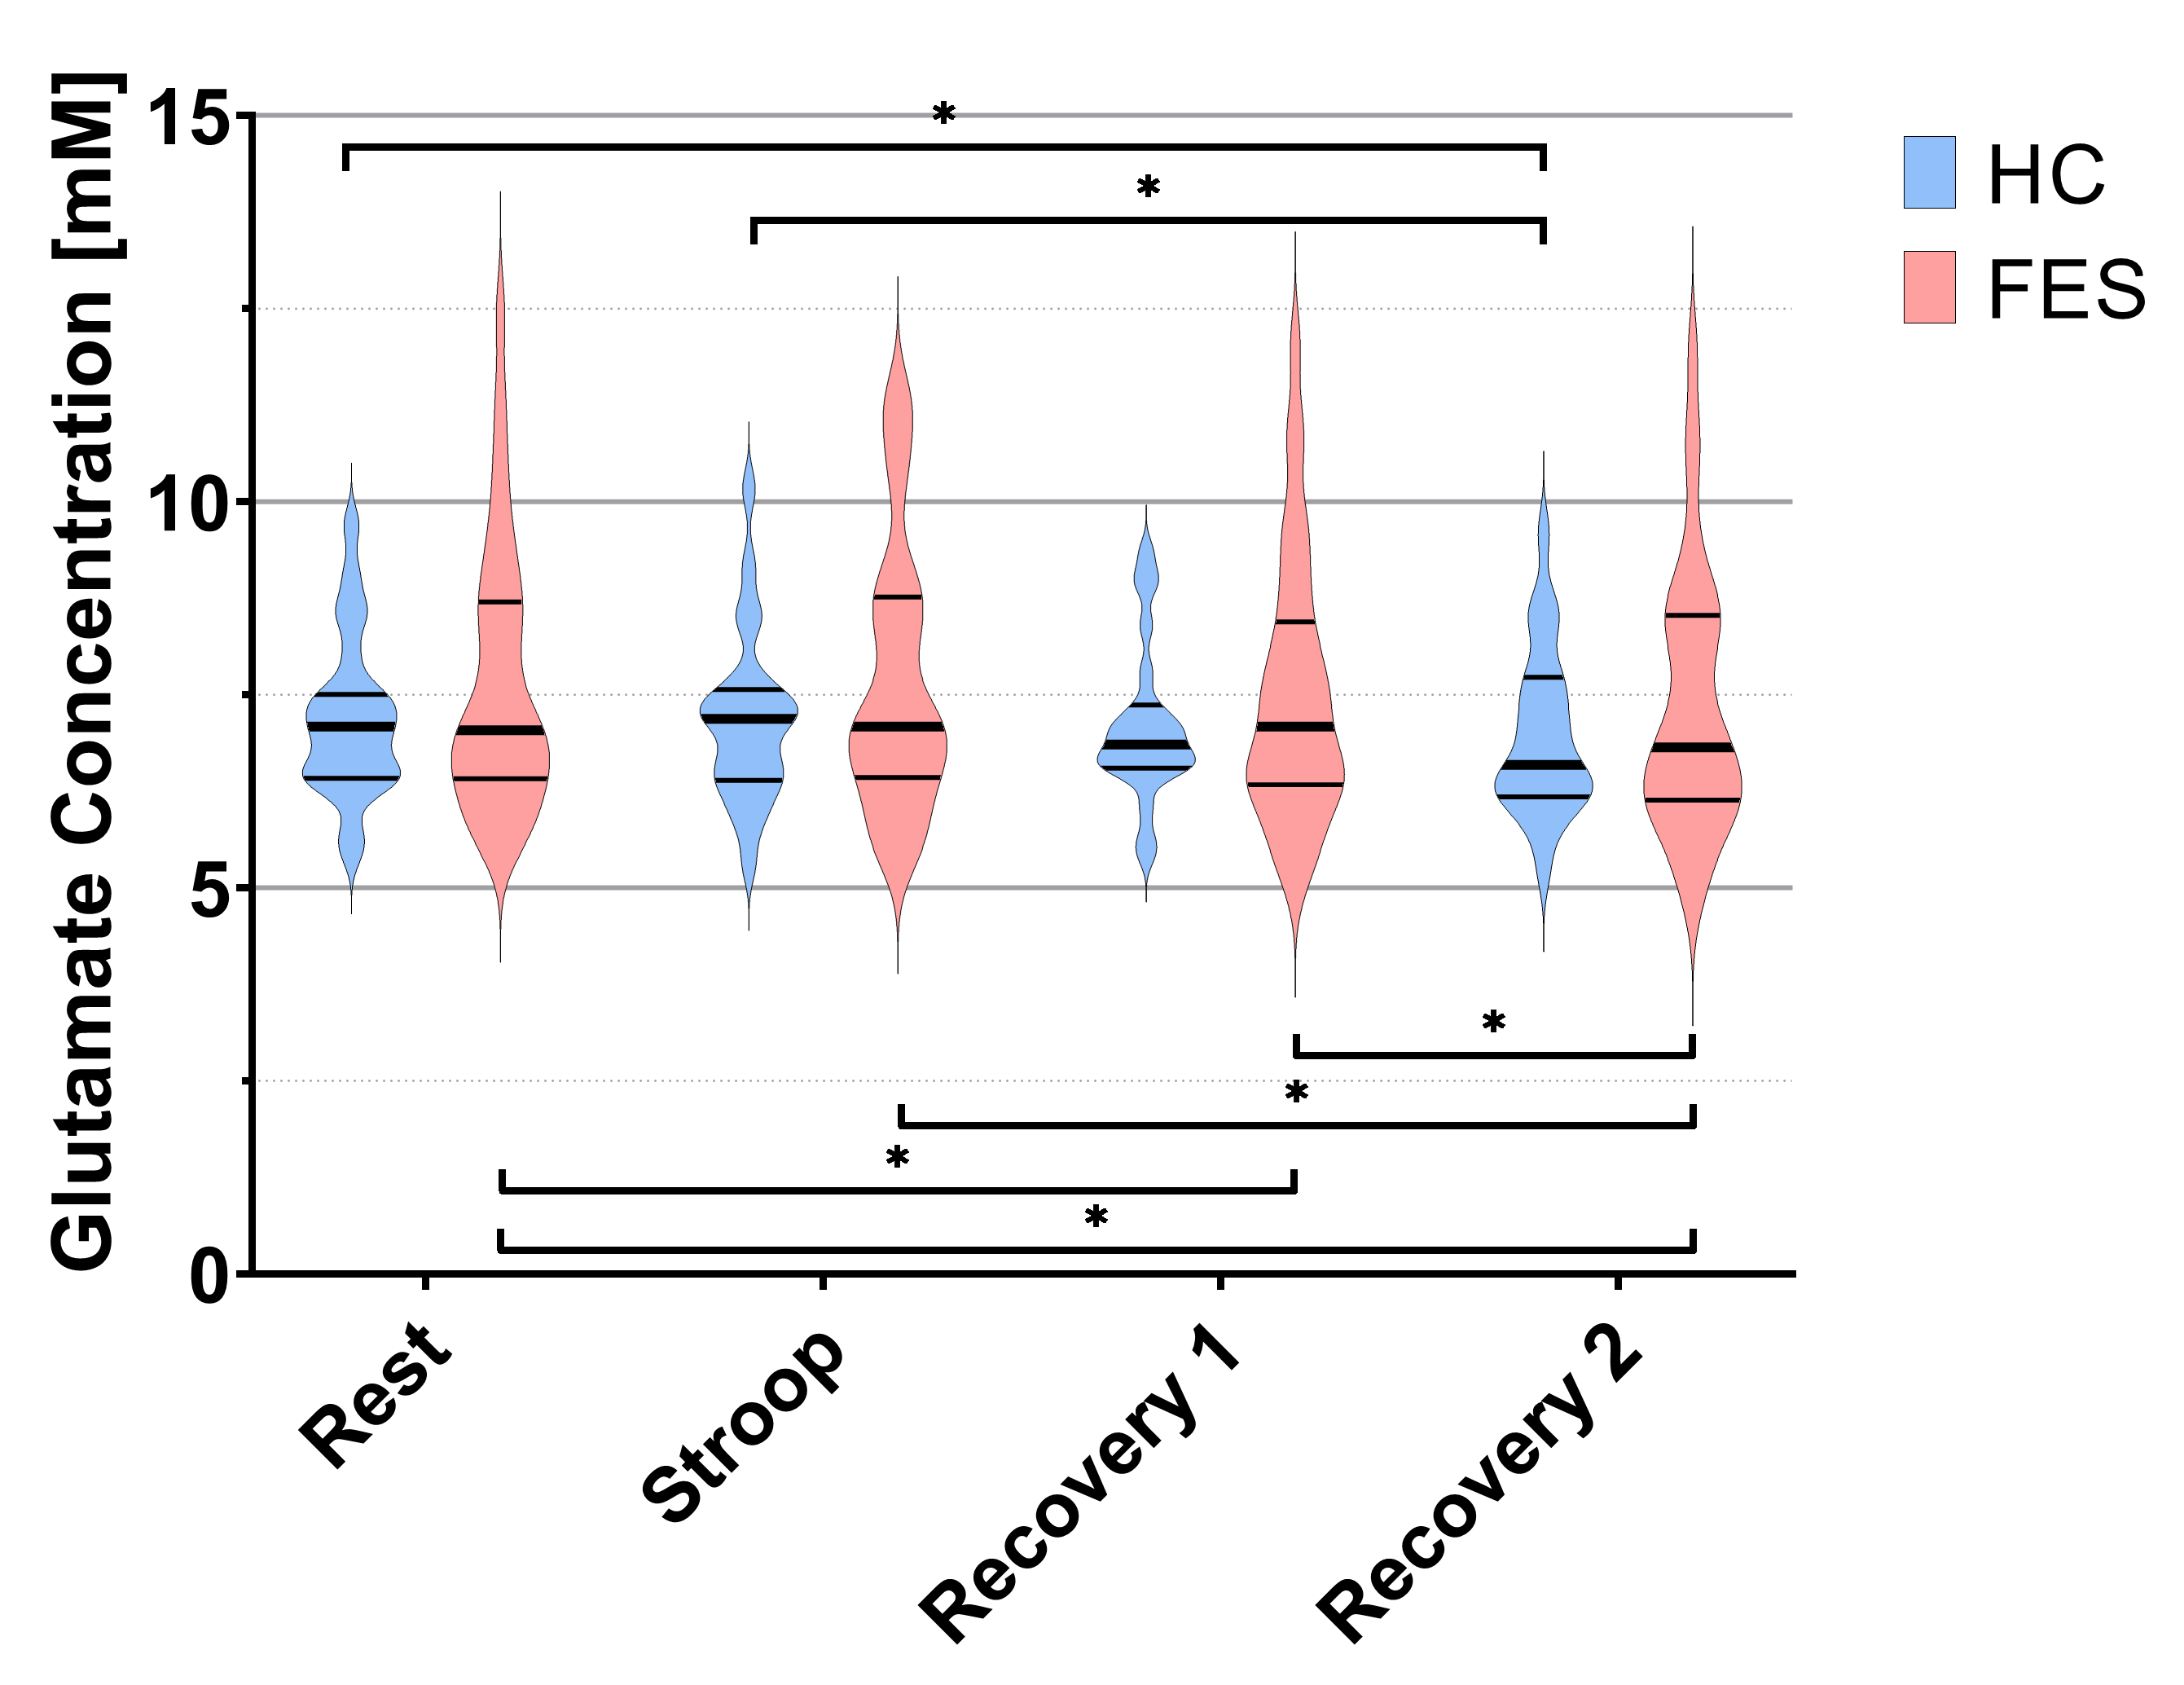
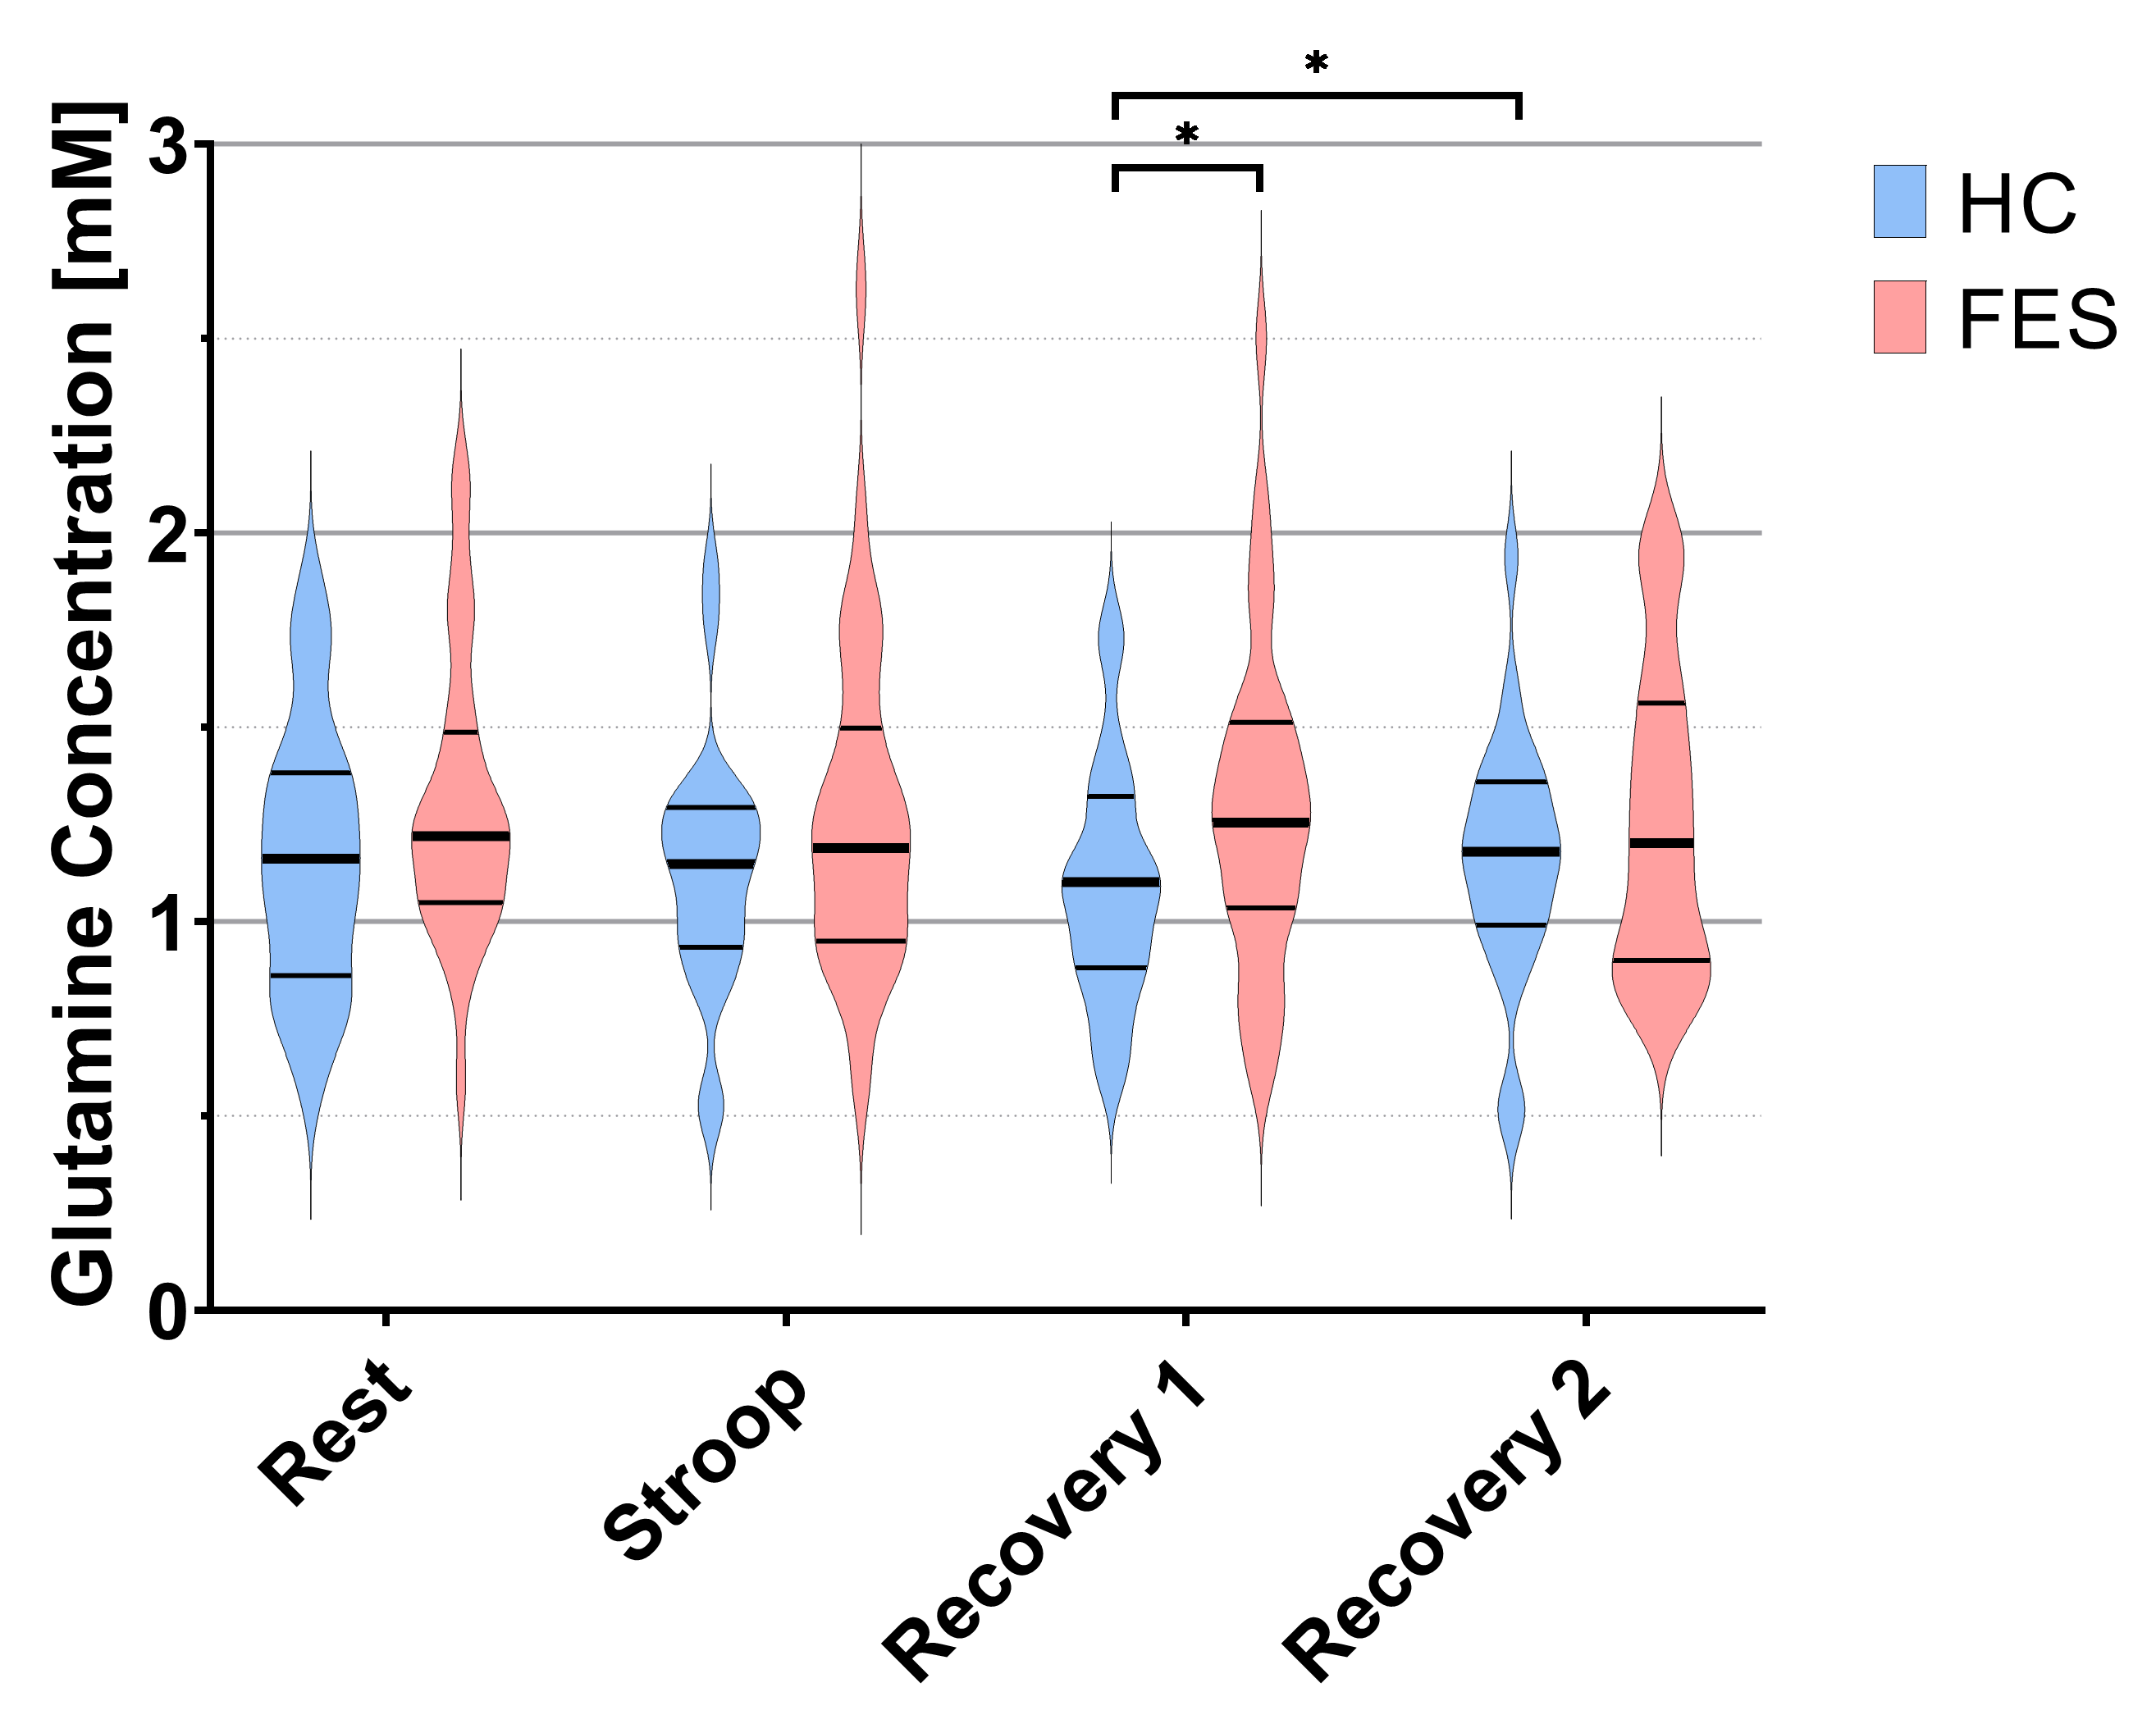
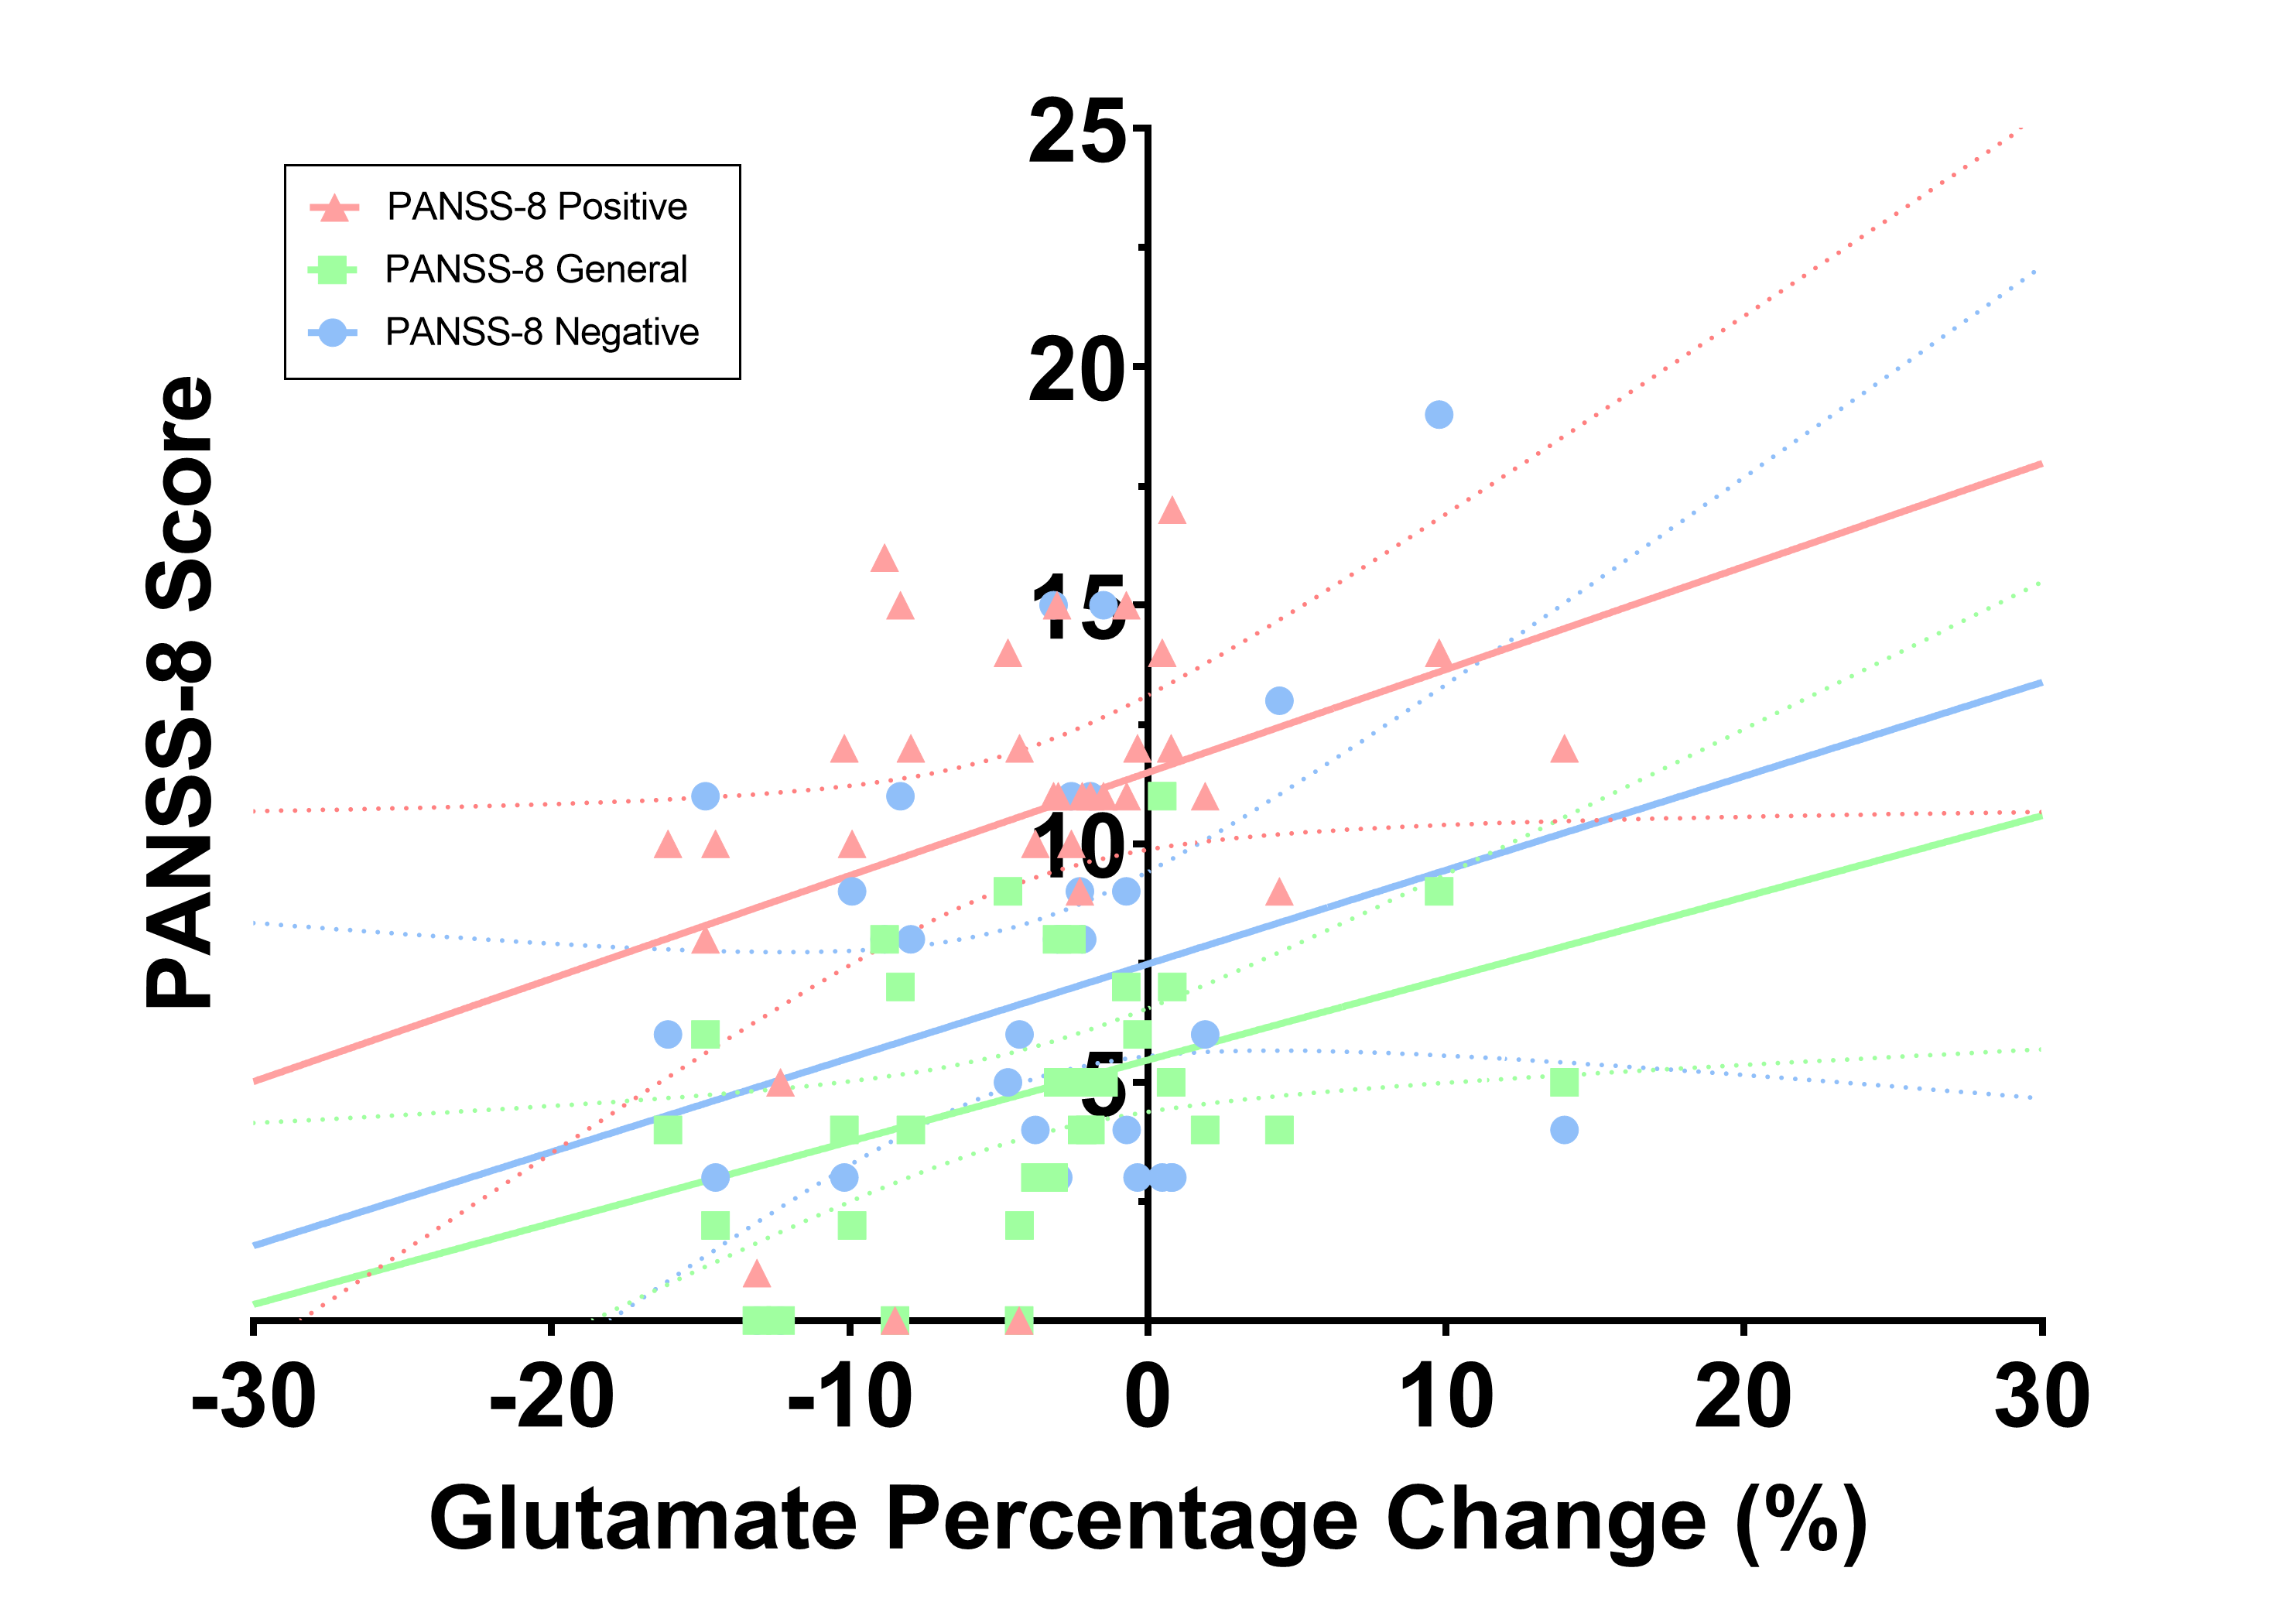
A strong trend towards higher baseline glutathione was observed in FES compared to HC (t(54) = -1.829, p = 0.07) (Figure 1). No significant difference was detected between baseline glutamate and glutamine in both groups (Figure 2-3). Repeated measures ANOVA revealed an effect of time (F(1,3) = 4.169, p = 0.01), metabolite (F(1,2) = 35.163, p < 0.001), and diagnosis × metabolite × time (F(1.52) = 5.384, p = 0.02). A significant glutathione level increase was observed during task activation in HC (t(22) = -2.570, p = 0.03), but not in FES (t(32) = 0.357, p = 0.71) (Figure 1). Glutathione levels remained elevated for an additional block in HC (t(22) = -2.570, p = 0.02), even after the removal of task stimuli, before decreasing its levels in the final block. No accompanying changes were observed in glutamate or glutamine during the task period. Glutamate concentrations were significantly decreased, below baseline levels, in the final block of the fMRS paradigm for both HC (t(22) = 3.454, p = 0.002) and FES (t(32) = 3.482, p = 0.001) (Figure 2). Additionally, a significant increase in glutamine level was detected in HC from the first to second recovery block (t(22) = -2.194, p = 0.04). Lastly, FES normalized glutamate levels in the first recovery block relative to baseline showed significant correlation to both positive (r = 0.351, p = 0.045) and general (r = 0.404, p = 0.02) PANSS-8 sub-scores (Figure 4).Discussion
We note three major observations in this work. First, is the relative elevation of glutathione levels in FES compared to HC, which may indicate pre-existing oxidative stress in our patient sample. Secondly, we note the difference in ability between HC and FES to significantly regulate their anterior cingulate glutathione levels in response to short-term cognitive activity. A potential ceiling effect of glutamatergic metabolites may prevent the FES group from increasing their glutathione levels further in response to the cognitive task. Lastly, a significant reduction in glutamate levels post-task in both groups may reveal a more complex interplay among the glutamatergic metabolites in the brain. Although a similar observation can be seen in Lin and colleagues3, further work is required to understand the potential mechanistic interplay between glutamate, glutamine, and glutathione levels in schizophrenia. One hypothesis is that hyper-excitation from a pre-existing elevated glutamatergic state may push glutamate to exist more in the vesicle state, which may be largely MR-invisible.Conclusion
This work demonstrates the need to move beyond using traditional MRS techniques into more dynamic tools such as fMRS when studying complex molecular mechanisms behind schizophrenia symptoms. Inability to effectively regulate antioxidants in response to stress not only supports the presence of redox imbalance in schizophrenia, but also suggests the inability to move towards redox balance in the early stages of illness. Effectively including GABA dynamics in future studies simultaneously with glutamate, glutamine, and glutathione measurements may provide greater insight into the interplay between redox imbalance and excitation-inhibition imbalances in schizophrenia.Acknowledgements
No acknowledgement found.References
1. Dempster K, Jeon P, MacKinley M, Williamson P, Theberge J, Palaniyappan L. Early Treatment Response in First Episode Psychosis: A 7-Tesla Magnetic Resonance Spectroscopic Study of Glutathione and Glutamate. Mol Psychiatry. 2020; 25:1640-1650.
2. Jeon P, Limongi R, Ford SD, Branco C, Mackinley M, Gupta M, Power L, Theberge J, Palaniyappan L. Glutathione as a molecular marker of functional impairment in patients with at-risk mental state: 7-Tesla 1H-MRS study. Brain Sci. 2021; 11(7):941.
3. Lin Y, Stephenson MC, Xin L, Napolitano A, Morris PG. Investigating the metabolic changes due to visual stimulation using functional proton magnetic resonance spectroscopy at 7T. J Cereb Blood Flow Metab. 2012; 32:1484-1495.
Figures