1823
Short-Term Neurochemical Effects of Transcutaneous Vagus Nerve Stimulation using 7T Magnetic Resonance Spectroscopy1Center for Clinical Spectroscopy, Department of Radiology, Brigham and Women's Hospital, Boston, MA, United States, 2Military Performance Division, U.S. Army Research Institute of Environmental Medicine, Natick, MA, United States, 3Center for Clinical Investigation, Department of Radiology, Brigham and Women's Hospital, 02115, MA, United States, 4Psychiatry, McLean Hospital, Belmont, MA, United States, 5Oak Ridge Institute for Science and Education, Belcamp, MD, United States
Synopsis
Keywords: Spectroscopy, Spectroscopy, High-field MRI, Peripheral nerve, Neuroscience, Brain
Motivation: Transcutaneous auricular vagus nerve stimulation (taVNS) has shown therapeutic efficacy in treating conditions such as epilepsy and depression. Recently, its potential to improve cognitive performance in healthy adults has been explored.
Goal(s): However, little is known about the neurochemical processes underlying performance enhancing outcomes. This study assessed immediate and residual effects of taVNS on neurochemical activity in brain regions associated with attention, vigilance, and stress.
Approach: Magnetic resonance spectroscopy was used to non-invasively quantify neurochemical responses immediately after and 60 minutes post-stimulation compared with baseline.
Results: Increased myo-inositol was observed in the posterior cingulate immediately after taVNS but not sustained for 60 minutes.
Impact: Using magnetic resonance spectroscopy allowed for the evaluation of the short-term neurochemical response across multiple brain regions from transcutaneous auricular vagus nerve stimulation, which helps elucidate the mechanisms of the potential therapeutic and performance-improvement effects achieved from stimulation
Introduction
Transcutaneous auricular vagal nerve stimulation (taVNS) is an inexpensive and non-invasive technique for modulating brain activity. While hypothesized to influence upstream brain activity to support brain plasticity1 and promote states of arousal2, little is known about its effects on the neurochemical processes underlying these behavioral outcomes. Understanding neurochemical fluctuations associated with taVNS will provide further insights into its neural mechanisms by bridging structural and functional measures. This study addressed this gap by utilizing ultra-high-field 7T magnetic resonance spectroscopy (MRS) to quantitively evaluate the effects of a single, 20-minute taVNS session on neurochemical concentrations in multiple brain regions at different time points to potentially elucidate neuronal, glial, neurotransmitter, and energetic pathways.Methods
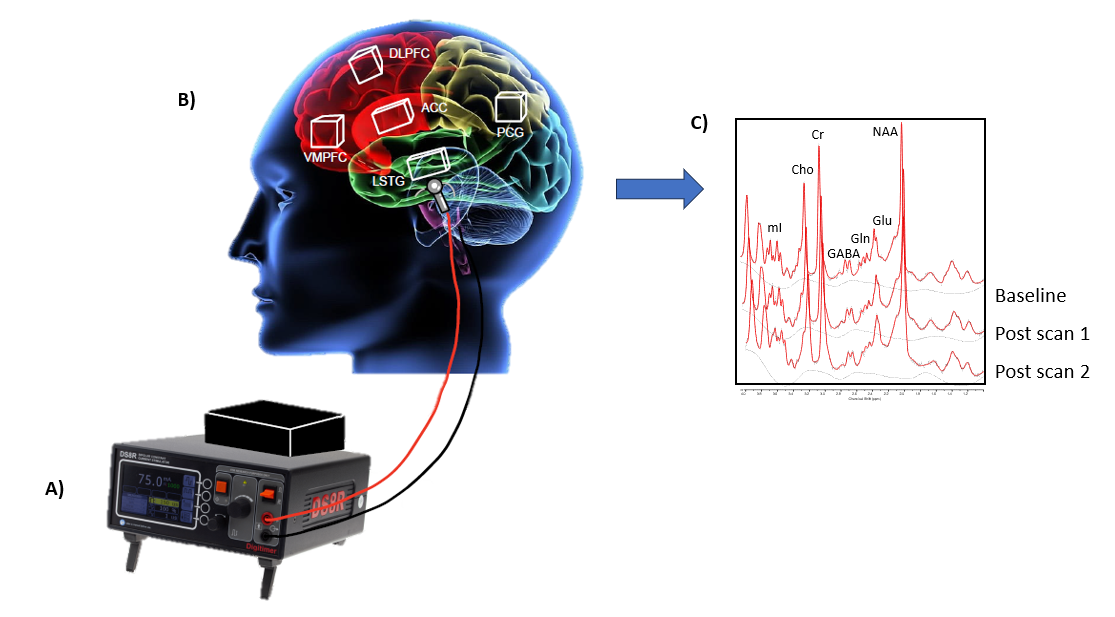
Data collection:This single-blinded, cross-over study consisted of 30 (23 males, 7 females) participants aged 22.6 ± 4.6 years who completed a taVNS and a sham stimulation session, with a wash-out period of at least one week in between. Both sessions were scheduled at the same time of day. MRS scans were performed on Siemens MAGNETOM Terra 7-Tesla scanner using a 32-channel head coil with calcium titanate dielectric pads. T1-weighted MRI images were used for voxel placement. Single voxel spectroscopy was acquired using a short echo stimulated acquisition mode sequence (TE/TR/TM = 20/3000/13 ms) for 64 averages. Unsuppressed internal water signals were acquired for reference in metabolite quantification. MRS was acquired in the left superior temporal gyrus (LSTG), anterior cingulate (ACC), dorsolateral prefrontal (DLPFC), posterior cingulate (PCC), and ventromedial prefrontal (VMPFC) cortex at three time points: before the stimulation (baseline), immediately after stimulation (post scan 1), and 60 minutes post-stimulation (post scan 2) as seen in Figure 1. A voxel size of 4x2x2 cm³ was used for ACC and LSTG while 2x2x2 cm³ was used for DLPFC, VMPC, and PCC. Brain regions chosen were based on known monosynaptic and polysynaptic afferent pathways of the vagus nerve.3
Data Processing:
MRS scans were reconstructed using OpenMRS Lab4 and concentrations of glutamate, gamma-aminobutyric acid, glutamine, myo-inositol, total N-acetylaspartate, total creatine, and total choline were quantified using LCModel5. Data quality cleaning was performed with the following inclusion criteria of SNR ≥ 10 and FWHM ≤ 0.1 ppm along with visual inspection. Pairwise deletion was conducted with the removal of both sessions if one did not pass the quality assurance procedure.
Data Analysis:
Linear mixed-effect (LME) models were implemented to compare neurochemical changes. The treatment effects (taVNS vs sham) at different time points were treated as fixed effects. Age and sex were adjusted in the LME model. Linear contrasts were constructed to evaluate different comparisons. Placebo effects were subtracted from apparent taVNS effect and reported as an estimate of true treatment effect. Longitudinal neurochemical changes were evaluated across two time-points. Single time-point neurochemical changes were evaluated at each time point. Multiple comparison corrections were performed with Benjamini/Hochberg false discovery rate.
Results
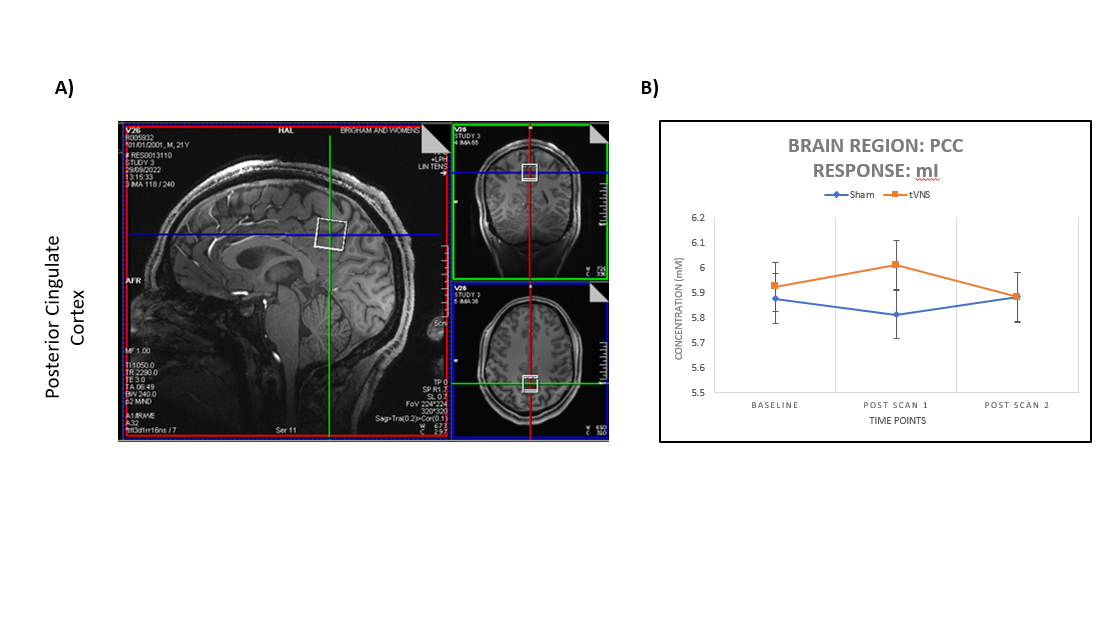
For the longitudinal analysis, there were no significant treatment differences in any neurochemical concentration in any of the brain regions between any timepoints. For the single time point analysis, there were no significant treatment differences in any neurochemical concentration in any of the brain regions at the baseline or 60-minute post taVNS/sham scan. However, at the scan immediately after taVNS/sham, there was a significant between-treatments difference in mI concentration at PCC [mean change = 0.198 mM (0.004 to 0.391), p = 0.033] as shown in Figure 2.Discussion
The observed effects suggest that mI in the PCC can be affected temporarily following taVNS. However, mI returned to baseline levels within 60 minutes post-stimulation. Since mI is involved in several mechanisms, this short-term neurochemical change may be due to the activation of second messenger systems and modulation of membrane proteins based on similar findings with transcutaneous direct current stimulation (tDCS).6 In comparison to transcutaneous trigeminal nerve stimulation using an identical study design, the neurochemical changes of increased tCr are not detected despite similar and overlapping neural pathways.7Conclusion
This study was the first to explore the short-term neurochemical response to a single 20-minute, unilateral taVNS treatment in healthy participants with ultra-high-field 7T MRS. Initial neurochemical changes were identified in the PCC but were not sustained. Future studies should utilize simultaneous functional MRS and taVNS to better measure the temporal resolution of the changes in myoinositol in the PCC and other changes that may not have been captured within the study’s timeframe. The opinions or assertions contained herein are the private views of the author(s) and are not to be construed as official or as reflecting the views of the Army or the Department of Defense.Acknowledgements
No acknowledgement found.References
1. Rizzo, V., Terranova, C., Crupi, D., Sant'angelo, A., Girlanda, P., & Quartarone, A. (2014). Increased transcranial direct current stimulation after effects during concurrent peripheral electrical nerve stimulation. Brain stimulation, 7(1), 113–121.
2. Tyler, W. J., Boasso, A. M., Mortimore, H. M., Silva, R. S., Charlesworth, J. D., Marlin, M. A., Aebersold, K., Aven, L., Wetmore, D. Z., & Pal, S. K. (2015). Transdermal neuromodulation of noradrenergic activity suppresses psychophysiological and biochemical stress responses in humans. Scientific reports, 5, 13865.
3. Badran, B. W., Dowdle, L. T., Mithoefer, O. J., LaBate, N. T., Coatsworth, J., Brown, J. C., DeVries, W. H., Austelle, C. W., McTeague, L. M., & George, M. S. (2018). Neurophysiologic effects of transcutaneous auricular vagus nerve stimulation (taVNS) via electrical stimulation of the tragus: A concurrent taVNS/fMRI study and review. Brain stimulation, 11(3), 492–500.
4. Rowland, B., Sreepada, L., Jiang, S., & Lin, A. (2017). OpenMRSLab: An open-source software repository for Magnetic Resonance Spectroscopy data analysis tools. Paper presented at the European Society of Magnetic Resonance in Medicine and Biology, Barcelona, Spain.
5. Provencher S. W. (1993). Estimation of metabolite concentrations from localized in vivo proton NMR spectra. Magnetic resonance in medicine, 30(6), 672–679.
6. Rango, M., Cogiamanian, F., Marceglia, S., Barberis, B., Arighi, A., Biondetti, P., & Priori, A. (2008). Myoinositol content in the human brain is modified by transcranial direct current stimulation in a matter of minutes: a 1H-MRS study. Magnetic resonance in medicine, 60(4), 782–789.
7. Ritland, B. M., Neumeier, W. H., Jiang, S. H., Smith, C. D., Heaton, K. J., Hildebrandt, A. M., Jabbar, M. A., Liao, H. J., Coello, E., Zhao, W., Bay, C. P., & Lin, A. P. (2023). Short-term neurochemical effects of transcutaneous trigeminal nerve stimulation using 7T magnetic resonance spectroscopy. Journal of neuroimaging : official journal of the American Society of Neuroimaging, 33(2), 279–288.
Figures