1822
Rethinking Neurochemical Distributions in White Matter and Grey Matter: Considerations for Improved Magnetic Resonance Spectroscopy Measures1Department of Biomedical Engineering, Schulich School of Engineering, University of Calgary, Calgary, AB, Canada, 2Department of Radiology, Cumming School of Medicine, University of Calgary, Calgary, AB, Canada, 3Hotchkiss Brain Institute, Cumming School of Medicine, University of Calgary, Calgary, AB, Canada, 4Alberta Children’s Hospital Research Institute, University of Calgary, Calgary, AB, Canada, 5School of Psychology, Bangor University, Bangor, United Kingdom
Synopsis
Keywords: Spectroscopy, Data Analysis, Neurochemical Concentration Quantification
Motivation: Current methods to quantify neurochemical concentrations in magnetic resonance spectroscopy (MRS) assume an equal distribution of neurochemicals between white matter (WM) and grey matter (GM), however, the implications of this assumption have not been explored.
Goal(s): We aimed to improve the accuracy of MRS concentration measures by replacing assumptions with calculated values.
Approach: We compared calculated concentration ratios of six neurochemicals in WM and GM with the assumed 1:1 ratio to determine the impact of assuming a 1:1 ratio on neurochemical concentrations.
Results: The 1:1 ratio assumption yielded estimate errors of up to 55%.
Impact: Implementation of our calculated white and grey matter neurochemical distributions will yield magnetic resonance spectroscopy concentration measures that are ~30-55% more accurate than conventional methods.
Introduction
Magnetic resonance spectroscopy (MRS) is a non-invasive technique to quantify neurochemical concentrations within a voxel in vivo. Absolute neurochemical concentration measures require an assumption of the concentration ratio of the neurochemical of interest in white matter (WM) and grey matter (GM), the cWM/cGM ratio.1,2 Despite general acceptance that there are differences in neurochemical concentrations between WM and GM, quantification methods typically assume they are equally distributed (i.e., a 1:1 cWM/cGM ratio). Further, regional variations in the cWM/cGM ratio are also likely, due to the unique cellular composition and functional demands of different brain regions.3 This study: (1) investigated the cWM/cGM concentration ratio for total N-acetylaspartate (tNAA), total creatine (tCr), total choline (tCho), myoinositol (Myo), glutamate (Glu), and glutamate + glutamine (Glx), (2) determined how this ratio varies between anterior and posterior brain regions, and (3) compared the calculated cGM/cWM ratios to the conventional assumption of a 1:1 cWM/cGM ratio. These findings will provide more accurate measures of neurochemical concentration estimates from MRS.Methods
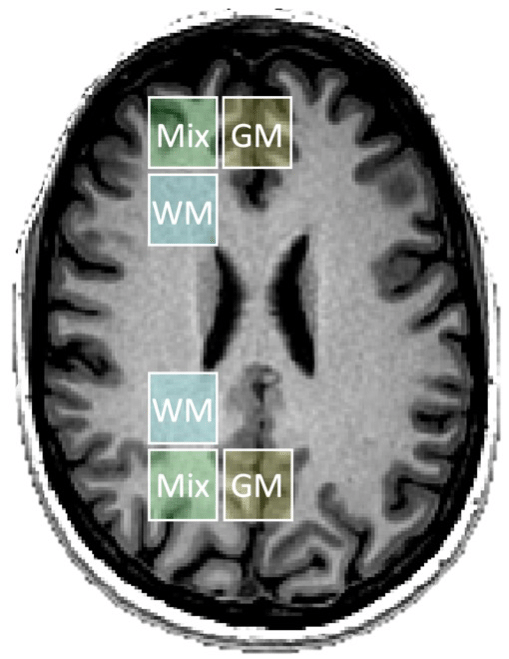
Data were collected at 3T (GE 750W, 32-channel head coil) from 27 participants (ages 18-40 years) who provided informed, written consent. First, a T1-weighted structural image was acquired (TR/TE=7.4ms/2.7ms and 1mm³ isotropic voxels) for voxel placement and tissue segmentation. MRS data were collected in six voxels (three anterior and three posterior), as shown in Figure 1. Voxels were placed to encompass a variety of tissue compositions in the anterior and posterior of the brain rather than specific to an anatomical region. As such, voxel placement included one primarily WM, one primarily GM, and one mixed voxel for both anterior and posterior placements. A semi-LASER acquisition was used to collect MRS data (TR/TE=3000ms/35ms, voxel size 20x20x20 mm³, 96 averages, and VAPOR water suppression). Voxels were segmented using SPM as implemented in Gannet 3.24, preprocessed using FID-A5, and quantified using a custom basis set developed in FID-A with default macromolecule simulations in LCModel6. Data were corrected for differing water density and relaxation constants between WM, GM, and CSF, using literature values.7 We determined the cWM/cGM ratio for each neurochemical using a linear fit of neurochemical concentration to voxel GM fraction for all six voxels combined, as well as the three anterior and three posterior voxels separately for regionally specific measures. Subsequently, a sensitivity analysis assessed the impact of variations in the cWM/cGM ratio by calculating the percent error in concentration estimates across a range of cWM/cGM ratios for representative voxels with diverse compositions. Concentrations were calculated using a custom equation that combines existing equations for relaxation correction2 and tissue correction9. The percent errors were calculated with the pooled ratio (from all six voxels combined) serving as an example reference to determine the error in neurochemical concentration estimates if the commonly assumed 1:1 cWM/cGM ratio is used.Results
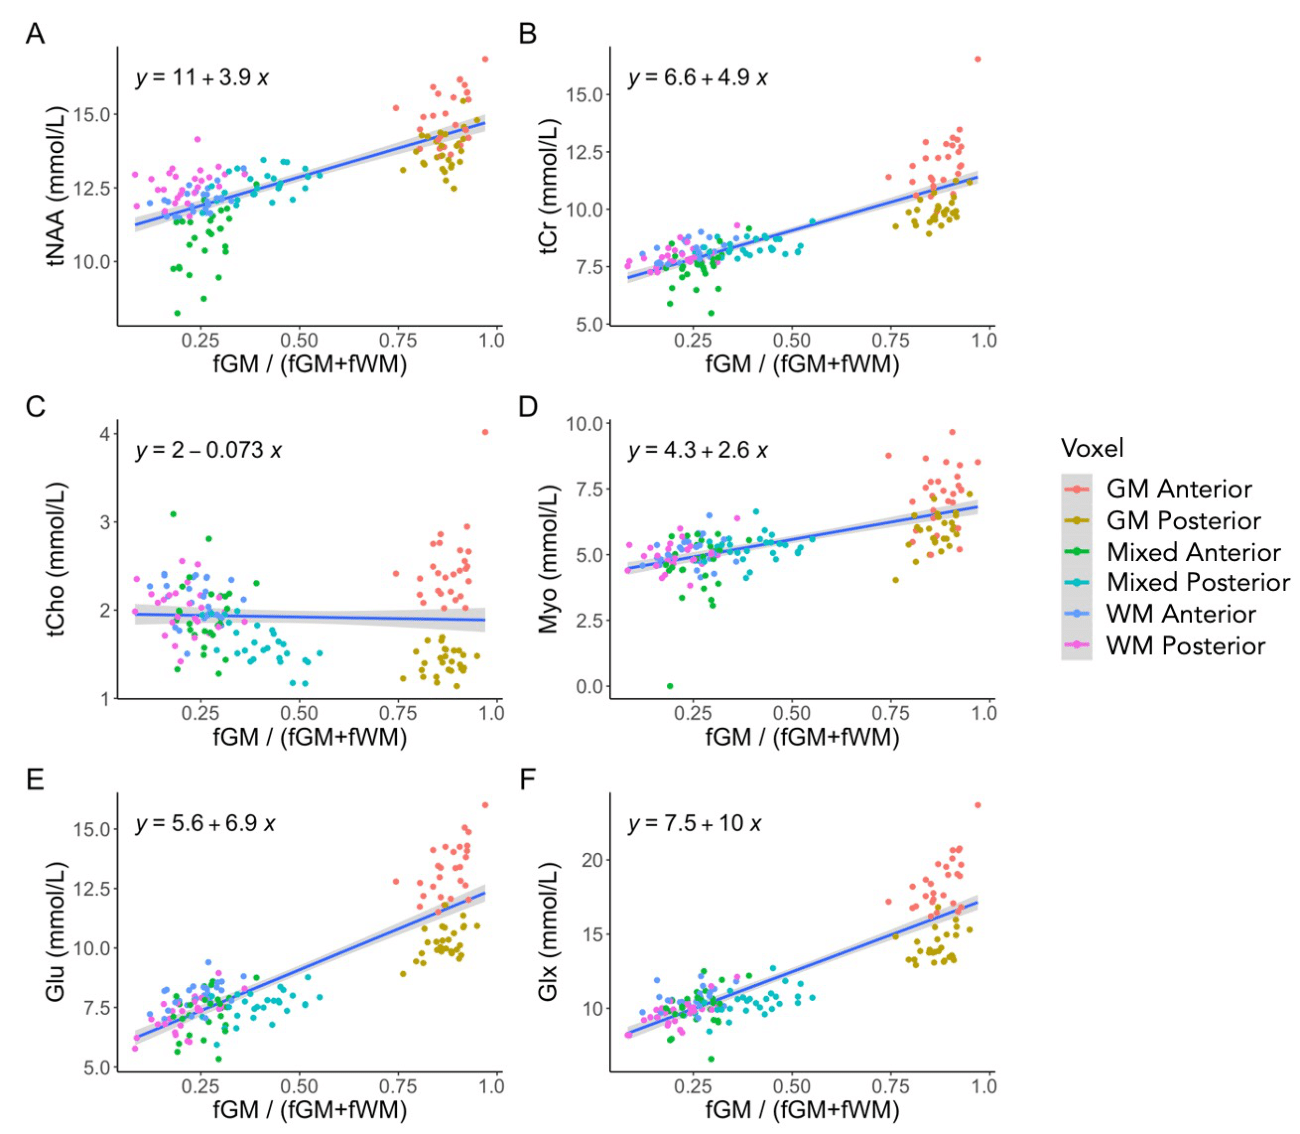
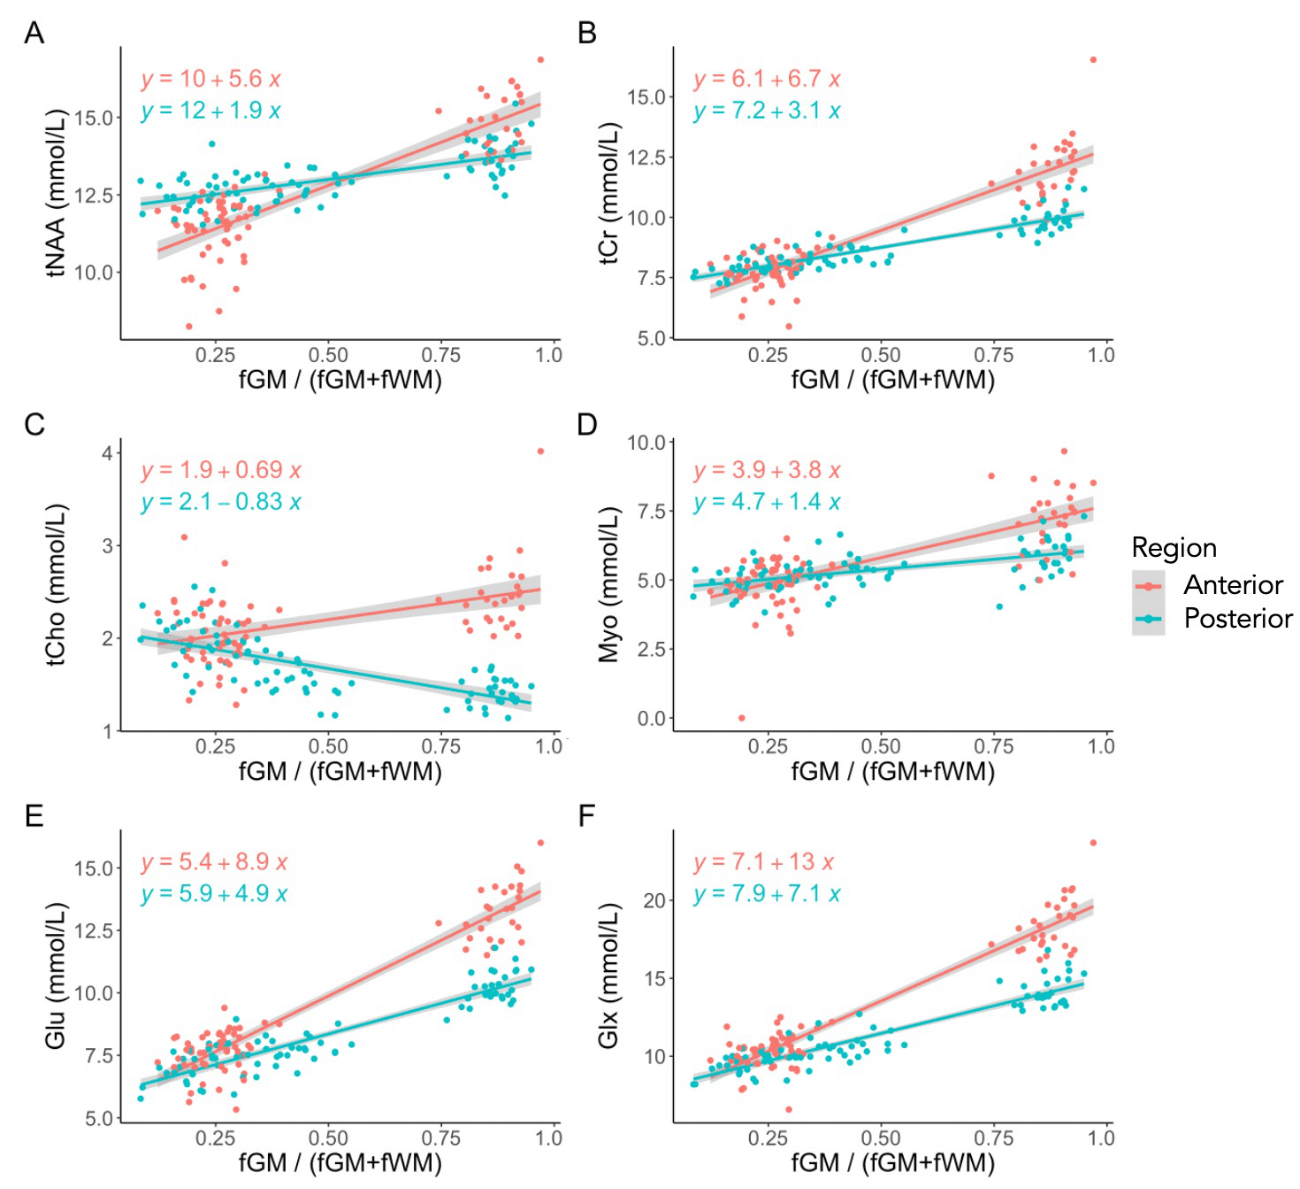
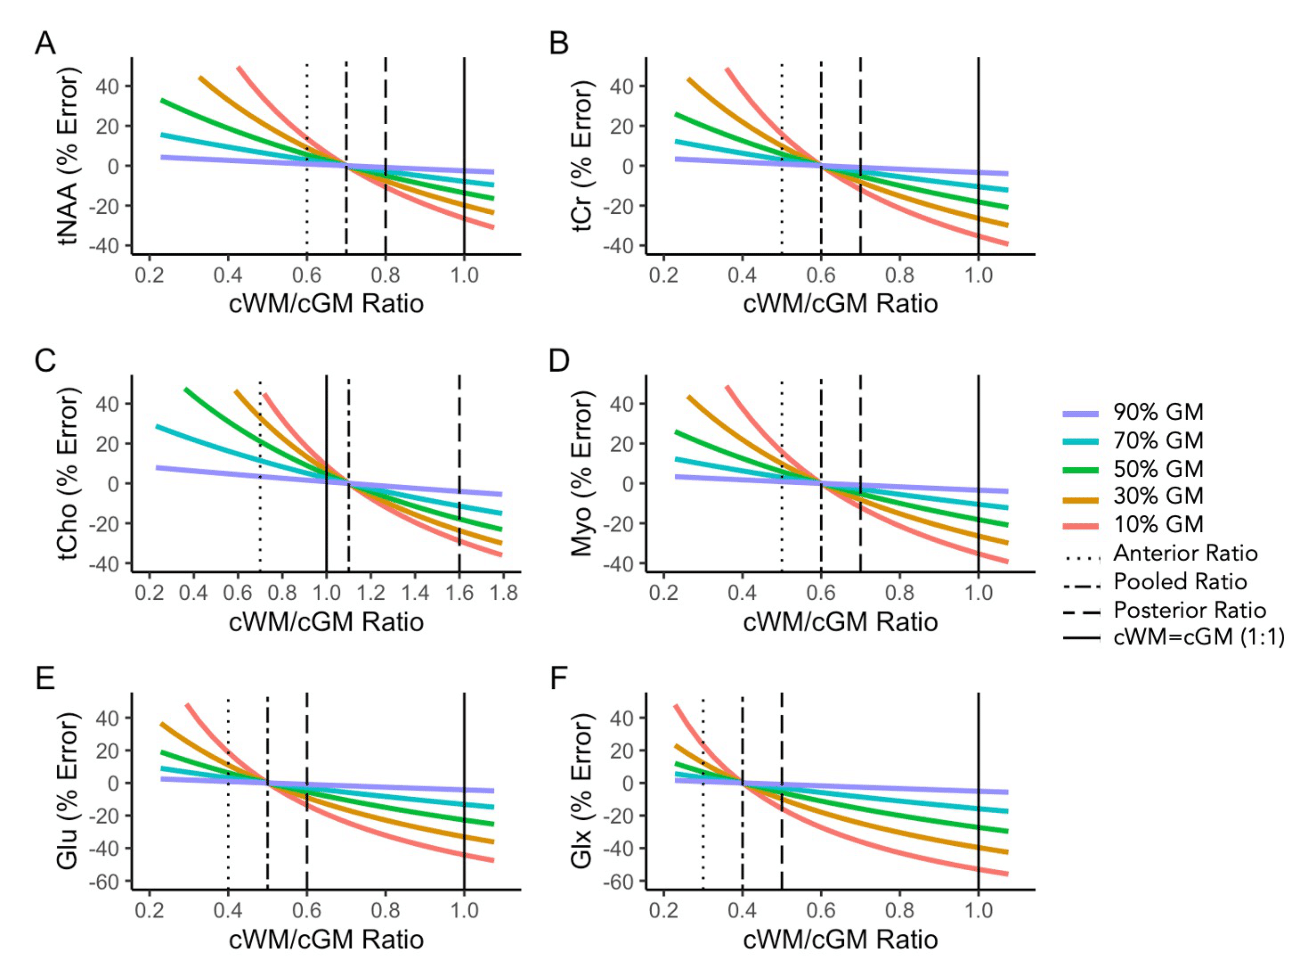
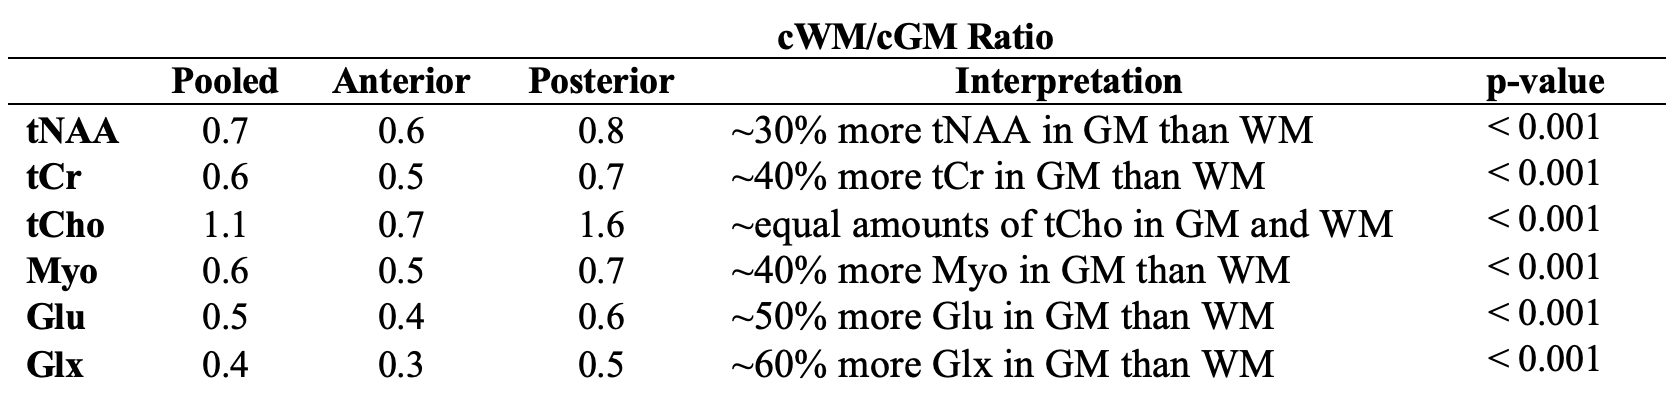
There is a strong linear relationship (R2 range, 0.42-0.75) between concentration and GM fraction for all neurochemicals except tCho (Figure 2). The slope for tCho is close to 0 (R2 = 0.0023) suggesting that there are approximately equal concentrations of tCho in GM and WM. The fit improves for all neurochemicals including tCho (R2 range, 0.25-0.91) when analyses are separated by anterior and posterior voxels (Figure 3). For all six neurochemicals, there are higher concentrations in GM than WM in the anterior regions compared to the posterior regions (Table 1). As acceptable limits were predefined as ±10% error, the current assumption of a 1:1 cWM/cGM ratio cannot be sufficiently used for all regions and all voxel compositions, as shown by the sensitivity analysis (Figure 4). While voxels compositions with high GM content are not sensitive to variations in the cWM/cGM ratio, a voxel with high WM content is highly sensitive to variations in the cWM/cGM ratio yielding percent errors of up to 55% for the assumption of a 1:1 cWM/cGM ratio.Discussion & Conclusion
This study found significant variations in the cWM/cGM ratio for six neurochemicals across anterior and posterior brain regions, with the conventional assumption of a 1:1 ratio in MRS causing up to 55% error in concentration estimates. Thus, we recommend the use of 0.7, 0.6, 1, 0.6, 0.5, 0.4 for cWM/cGM ratios of tNAA, tCr, tCho, Myo, Glu, and Glx, respectively for improved accuracy. While there may be up to 25% error associated with this generalized selection of the pooled cWM/cGM ratio depending on your voxel composition and voxel placement within the brain, the associated error will be ~30% less than that associated with the current assumption of a 1:1 cWM/cGM ratio. These findings will enhance the accuracy of MRS neurochemical concentration measures.Acknowledgements
This study was supported by the University of Calgary; the Hotchkiss Brain Institute, University of Calgary; the Canada Research Chair to ADH in MR Spectroscopy in Brain Injury; and the Natural Sciences Council of Canada (CGS-D to SAL).References
- Gasparovic, C. et al. Use of tissue water as a concentration reference for proton spectroscopic imaging. Magn. Reson. Med. 55, 1219–1226 (2006).
- Gasparovic, C., Chen, H. & Mullins, P. G. Errors in 1H-MRS estimates of brain metabolite concentrations caused by failing to take into account tissue-specific signal relaxation. NMR Biomed. 31, (2018).
- Zachlod, D., Bludau, S., Cichon, S., Palomero-Gallagher, N. & Amunts, K. Combined analysis of cytoarchitectonic, molecular and transcriptomic patterns reveal differences in brain organization across human functional brain systems. Neuroimage 257, 119286 (2022).
- Edden, R. A. E., Puts, N. A. J., Harris, A. D., Barker, P. B. & Evans, C. J. Gannet: A batch-processing tool for the quantitative analysis of gamma-aminobutyric acid-edited MR spectroscopy spectra. J. Magn. Reson. Imaging 40, 1445–1452 (2014).
- Simpson, R., Devenyi, G. A., Jezzard, P., Hennessy, T. J. & Near, J. Advanced processing and simulation of MRS data using the FID appliance (FID-A)—An open source, MATLAB-based toolkit. Magn. Reson. Med. 77, 23–33 (2017).
- Provencher, S. W. Estimation of metabolite concentrations from localized in vivo proton NMR spectra. Magn. Reson. Med. 30, 672–679 (1993).
- Near, J. et al. Preprocessing, analysis and quantification in single‐voxel magnetic resonance spectroscopy: experts’ consensus recommendations. NMR Biomed. 34, 1–23 (2021).
- Harris, A. D., Puts, N. A. J. & Edden, R. A. E. Tissue correction for GABA-edited MRS: Considerations of voxel composition, tissue segmentation, and tissue relaxations. J. Magn. Reson. Imaging 42, 1431–1440 (2015).
Figures