1820
Regional Evaluation of Left Ventricular Cardiac Diffusion Tensor Imaging Metrics in Healthy Volunteers1Department of Radiology, Stanford University, Stanford, CA, United States, 2Department of Bioengineering, Stanford University, Stanford, CA, United States, 3Division of Radiology, Veterans Administration Health Care System, Palo Alto, CA, United States, 4Cardiovascular Institute, Stanford University, Stanford, CA, United States, 5Department of Mechanical and Aerospace Engineering, University of Central Florida, Orlando, FL, United States
Synopsis
Keywords: Myocardium, Tissue Characterization, Cardiac Diffusion Tensor Imaging, cDTI, Heart, Data Analysis
Motivation: cDTI is a useful method for evaluating cardiac microstructure with proven clinical utility. To better enable the use of cDTI in the diagnosis of various cardiomyopathies, establishing quantitative baseline values in healthy subjects is needed.
Goal(s): Goal: To quantify healthy baseline cDTI metrics on a regional basis to understand normal regional differences in cDTI metrics.
Approach: Healthy volunteers received a cDTI exam covering the entire LV. Regional and global analyses of cDTI metrics were completed using the AHA 16-segment model.
Results: Statistically significant regional differences were found across all parametric maps, with the majority of them in basal segments.
Impact: Characterizing regional differences in cDTI measures provides data to define healthy baseline values for several cDTI metrics. Defining this baseline regionally provides a normative database for understanding patient-specific changes in these quantitative diffusion metrics.
Introduction
Cardiac diffusion tensor imaging (cDTI) is a non-invasive technique to characterize myocardial microstructure without the use of exogenous contrast agents[1]. cDTI can generate several important measurements including left ventricle (LV) mean diffusivity (MD), fractional anisotropy (FA), the primary eigenvector, and helix angle (HA). These quantitative metrics have emerged as valuable biomarkers for several cardiac diseases[2]. Recent advancements in cDTI have also enabled faster data acquisition[3] allowing for more complete LV coverage. However, even with faster acquisitions, cDTI analysis has still been performed primarily as a global (whole slice) evaluation or on a slice-by-slice basis. With an adequate amount of data, there is now a possibility to look at regional variation in cDTI by using the standardized myocardial segmentation approach endorsed by the American Heart Association (AHA)[4]. The objective of this work was to quantify healthy baseline cDTI metrics on a regional basis in order to understand normal regional differences in cDTI parametric maps.Methods
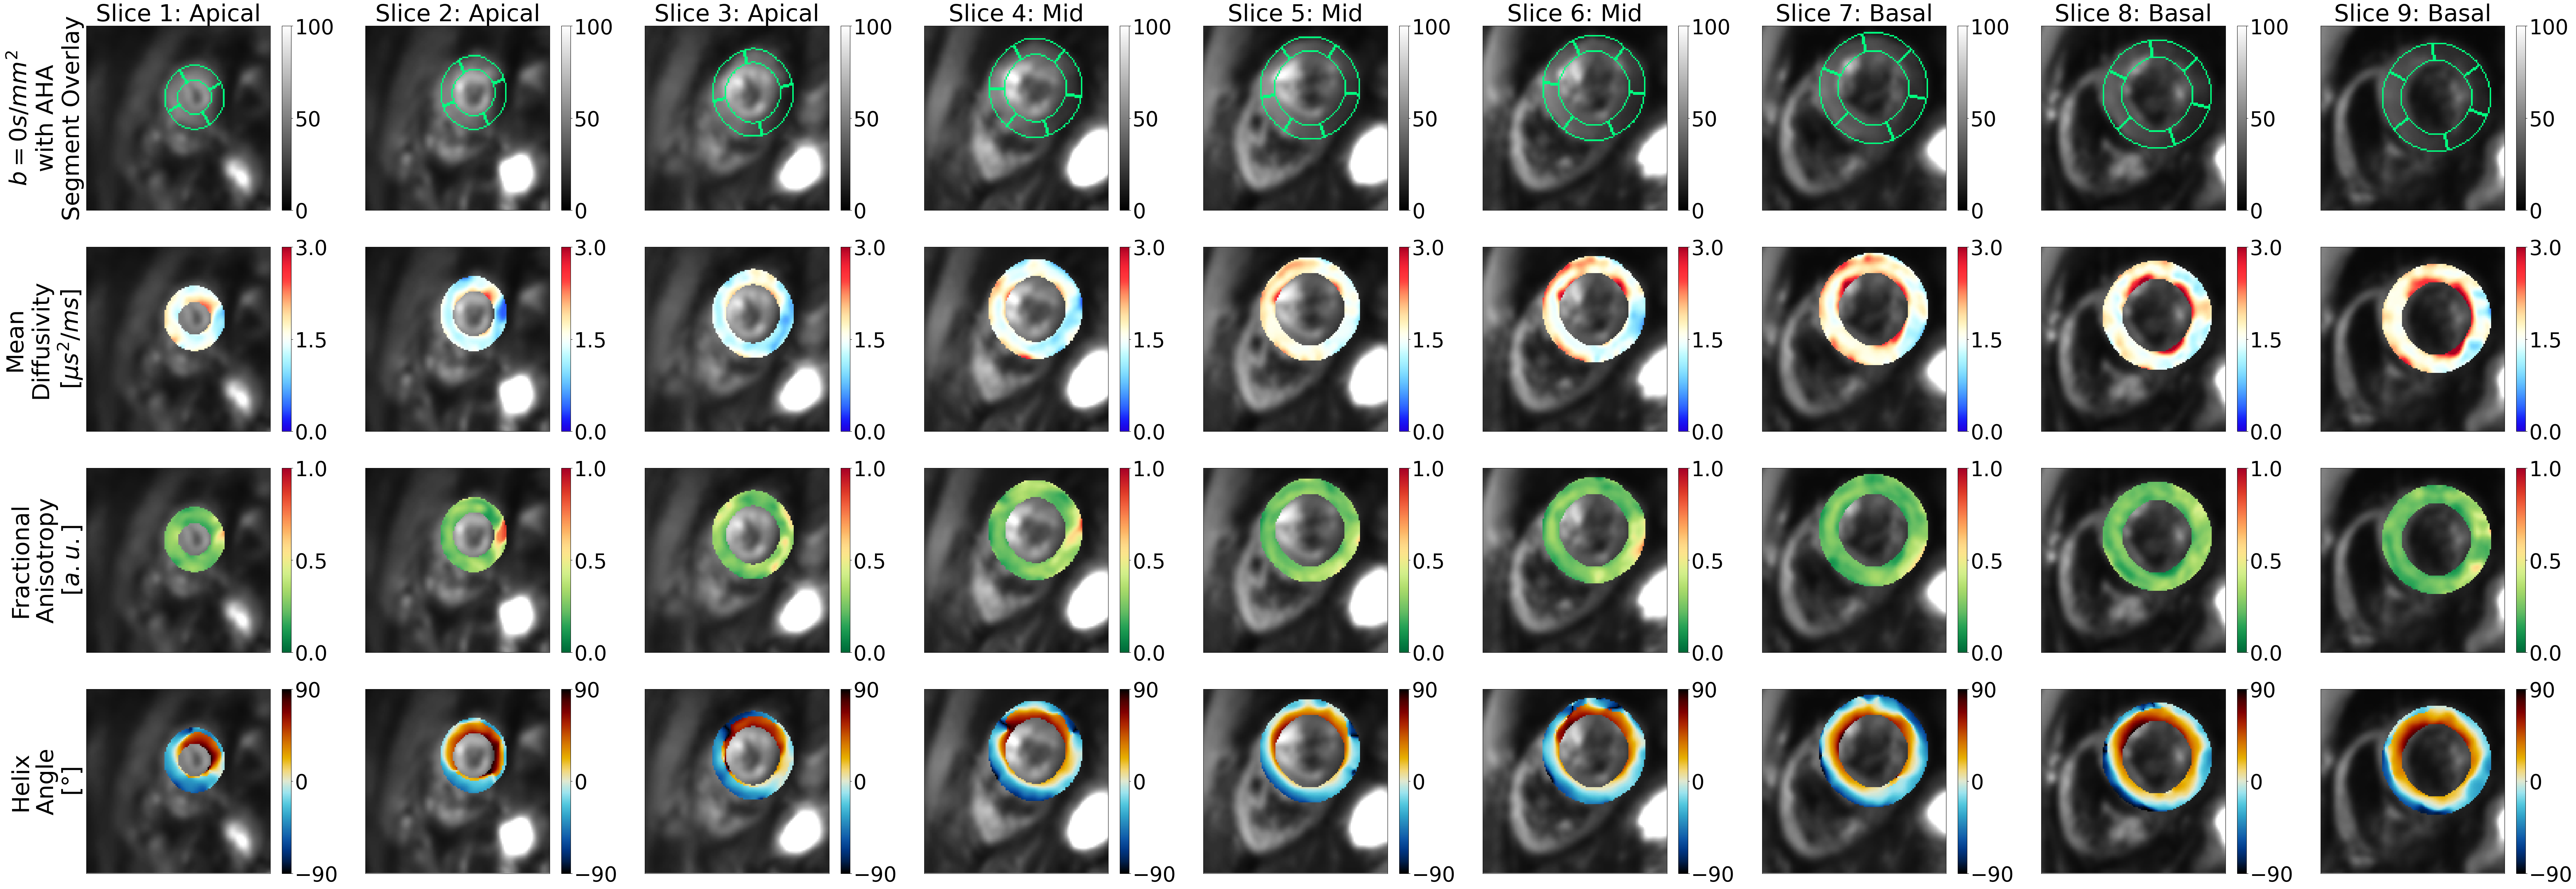
cDTI data was acquired in healthy volunteers (N=10, IRB, consent) using a 3T MRI system (Vida Fit, Siemens), an 18-channel body coil, and a 32-channel spine coil. Each volunteer was scanned using an ECG-gated, free-breathing, M0M1M2 motion-compensated spin-echo diffusion sequence with slice following[3] for full LV coverage (Nslice=7-9) using the following parameters: resolution=2×2×8mm3, b-values=[0, 350]s/mm2, diffusion directions=15, TE/TR=91ms/3×R-R interval, 2× parallel imaging (GRAPPA), partial Fourier=6/8, averages=10 [5 blip-up and 5 blip-down]. For each slice, data acquisition took 2 minutes and 40 seconds. In all volunteers, three slices were designated as mid-ventricular. Depending on heart size, 2-3 slices were designated as apical and basal slices. The images underwent post-processing and geometric distortions were corrected[5,6]. All slices were manually segmented. Regional masks were made according to the AHA 16-segment model. Overview images and parametric maps for an exam are shown for a single volunteer in Figure 1. Bullseye plots and boxplots were generated for MD, FA, and HA pitch (HAP) across all volunteers for each region in the AHA 16-segment model (Seg-01 to Seg-16) and for the global LV. HAP was calculated by computing the linear fit of HA data transmurally across the myocardium. All p-values were calculated for each segment by comparing them to the mean global parametric values across all subjects and represented as bold segments in the bullseye plots.Results
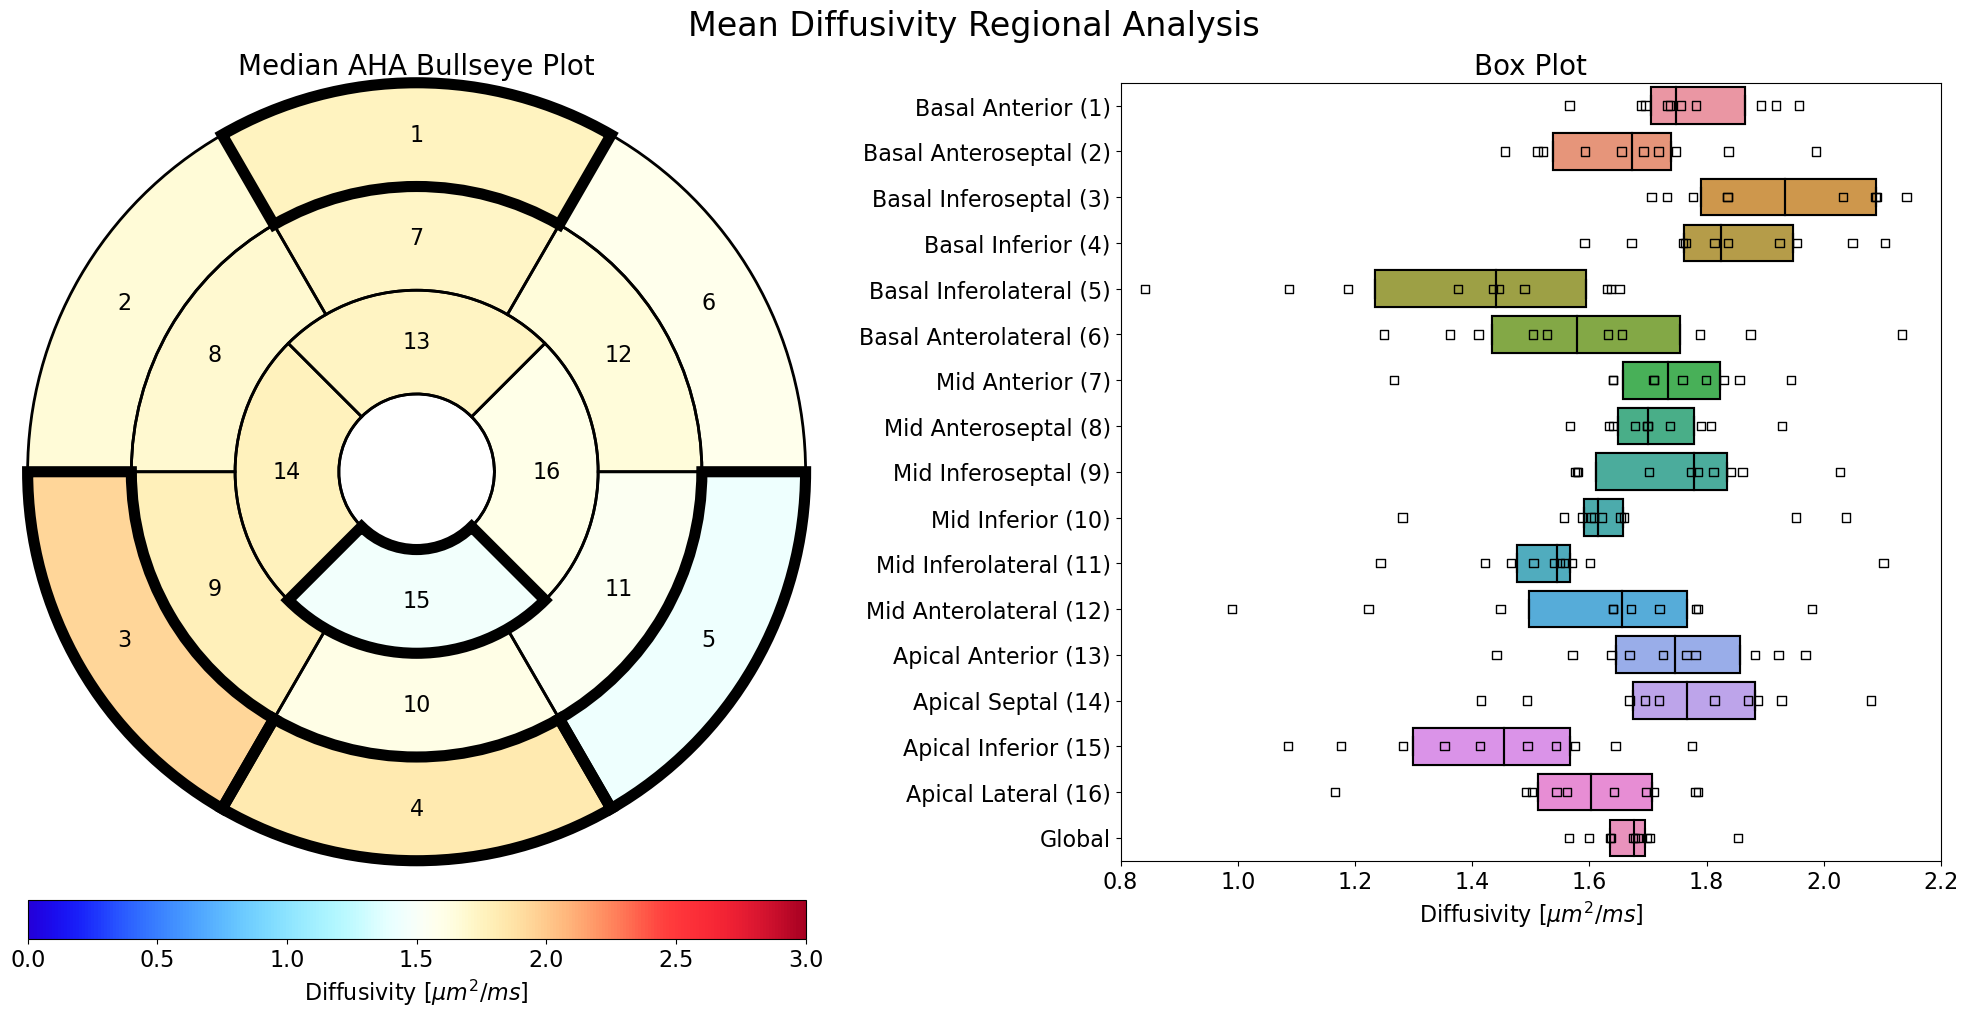
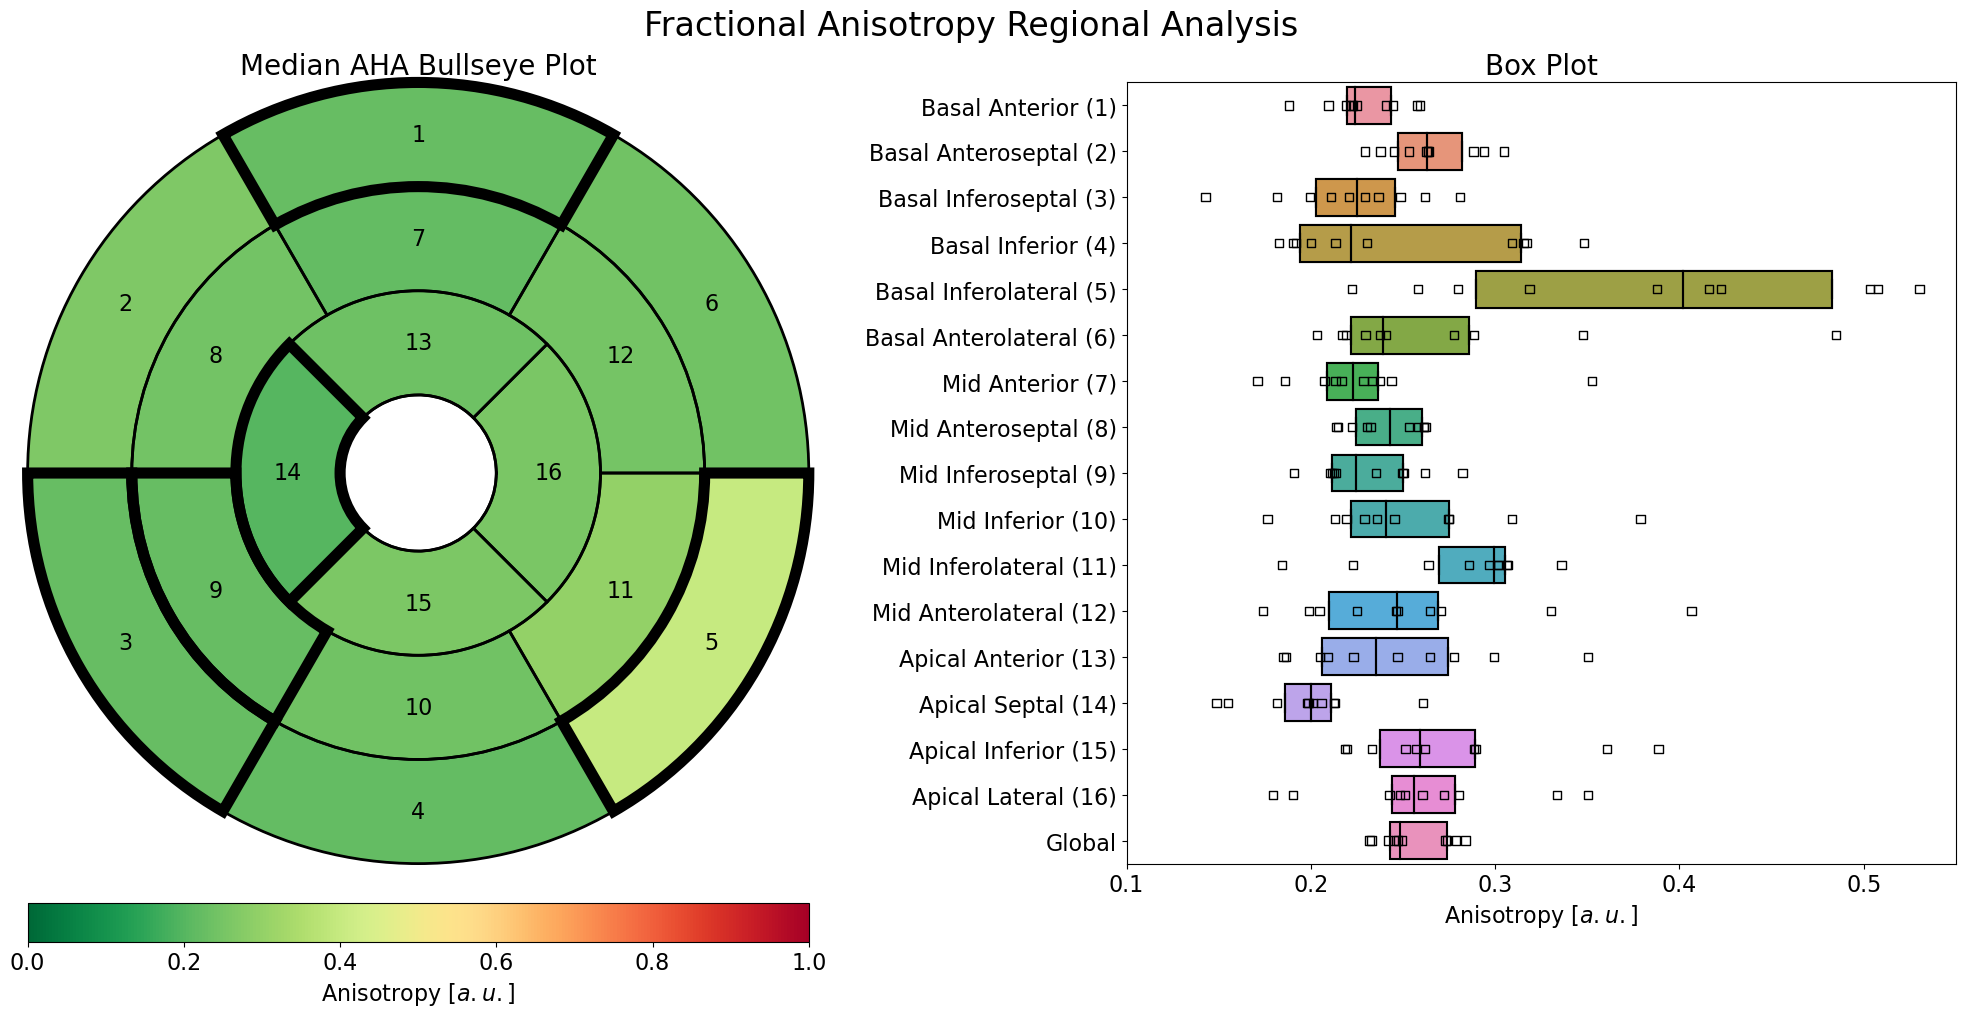
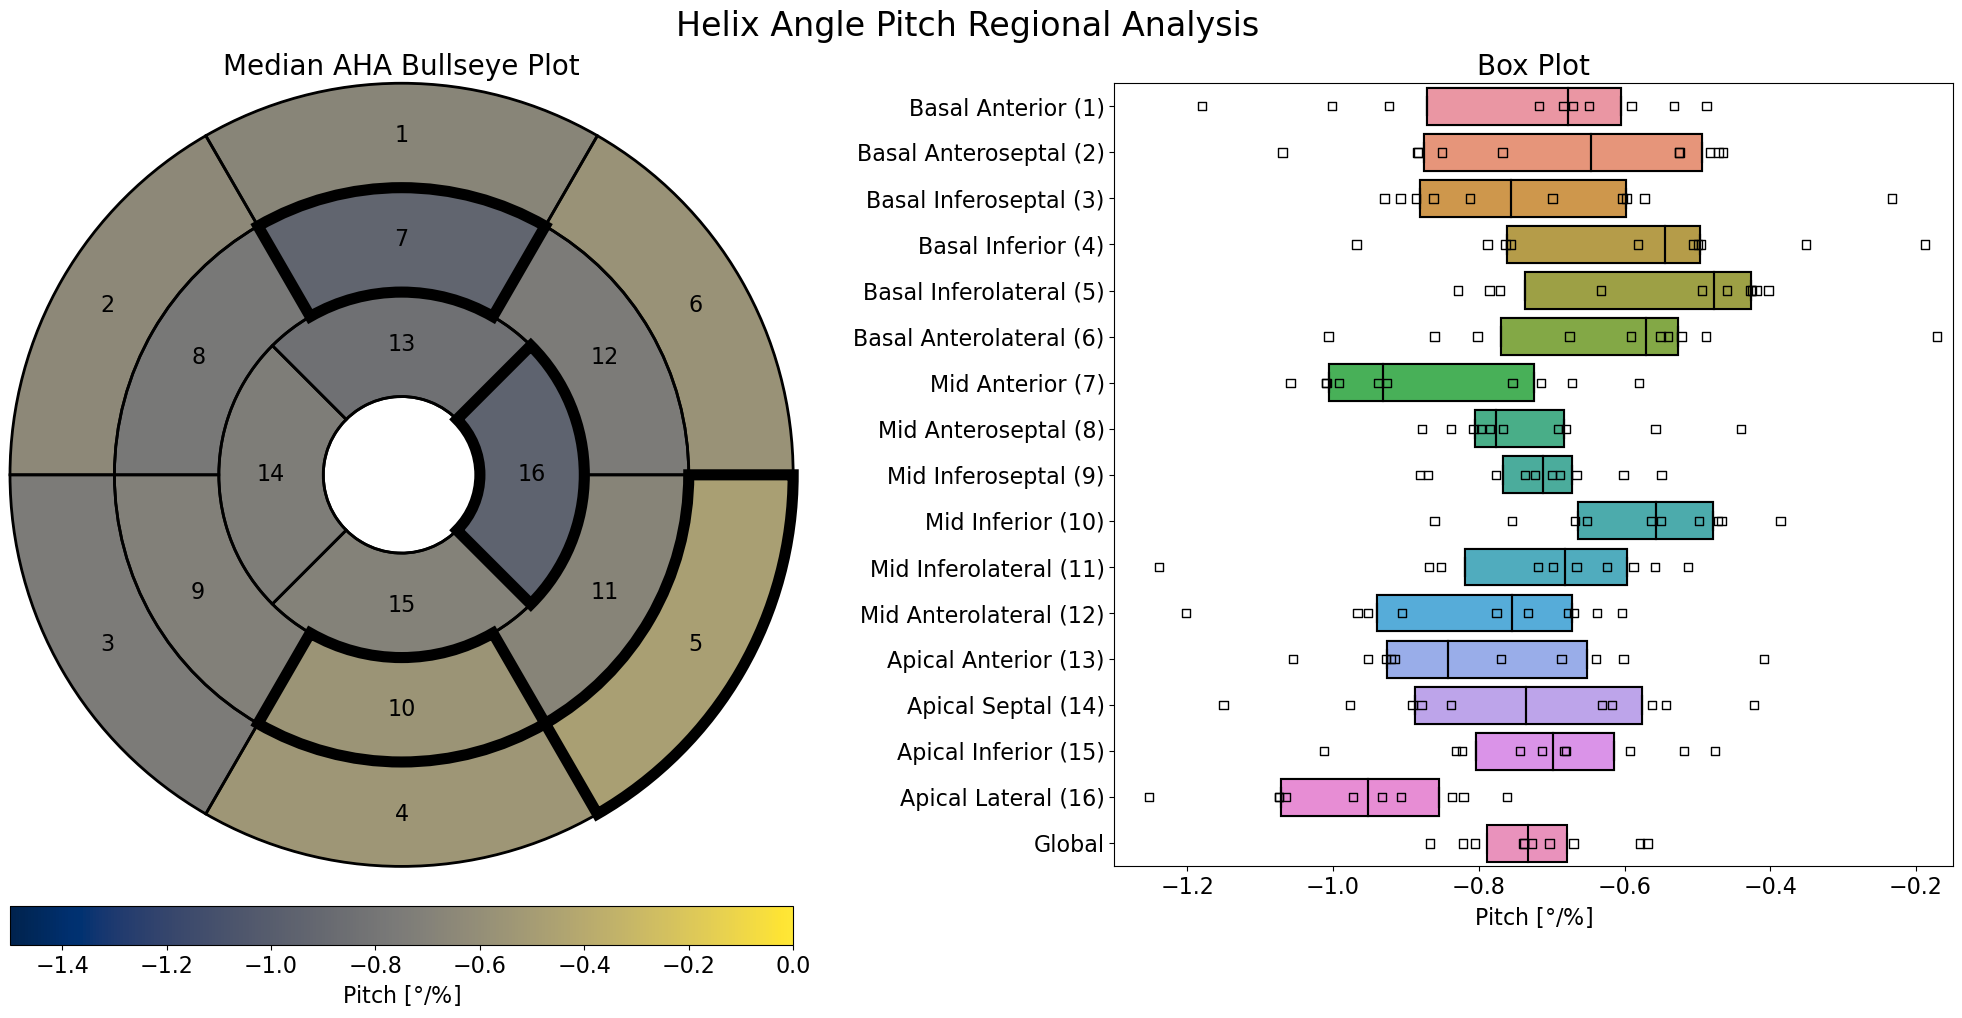
The bullseye plot for MD and the associated boxplot (Figure 2) shows that statistically significant AHA segments are the basal anterior (Seg-01): higher, basal inferoseptal (Seg-03): higher, basal inferior (Seg-04): higher, basal inferolateral (Seg-05): lower, and apical inferior (Seg-15): lower. The MD boxplot shows the mid-ventricular slices (Seg-07 to Seg-12) have tighter distribution compared to apical (Seg-13 to Seg-16) and basal (Seg-01 to Seg-06) regions. When analyzing the FA results (Figure 3), statistically significant segments included the basal anterior (Seg-01): lower, basal inferoseptal (Seg-03): lower, basal inferolateral (Seg-05): higher, mid inferoseptal (Seg-09): lower and apical septum (Seg-14): lower, when compared to the global FA. The boxplot shows that the distributions in the mid-ventricular slices (Seg-07 to Seg-12) are tighter. In Figure 4, regional HAP proved to have the least number of statistically significant findings when compared to the global HAP. The basal inferolateral (Seg-05): higher, mid anterior (Seg-07): lower, mid inferior (10): higher, and apical lateral (Seg-16): lower regions were statistically significant for HAP. The boxplot shows that the HAP distributions in the mid-ventricular slices (Seg-07 to Seg-12) are tighter.Discussion
In healthy subjects, we see that mid-ventricular AHA segments have lower regional variation in MD and basal AHA segments show larger regional variation in MD compared to the global MD. Assessment of FA also displayed larger regional variation in basal segments, while apical and mid-ventricular were more stable. The inferior and anterior walls of the heart have more off-resonance due to the liver/heart/lung interfaces, which could contribute to these findings, even after applying distortion correction. Additionally, the base-to-apex shortening during contraction may contribute to motion corruption in basal slices. HAP displayed the least number of regional differences. One limitation of this study is the number of volunteers. Data acquisition for this project continues. The data was also acquired using a conventional gradient system (45mT/m, 200T/m/s) and higher performance systems permit the acquisition of higher quality data.Conclusion
In conclusion, there are regional differences even in healthy subjects. Although artifacts may, in part, affect the reported values, this study suggests the importance of considering regional differences when cDTI measures are used to diagnose the onset and progression of cardiomyopathies. Given the importance of regional differences, further studies including a larger number of volunteers are needed to confirm the results.Acknowledgements
We would like to acknowledge our funding sources which include NSF 2205103 to DBE, NIH R01 HL131823 to DBE, NIH R01 HL152256 to DBE, AHA 23PRE1018442 to AJH, and NSF 2205043 to LEP.References
1. Moulin Kévin, Verzhbinsky Ilya A, Maforo Nyasha G, Perotti Luigi E, Ennis Daniel B. Probing cardiomyocyte mobility with multi-phase cardiac diffusion tensor MRI. PloS One. 2020;15(11):e0241996.
2. Nielles-Vallespin Sonia, Scott Andrew, Ferreira Pedro, Khalique Zohya, Pennell Dudley, Firmin David. Cardiac diffusion: technique and practical applications. Journal of Magnetic Resonance Imaging. 2020;52(2):348–368.
3. Moulin Kévin, Croisille Pierre, Feiweier Thorsten, et al. In vivo free-breathing DTI and IVIM of the whole human heart using a real-time slice-followed SE-EPI navigator- based sequence: A reproducibility study in healthy volunteers. Magnetic Resonance in Medicine. 2016;76(1):70–82.
4. Cerqueira Manuel D, Weissman Neil J, Dilsizian Vasken, Jacobs Alice K, Kaul Sanjiv, Laskey Warren K, Pennell Dudley J, Rumberger John A, Ryan Thomas, Verani Mario S. Standardized myocardial segmentation and nomenclature for tomographic imaging of the heart. Circulation, 2002;105(4), 539–542.
5. Andersson Jesper LR, Skare Stefan, Ashburner John. How to correct susceptibility distortions in spin-echo echo-planar images: application to diffusion tensor imaging. Neuroimage. 2003;20(2):870–888.
6. Coll-Font Jaume, Chen Shi, Eder Robert, et al. Manifold-based respiratory phase estimation enables motion and distortion correction of free-breathing cardiac diffusion tensor MRI. Magnetic Resonance in Medicine. 2022;87(1):474–487.
Figures