1813
First Application of a 3D Radial Trajectory for Free-Breathing ECG-Triggered Cardiac T1ρ Mapping at 1.5 T1Department of Diagnostic and Interventional Radiology, Lausanne University Hospital (CHUV) and University of Lausanne (UNIL), Lausanne, Switzerland, 2IHU LIRYC, Electrophysiology and Heart Modeling Institute, INSERM U1045, Centre de recherche Cardio-Thoracique de Bordeaux, Université de Bordeaux, Bordeaux, France, 3Department of Cardiovascular Imaging, Hôpital Cardiologique du Haut-Lévêque, CHU de Bordeaux, Bordeaux, France, 4Center for Biomedical Imaging (CIBM), Lausanne, Switzerland
Synopsis
Keywords: Myocardium, Cardiovascular
Motivation: Most cardiac T1ρ mapping techniques collect data in 2D, while the few existing 3D methods use a Cartesian sampling trajectory.
Goal(s): In this study, we report the first use of a 3D radial trajectory for whole-heart T1ρ mapping at 1.5 T.
Approach: The proposed technique was validated in a phantom, tested in one volunteer, and compared to a 2D reference method.
Results: Our results show that the T1ρ values obtained from our 3D technique are comparable to the 2D reference values for both phantom and volunteer. However, we observed an underestimation of the T1ρ values using the 3D method in the phantom.
Impact: 3D radial free-breathing electrocardiogram-triggered cardiac T1ρ mapping at 1.5 T has the potential to serve as a contrast agent-free adjunct to late gadolinium enhancement imaging for the whole-heart motion-robust quantification of tissue properties such as myocardial fibrosis.
Introduction
T1-rho (T1ρ) mapping of the heart is a promising contrast agent-free method for the quantitative characterization of diseased myocardial tissue properties such as myocardial fibrosis.1 While most T1ρ mapping techniques are 2D and, therefore, not well-suited for whole-heart assessment, a few 3D methods2,3 have been proposed. However, the existing 3D techniques use Cartesian sampling, which is known to be more susceptible to motion artifacts than radial sampling.4 To overcome these limitations, we propose a free-breathing 3D whole-heart myocardial T1ρ mapping sequence at 1.5 T that leverages a motion-robust radial trajectory.Methods
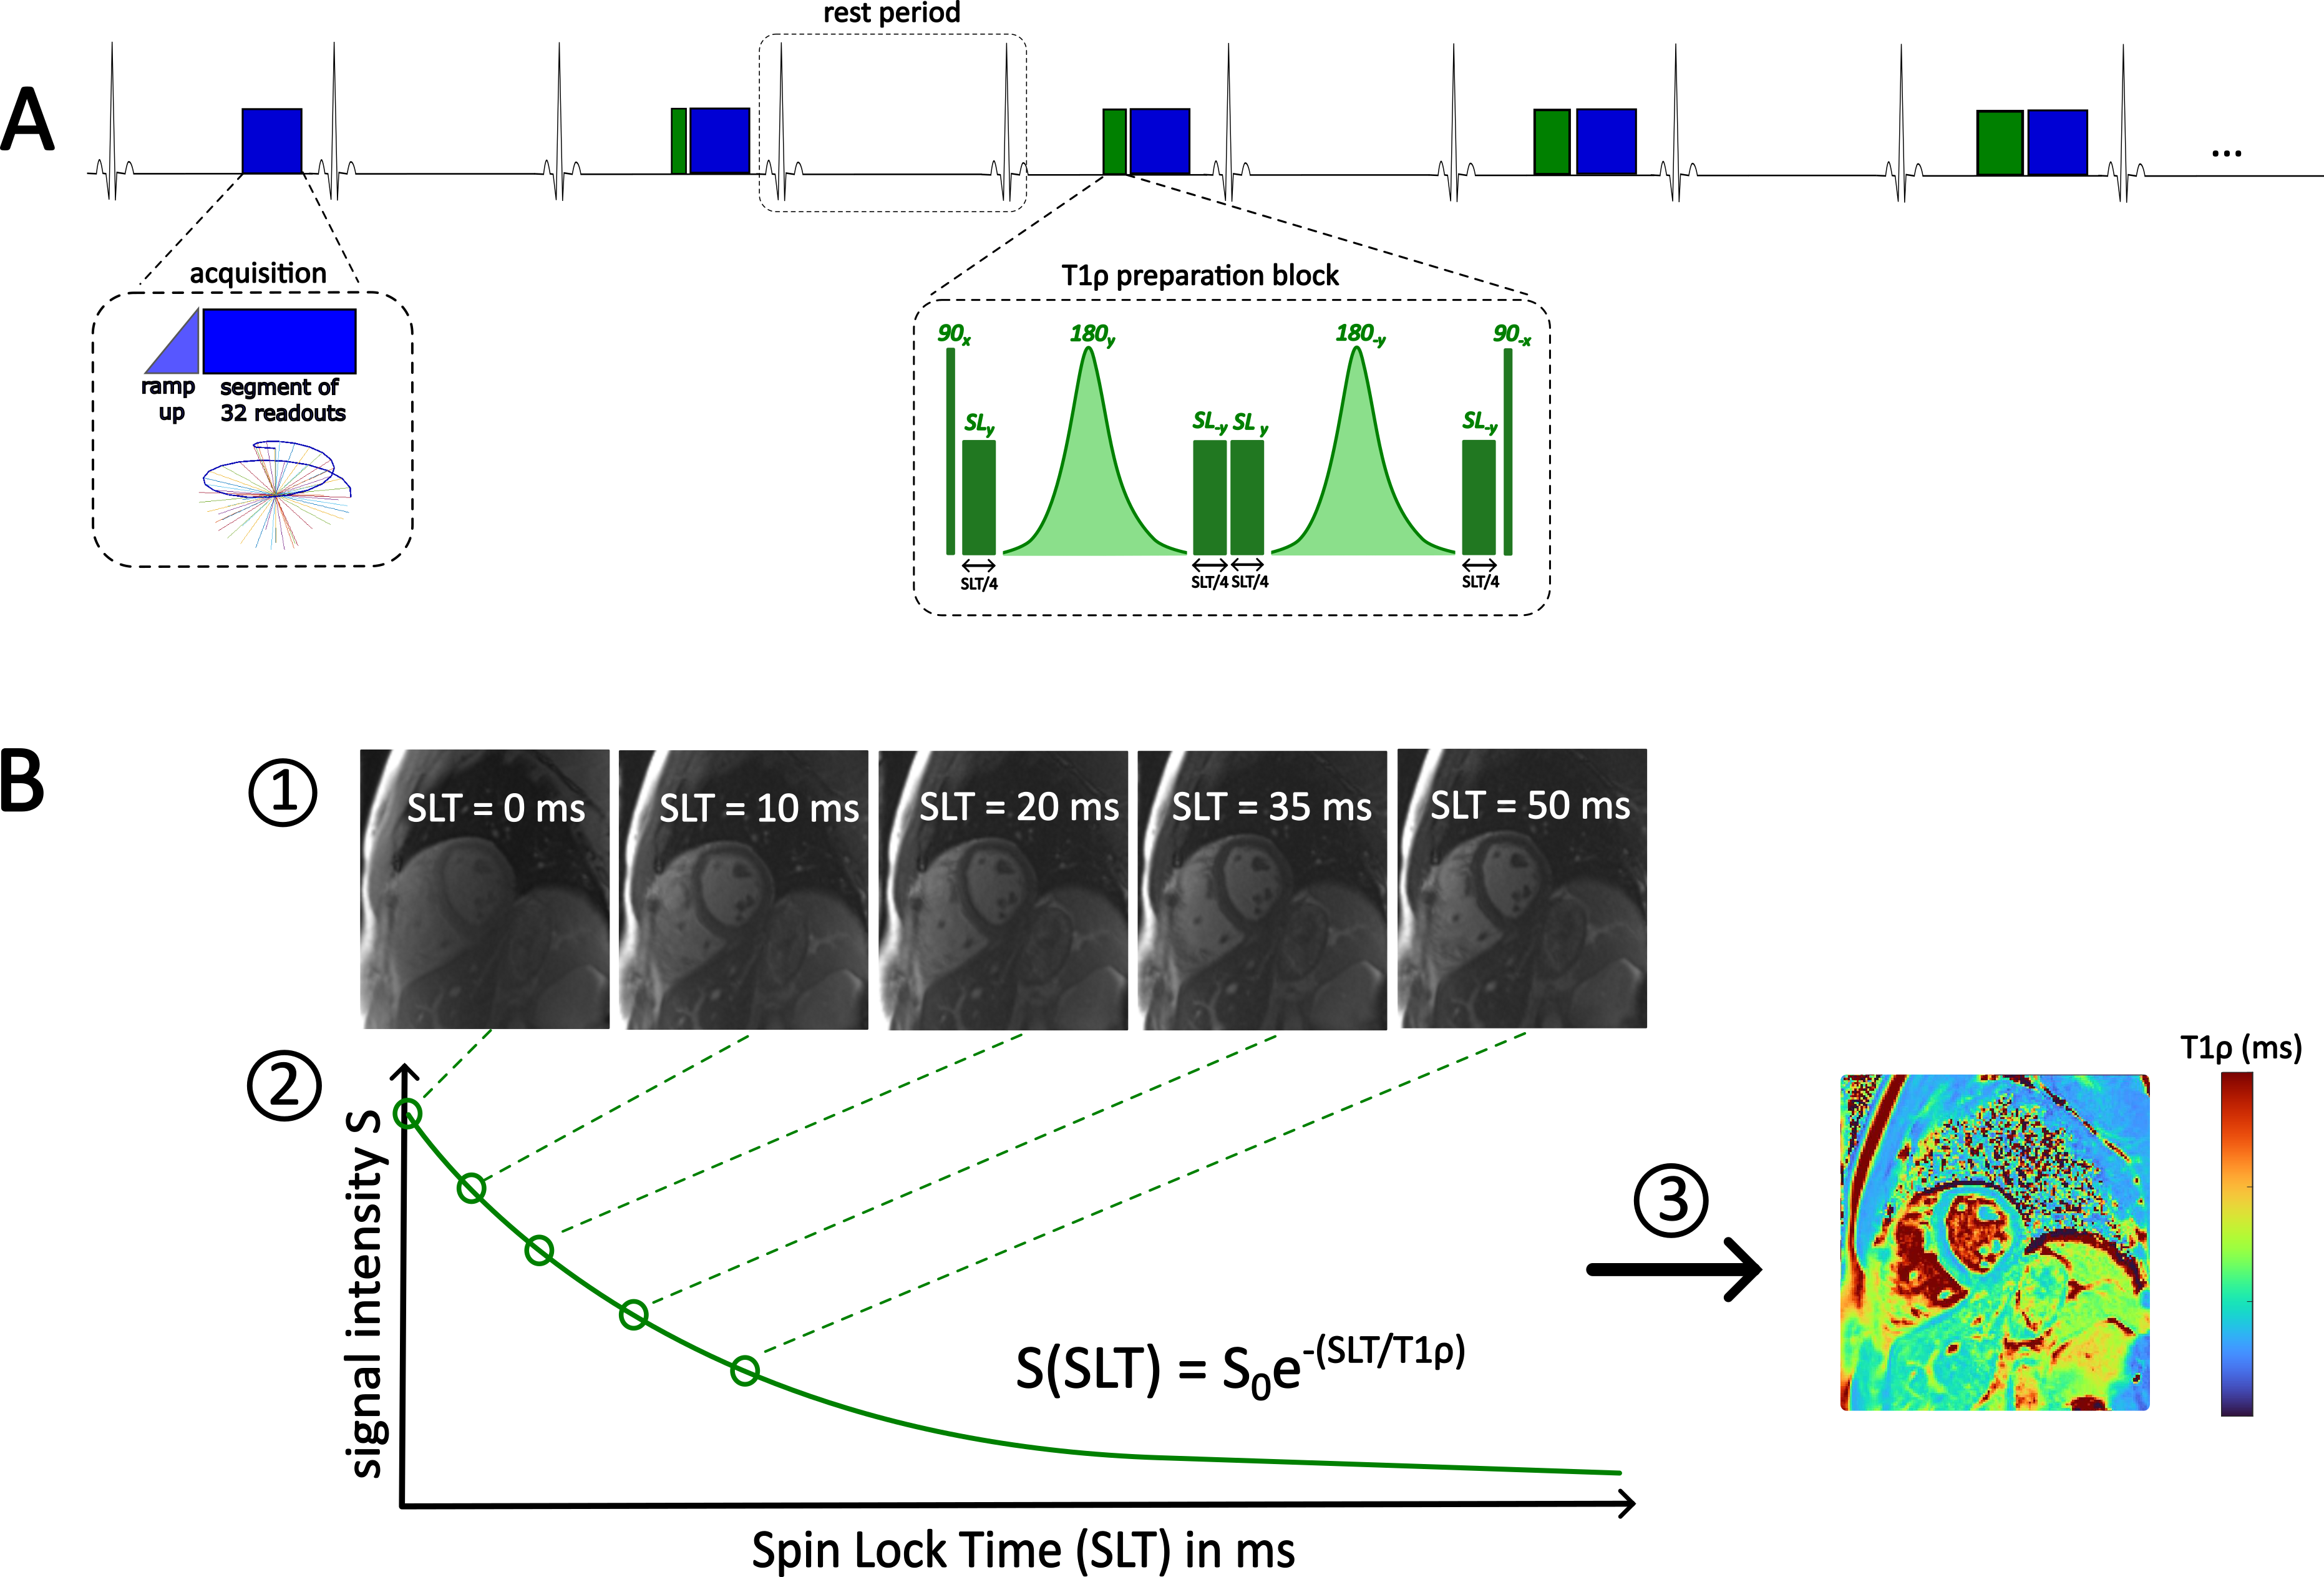
The proposed method (Fig. 1) uses a free-breathing ECG-triggered balanced steady-state free precession (bSSFP) pulse sequence with a 3D spiral phyllotaxis radial trajectory5 (TE/TR=1.29/2.58ms, RF excitation angle=70°, 32 k-space lines per segment, 10 ramp up pulses before each segment, 1076 segments, field of view=(250mm)3, resolution=(1.5mm)3, 2 heartbeats/trigger).For magnetization preparation, T1ρ preparation modules with 5 different spin-lock times (SLT=0/10/20/35/50ms) were applied in an interleaved fashion. The T1ρ preparation module consists of the RF excitation sequence 90x – SLy – 180y – SL-y – SLy – 180-y – SL-y – 90-x with a spin-lock frequency of 500 Hz.
We reconstructed respiratory motion-corrected images with the focused navigation (fNAV)6 technique, which derives 3D rigid motion estimations using the respiratory signal extracted from the patient table. Next, the images were denoised using the HD-PROST patch-based algorithm.7 Finally, the 3D T1ρ map was calculated by fitting the signal intensities of the different T1ρ weighted images to the function S(SLT)=Soe-(SLT/T1ρ), where S is the signal intensity, SLT the spin-lock time, and S0 the equilibrium magnetization.
Data were acquired on a 1.5 T clinical scanner (Magnetom Sola, Siemens Healthcare, Germany). We validated our proposed method in both an agar-NiCl2-gel phantom, as well as in one healthy volunteer (m/29y). Bland-Altman plots and regression analyses were used to compare the T1ρ values derived from our proposed 3D method with those obtained from a 1-slice T1ρ map in short-axis view that was acquired with the previously reported 2D breath-hold single-shot ECG-triggered (3 heartbeats/trigger) bSSFP Cartesian T1ρ mapping sequence.8 For the phantom, we only evaluated the T1ρ values in the vials that contain values relevant for cardiac imaging. For the volunteer, we measured and compared T1ρ values in regions-of-interest drawn within the myocardium and the papillary muscle. Acquisition times were recorded.
Results
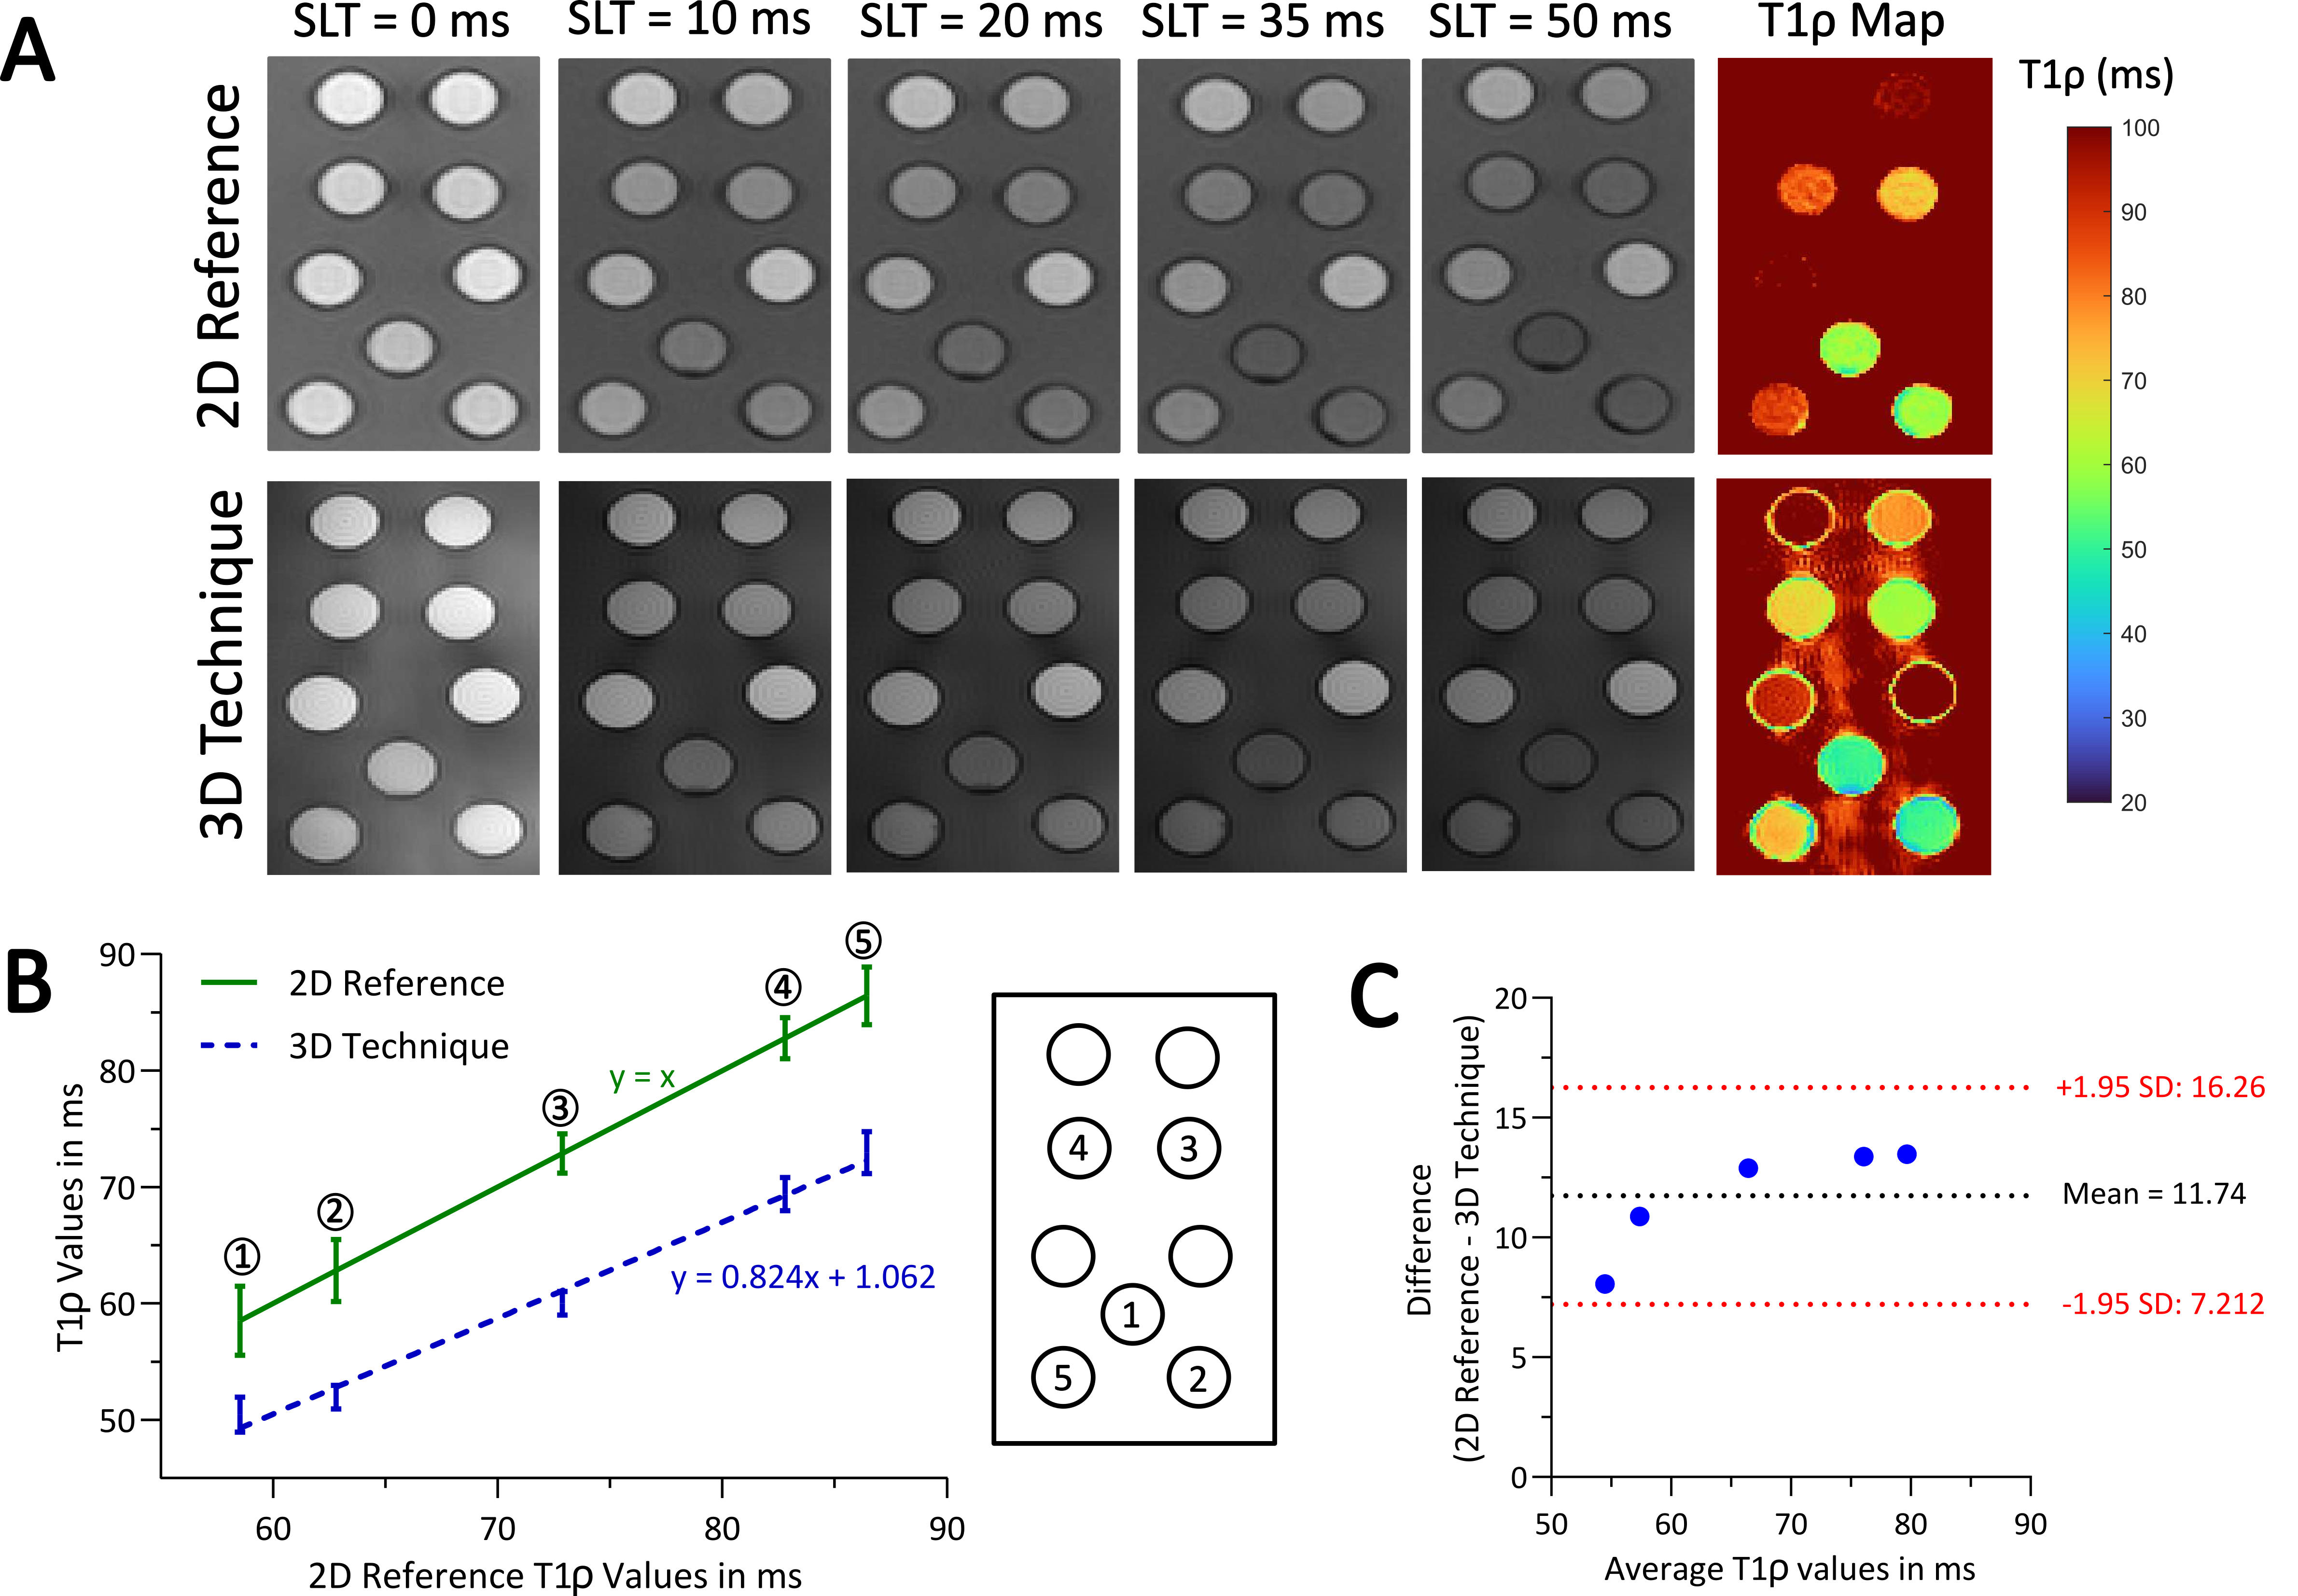
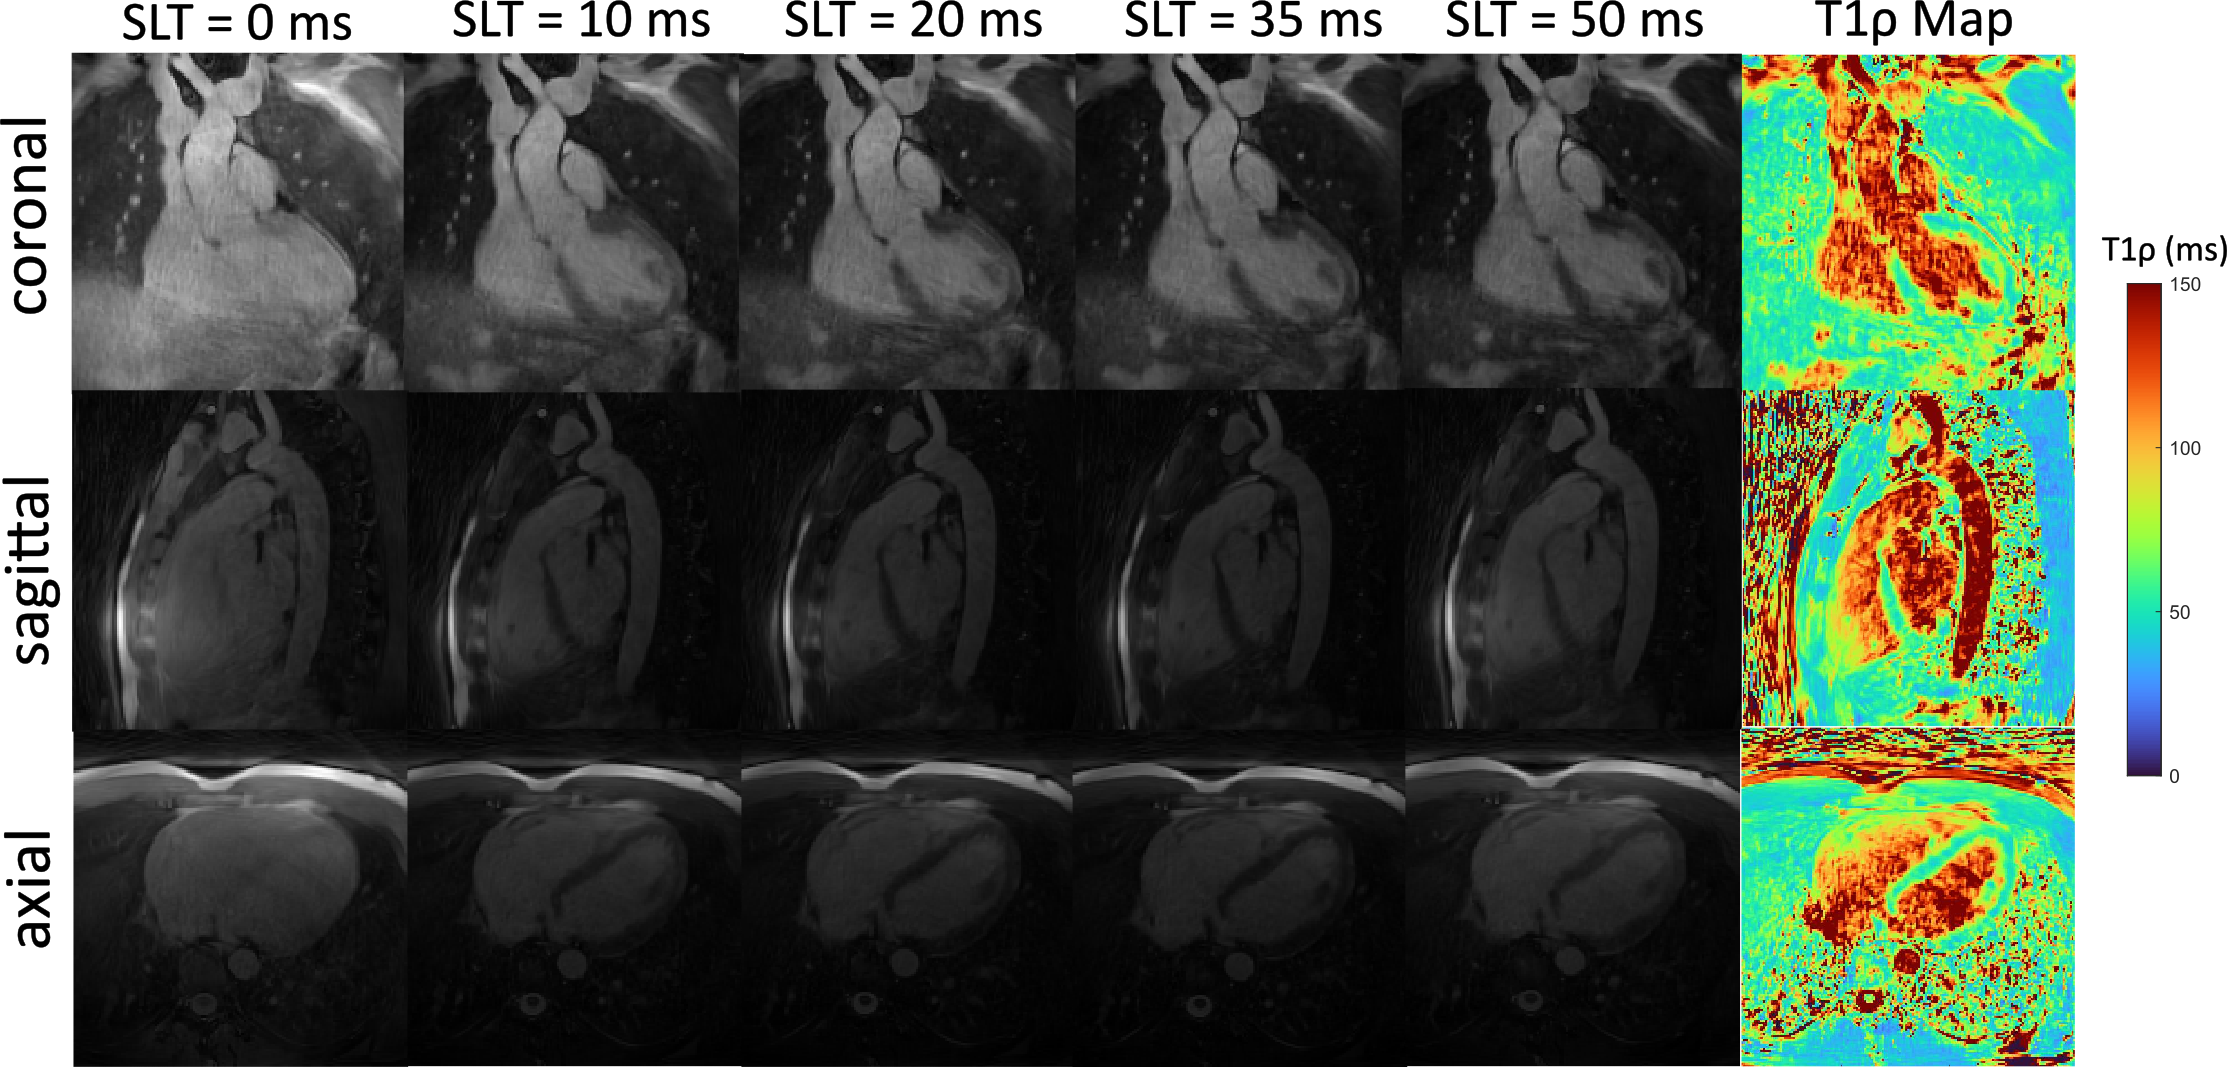
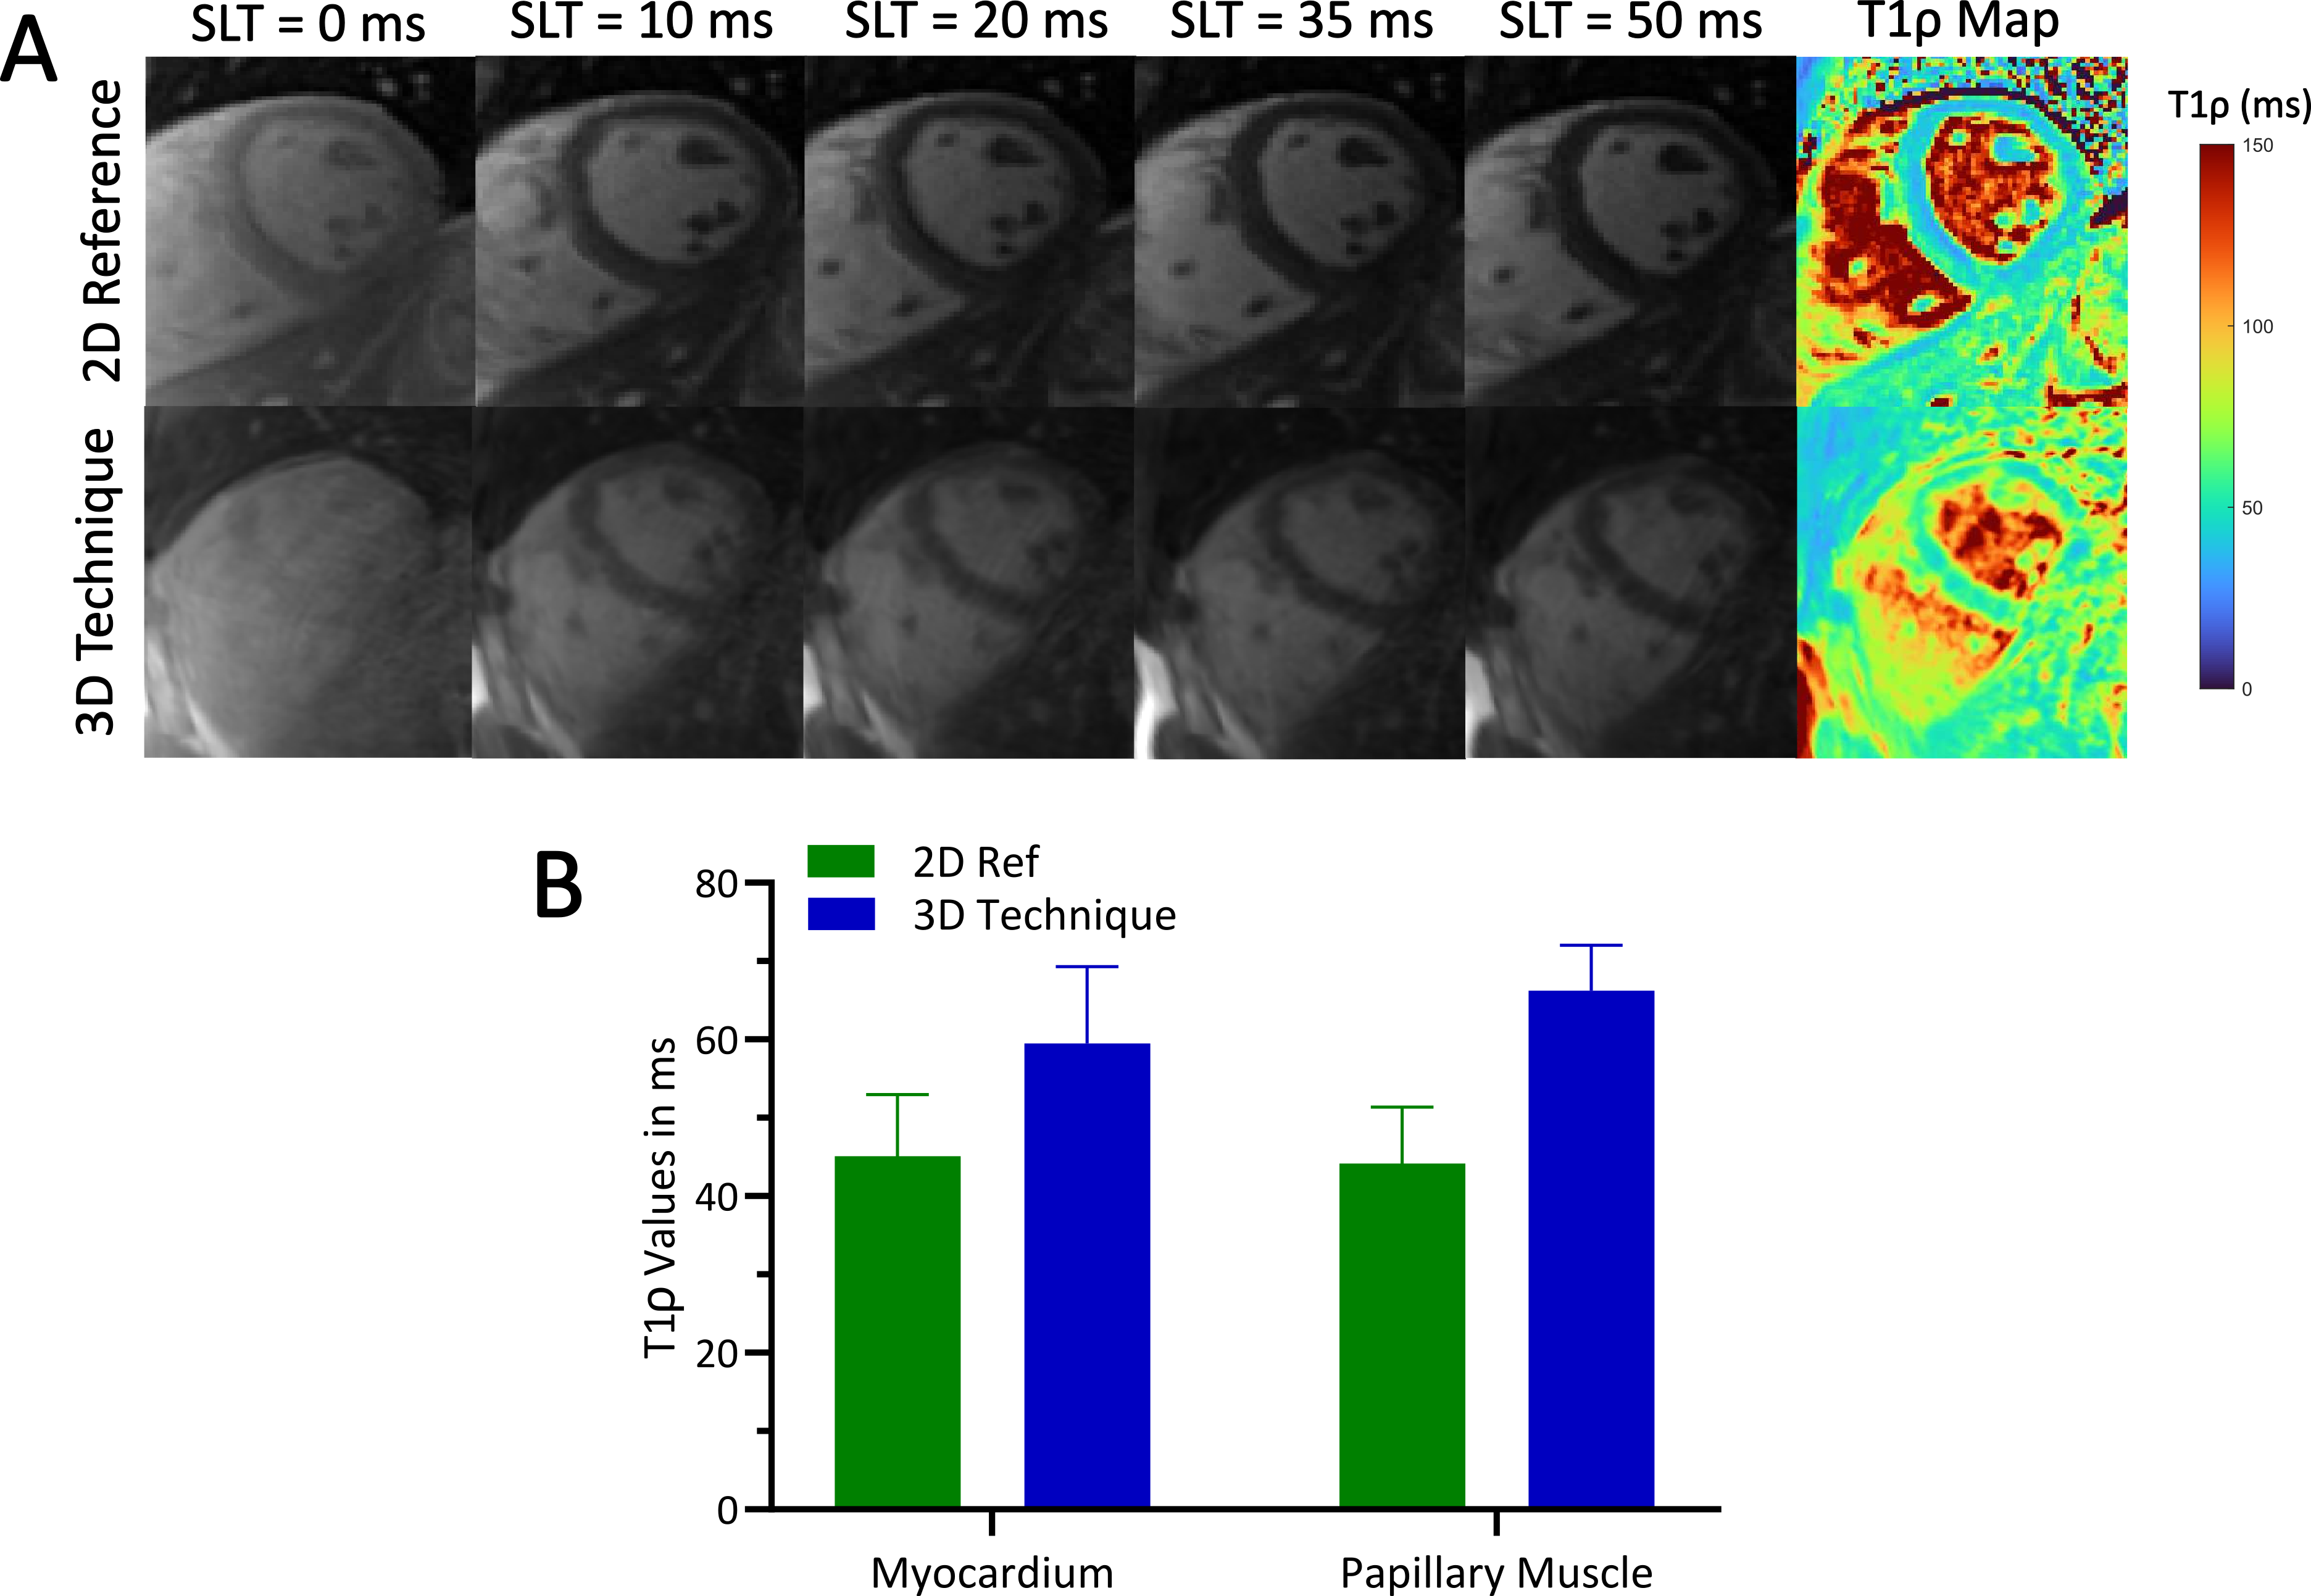
We successfully acquired T1ρ-weighted images with our proposed method and calculated the corresponding 3D T1ρ maps in the phantom (Fig. 2). The T1ρ values for the vials in the myocardial range showed good agreement between our 3D technique and the 2D reference method, with a slope of 0.824 (P<0.0001) for the linear regression (Fig. 2B). However, the Bland-Altman plot suggested a significant bias of 11.74 ms, indicating a systematic underestimation of T1ρ values with our method (Fig. 2C). For the volunteer, the acquisition of the 3D whole-heart T1ρ maps took ~35 min. We successfully reconstructed high-resolution, isotropic, whole-heart T1ρ maps, which enable reformatting in any orientation (T1ρ map in coronal, sagittal, and axial orientation in Fig. 3). The quantitative evaluation of the T1ρ maps in short-axis view (Fig. 4A) showed an overestimation of T1ρ values in the myocardium and the papillary muscle by our proposed 3D method in comparison to the 2D reference (Fig. 4B).Discussion
This preliminary study reports the first application of a 3D radial trajectory for T1ρ mapping of the heart. Our proposed 3D radial technique was assessed in both a phantom and a volunteer. Phantom results showed good correlation to the 2D reference method. However, a slight underestimation of T1ρ values was observed, which might be due to insufficient magnetization recovery, as we used only 2 heartbeats per trigger in comparison to the 2D reference that allows for 3 heartbeats between every T1ρ preparation module. In future studies, this can be accounted for by using dictionary matching instead of exponential fitting for the T1ρ mapping.Our method was successfully applied in vivo in a healthy volunteer. Unlike the phantom results, the T1ρ map obtained in vivo showed a slight overestimation in T1ρ values for both the myocardium and papillary muscle. From our results, the origin of this overestimation is unclear, but it could be attributed to a noise bias in the fit. In future studies, we plan to explore the potential of compressed sensing and low-rank reconstruction as solution to these problems, while also seeking to reduce overall scan time. Moreover, we aim to collect additional data from volunteers to rigorously quantify any potential bias between our 3D method and the 2D reference.
Acknowledgements
This work was supported by funding from the French National Research Agency under grant agreement ANR-22-CPJ2-0009-01 and from the European Research Council (ERC) under the European Union’s Horizon 2020 research and innovation program (grant agreement N°101076351).References
1. Bustin A, Witschey WRT, van Heeswijk RB, Cochet H, Stuber M. Magnetic resonance myocardial T1ρ mapping. J Cardiovasc Magn Reson. 2023;25(1):34. doi:10.1186/s12968-023-00940-1
2. Qi H, Bustin A, Kuestner T, et al. Respiratory motion-compensated high-resolution 3D whole-heart T1ρ mapping. J Cardiovasc Magn Reson. 2020;22(1):12. doi:10.1186/s12968-020-0597-5
3. Qi H, Lv Z, Hu J, et al. Accelerated 3D free-breathing high-resolution myocardial T1ρ mapping at 3 Tesla. Magn Reson Med. 2022;88(6):2520-2531. doi:10.1002/mrm.29417
4. Xie J, Lai P, Huang F, Li Y, Li D. Cardiac magnetic resonance imaging using radial k-space sampling and self-calibrated partial parallel reconstruction. Magn Reson Imaging. 2010;28(4):495-506. doi:10.1016/j.mri.2009.12.018
5. Piccini D, Littmann A, Nielles-Vallespin S, Zenge MO. Spiral phyllotaxis: the natural way to construct a 3D radial trajectory in MRI. Magn Reson Med. 2011;66(4):1049-1056. doi:10.1002/mrm.22898
6. Roy CW, Heerfordt J, Piccini D, et al. Motion compensated whole-heart coronary cardiovascular magnetic resonance angiography using focused navigation (fNAV). J Cardiovasc Magn Reson. 2021;23(1):33. doi:10.1186/s12968-021-00717-4
7. Bustin A, Lima da Cruz G, Jaubert O, Lopez K, Botnar RM, Prieto C. High-dimensionality undersampled patch-based reconstruction (HD-PROST) for accelerated multi-contrast MRI. Magn Reson Med. 2019;81(6):3705-3719. doi:10.1002/mrm.27694
8. Bustin A, Toupin S, Sridi S, et al. Endogenous assessment of myocardial injury with single-shot model-based non-rigid motion-corrected T1 rho mapping. J Cardiovasc Magn Reson. 2021;23(1):119. doi:10.1186/s12968-021-00781-w
Figures