1812
Monitoring Myocardial Alterations in the LGE Grey Zone of Infarction Patients Using T1rho Mapping1The People's Hospital of Ningxia Hui Autonomous Region, yinchuan, China, 2Philips Healthcare, Beijing, China
Synopsis
Keywords: Myocardium, Cardiomyopathy, T1rho
Motivation: This study employs T1rho imaging to examine myocardial changes in the LGE grey zone of patients with myocardial infarction, presenting a possible non-invasive approach for patients who cannot undergo contrast-enhanced procedures.
Goal(s): provide a possible non-invasive approach for patients who are unable to undergo contrast-enhanced surgery.
Approach: This study employs T1rho imaging to examine myocardial changes in the LGE gray area in patients with myocardial infarction.
Results: T1rho localization provides a viable diagnostic tool for the detection of diffuse myocardial fibrosis in patients with infarction.
Impact: This study explores the potential of T1rho in evaluating the tissue characteristics of gray myocardium adjacent to infarcted myocardium to provide a new clinical, non-invasive, accurate, and contrast-free method for monitoring diffuse fibrosis in the myocardium.
Methods
Data acquisitionAll CMR data were acquired on a 3.0T scanner (Ingenia CX, Best, The Netherlands). Our cohort included 38 myocardial infarction patients identified as LGE-positive and 17 healthy volunteers. The imaging protocol incorporated routine sequences and T1rho mapping performed prior to contrast injection. The CMR imaging protocol consisted of routine sequences (CINE, native T1, after 10 min, LGE, and enhanced T1) Data analysisAll CMR analysis was performed by the same CMR technician using commercial software CVI42 version 5.2 (Circle Cardiovascular Imaging Inc, Calgary, Canada). In LGE-positive patients, the LGE areas were divided into LGE core (5SDs above remote myocardium), grey area (between 2–5 SDs remote myocardium), and remote area(2 SD below remote myocardium)according to the signal intensity of LGE. Overall native T1, T1rho, ECV values in the normal controls and core, gray, remote area native T1, T1rho, ECV values in the LGE positive patients were measured. The increased percentof T1 value (IPT1) was used to evaluate the changed degree of native T1 from baseline (healthy volunteer). We calculate IPT1, IPT1rho, IPECV, the formula is as follows: IPT1/IPT1rho/IPECV=(T1/T1rho/ECV value of patient-meanT1/T1rho/ECV value of normal control)/mean T1/T1rho/ECV value of normal control×100%.Statistical analysis All data was performed using SPSS 21.0 software. Continuous variables were expressed as mean ± standard deviation or median, interquartile range, and categorical variables were presented as numbers and percentages. The normality test was performed using the Shapiro-Wilk test. Native T1, T1rho, and ECV values were compared using a rank-sum test or single-factor analysis of variance, and pairwise comparisons were performed using the LSD method. The diagnostic accuracy and optimal cut-off value of native T1, T1rho, and ECV values to detect focal and diffuse fibrosis were evaluated using ROC analysis. The correlation of native T1, T1rho, and ECV values were assessed by a Spearman and Pearson correlation analysis. All the comparisons and correlations were two-tailed, P<0.05 was considered statistically significant.Results
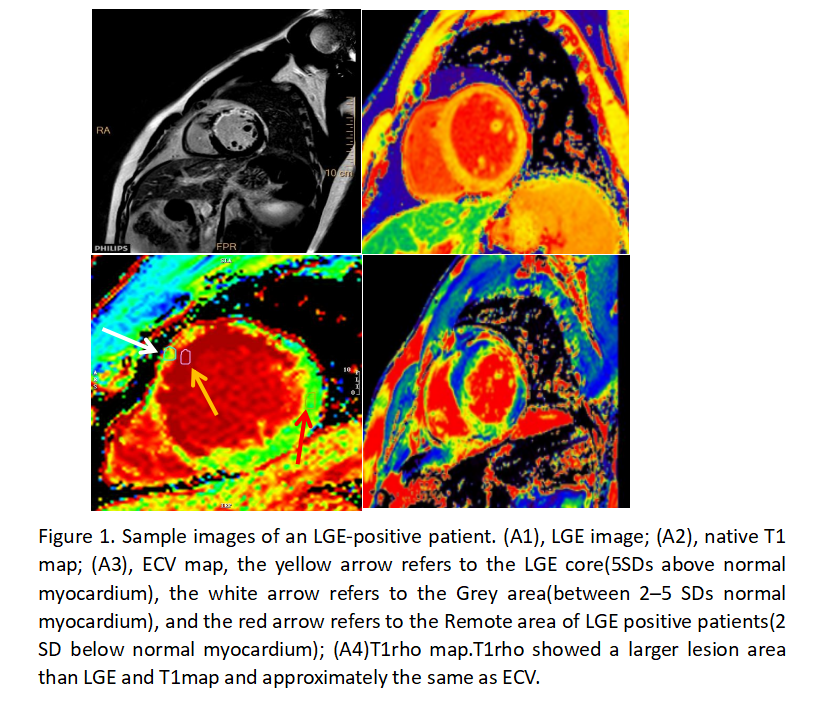
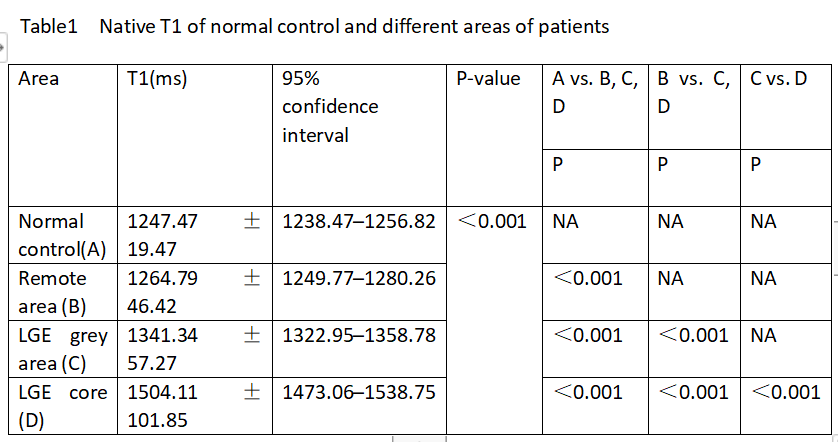
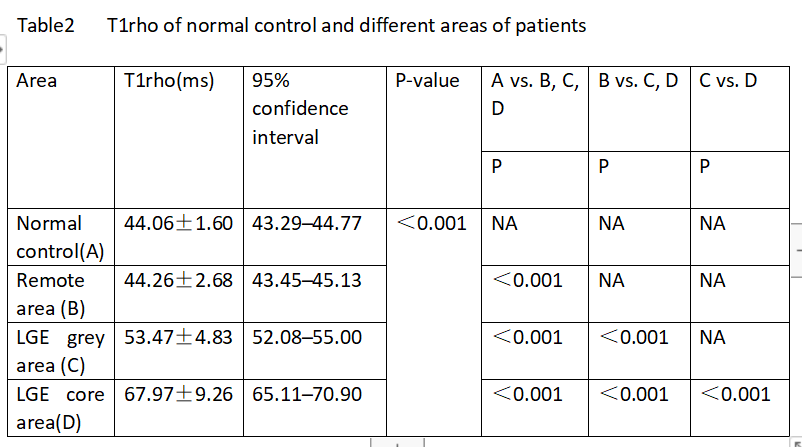
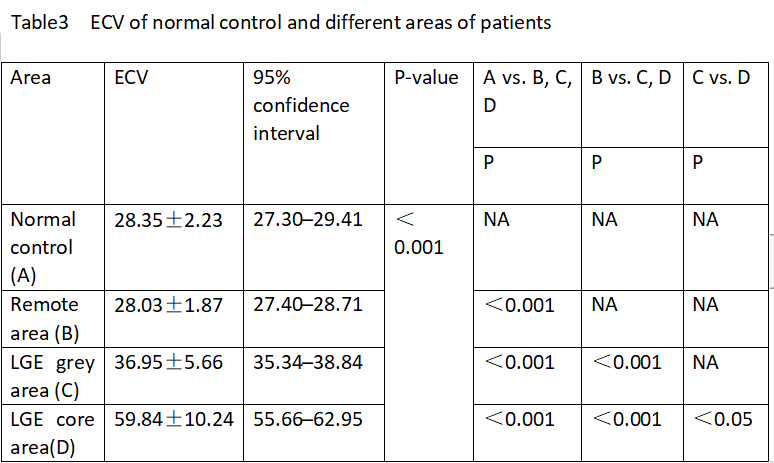
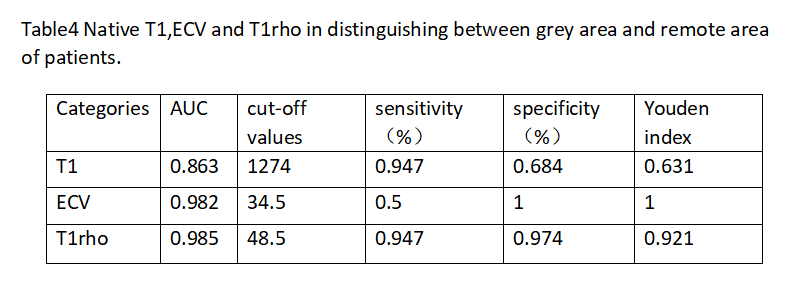
The ROI placement and mean native T1, T1rho, and ECV values of one patient are shown in Figure 1. There were significant differences in native T1, T1rho, and ECV values among four different types of myocardia (LGE core, grey area, remote area, and normal control, P<0.001). IPECV(0.30) was significantly higher than IPT1(0.08) and IPT1rho(0.21) in a grey area, and IPT1rho was significantly higher than IPT1.On ROC analysis, T1rho was a more robust discriminator between the LGE grey area and remote area of patients (AUC: 0.985 vs. 0.863 and 0.982) than native T1 and ECV, and its Youden index reached 0.921. Although ECV has the highest Youden index, it has the lowest sensitivity (0.5). The best cut-off value for T1rho to identify grey area is 48.5 ms(sensitivity of 94.7% and specificity of 97.4%). Native T1 values, T1rho values, and ECV of all ROIs of patients were adopted for correlation analysis. Both native T1 values (Spearman’s r=0.817) and T1rho values (Spearman’s r=0.888) were significantly correlated with ECV(both P<0.001). Besides, native T1 values and T1rho values were also positively correlated (Pearson’s r=0.776, P<0.001)。Discussion
This study has identified a sensitive index for detecting myocardial changes in infarction patients without needing contrast agents. LGE is currently the definitive standard for the in vivo identification of localized myocardial fibrosis, while extracellular volume fraction (ECV) offers a quantitative measure of localized and diffuse fibrosis. However, these modalities typically require gadolinium-based contrast agents, which carry the risk of inducing nephrogenic systemic fibrosis, especially in patients with compromised renal function.T1rho imaging emerges as a promising alternative, capable of assessing myocardial fibrosis without using contrast materials. The findings of this investigation reveal that both T1rho and ECV measurements in the myocardial gray areas of LGE-positive patients are significantly elevated compared to remote areas, with statistical significance (P < 0.05) and a strong correlation observed between the two indices. These results underscore the utility of T1rho mapping as a viable and safer alternative, particularly beneficial for patients in which gadolinium-based contrast use is contraindicated or poses significant health risks.Conclusion
T1rho mapping presents a viable diagnostic tool for detecting diffuse myocardial fibrosis in infarction patients, offering a beneficial alternative for those contraindicated for gadolinium-based contrast agents and potentially surpassing native T1 and ECV in identifying myocardial changes within the LGE gray areas.Introduction
In this investigation, we examined native T1, T1rho, and ECV values in healthy controls and in various regions of myocardial infarction to determine the effectiveness of T1rho in assessing diffuse fibrosis in the myocardial gray areas of patients, regardless of LGE presence. This study also explores an alternative diagnostic method for patients without contrast-enhanced imaging.Acknowledgements
No Acknowledgements foundReferences
[1] Nacif MS, Arai AE, Lima JAC, Bluemke DA. Gadolinium-enhanced cardiovascular magnetic resonance: administered dose in relationship to United States Food and Drug Administration (FDA) guidelines. J Cardiovasc Magn Reson. 2012; 14:18.
[2] Broberg CS, Chugh SS, Conklin C, Sahn DJ, Jerosch-Herold M. Quantification of diffuse myocardial fibrosis and its association with myocardial dysfunction in congenital heart disease. Circ Cardiovasc Imaging 2010;3:727–34.
[3] Witschey W, Pilla J, Kevin FG, Koomalsingh. Rotating frame spin lattice relaxation in a swine model of chronic, left ventricular myocardial infarction. Magn Reson Med. 2010; 64:1453–60
Figures