1811
3D Cardiac T1p Mapping using XD-GRASP Reconstruction: Initial Evaluation in Patients with Ischemic and Non-ischemic Cardiomyopathy1Radiology, Northwestern University, Feinberg School of Medicine, Chicago, IL, United States, 2Cardiology, Northwestern University, Feinberg School of Medicine, Chicago, IL, United States, 3Cardiology, Lurie Children’s Hospital, Chicago, IL, United States, 4Electrical and Computer Engineering, Northwestern University, Evanston, IL, United States, 5Radiology, Lurie Children’s Hospital, Chicago, IL, United States, 6Radiology, University of Pennsylvania Perelman School of Medicine, Philadelphia, PA, United States
Synopsis
Keywords: Myocardium, Cardiovascular, Fibrosis
Motivation: T1ρ mapping is an emerging non-contrast pulse sequence for measuring cardiac fibrosis, but current techniques suffer from lack of coverage, poor spatial resolution, and long scan time.
Goal(s): We aimed to develop an accelerated, free-breathing 3D cardiac T1ρ mapping pulse sequence using XD-GRASP reconstruction extended to include both respiratory and spin-locking time dimensions.
Approach: Our 3D T1ρ sequence was tested in 12 patients undergoing clinically indicated cardiac MRI to compare T1ρ with extracellular volume fraction (ECV) and late gadolinium enhancement (LGE).
Results: Myocardial T1ρ correlates with ECV of non-ischemic myocardium but not with a mixture of acute and chronic ischemic myocardium.
Impact: 3D T1ρ mapping achieves robust image quality and T1ρ values that agree with literature. 3D T1ρ could be used for measuring fibrosis in patients where contrast should be avoided, after further research into the nature of T1ρ in focal scar.
Introduction
T1ρ mapping is a non-contrast pulse sequence that can be used to detect both focal[1-3] and diffuse[4, 5] myocardial fibrosis. Despite its potential for assessment of fibrosis in pediatric patients and adult patients with chronic kidney disease, cardiac T1ρ mapping suffers from several technical limitations including poor spatial resolution and long scan time (up to 18 min)[6, 7]. Therefore, in this study, we sought to address these limitations by developing an accelerated 3D cardiac T1ρ mapping pulse sequence using a stack-of-stars k-space sampling pattern and XD-GRASP[8] reconstruction and evaluated it in non-ischemic cardiomyopathy (NICM) and ischemic cardiomyopathy (ICM) patients.Methods
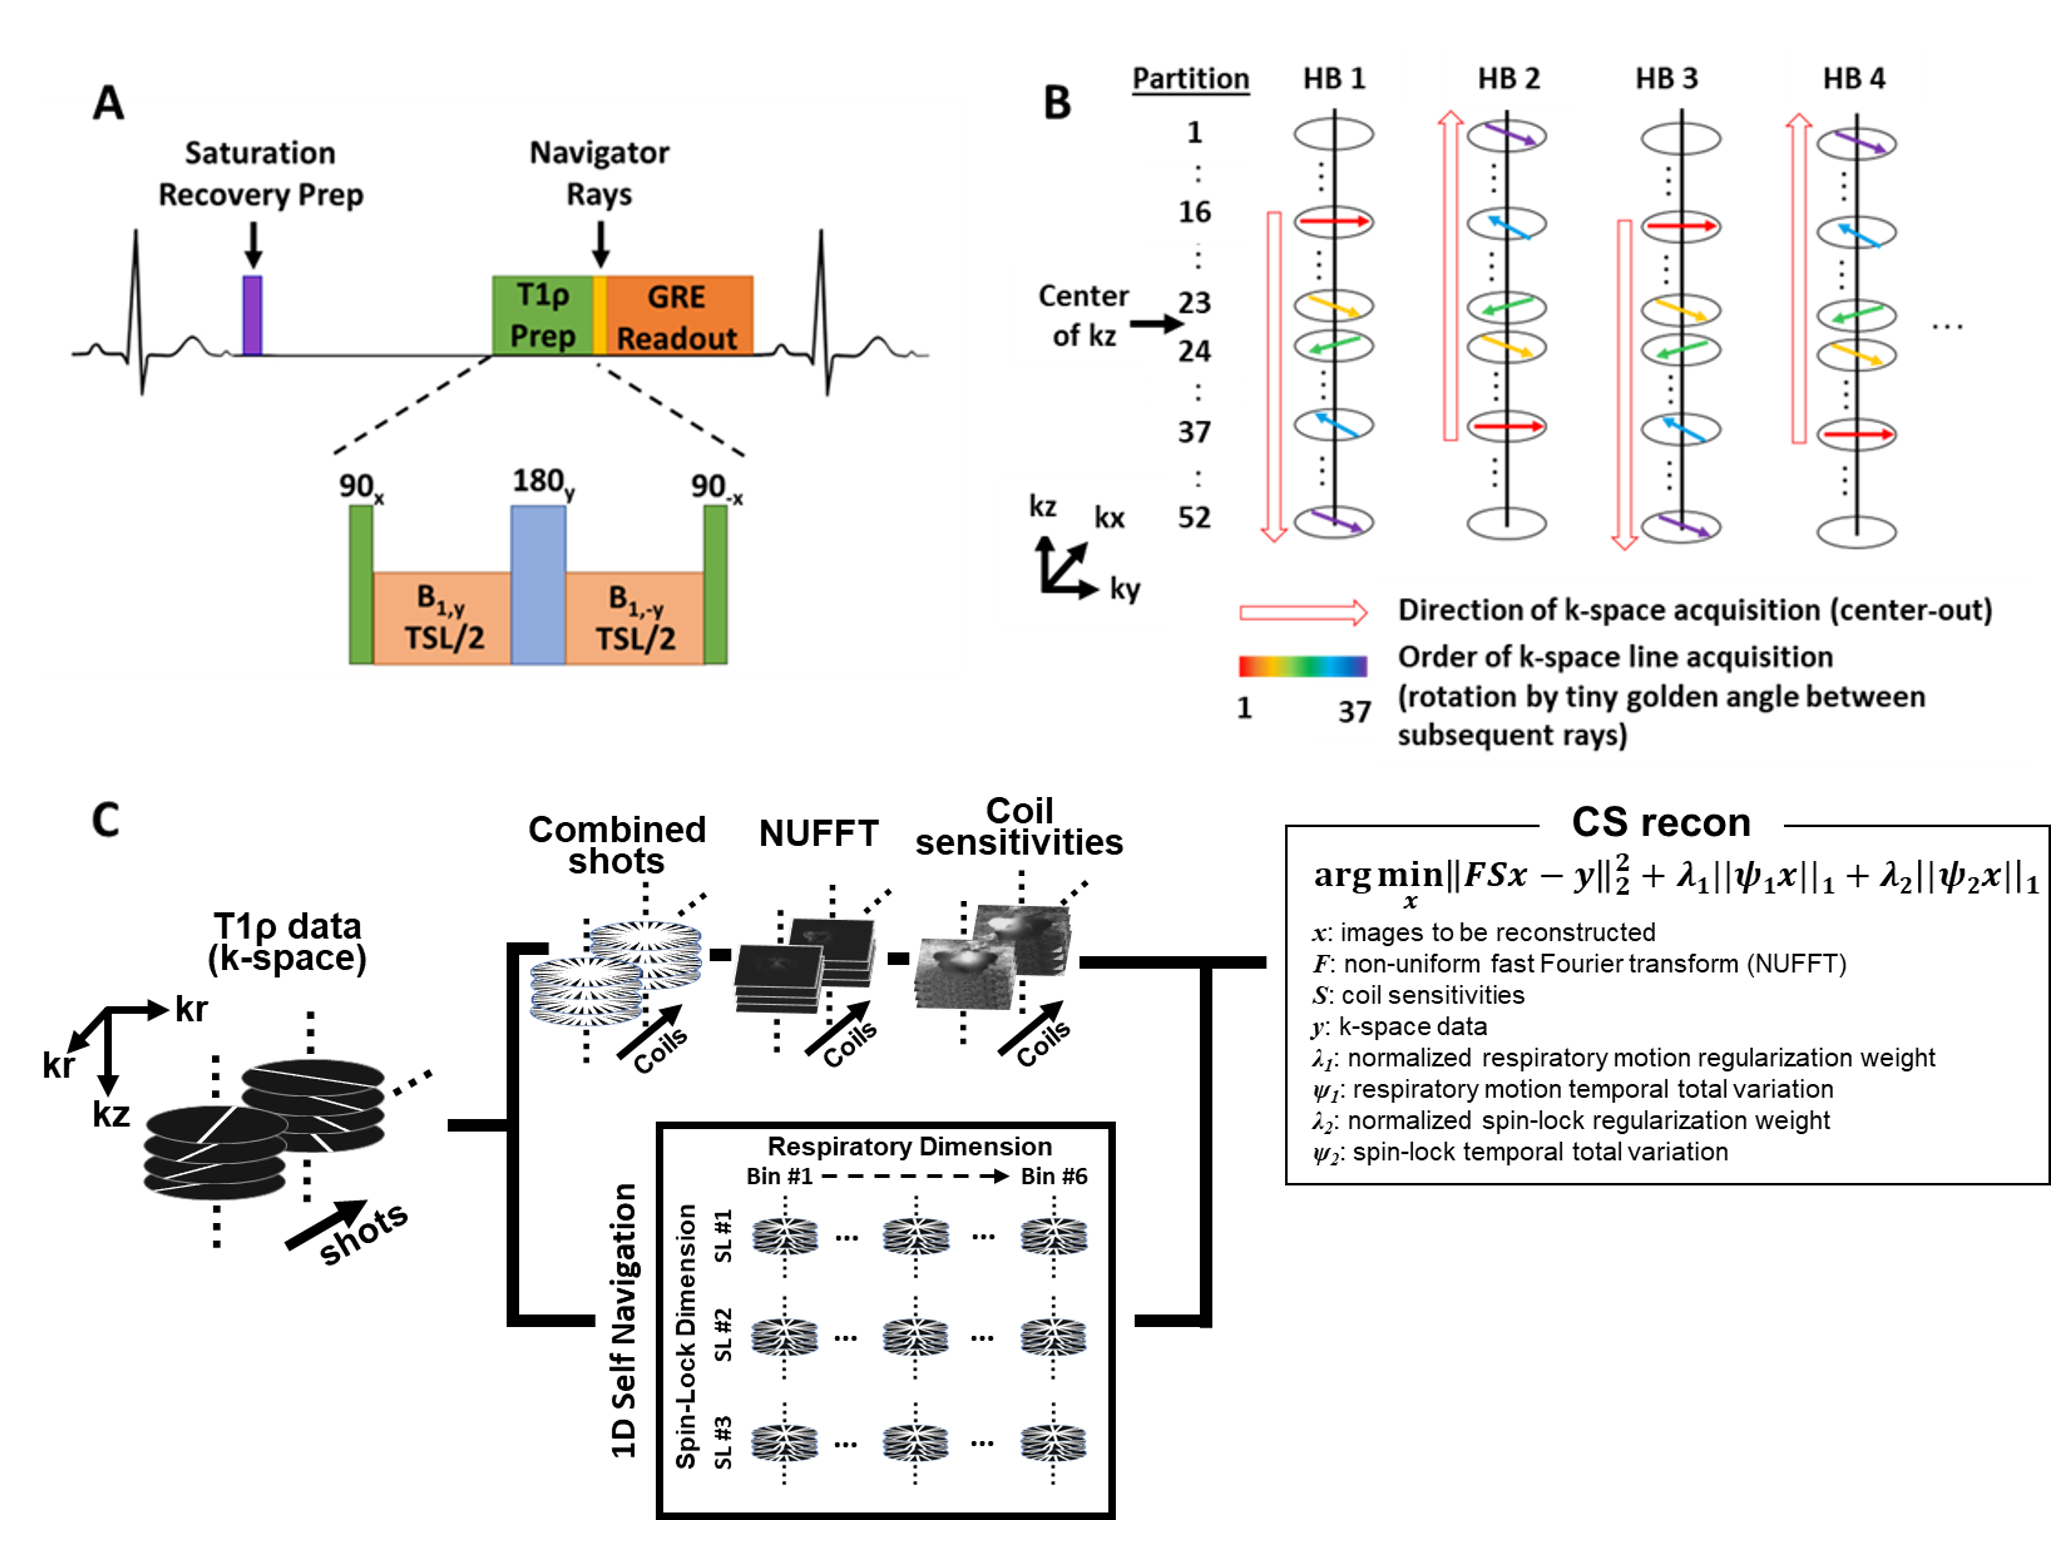
Subjects: We studied 12 patients (8 NICM, 58 ± 19 years, 5 males; 4 ICM, 66 ± 12 years, 3 males) who had clinically scheduled cardiac MRI at 1.5T (MAGNETOM Avanto, Siemens); clinical MRI protocol included native T1 mapping, post-contrast T1 mapping, and 2D late gadolinium enhancement (LGE). 3D T1ρ mapping was added prior to contrast agent administration.Pulse Sequence & Reconstruction: We modified a previously described 3D LGE pulse sequence[9] using a stack-of-stars k-space sampling pattern and XD-GRASP reconstruction[8]; in the modified sequence, we added a B1-insensitive saturation pulse[10] to reset the longitudinal magnetization for each heartbeat (HB) prior to a T1ρ preparation pulse (90x–B1y–180y–B1-y–90-x) with B1 = 500 Hz[6] and 3 T1ρ-weighting spin-lock times (TSL = 0, 35, 50 ms) (Figure 1A). Data were collected alternating center-out to fill 52 partitions of the 3D volume (Figure 1B). Prior to each single-shot GRE readout (flip angle = 15°), two rays oriented along the head-to-foot direction were sampled for self‐navigation of respiratory motion[11]. 3D T1ρ was imaged in a coronal view with field-of-view of 384 mm x 384 mm x 108 mm and spatial resolution of 2 mm3. The scan time was 450 HBs (150 HBs for each TSL). The 3D T1ρ data were reconstructed using the XD-GRASP framework[8] extended to include both respiratory and TSL times as dimensions (Figure 1C).
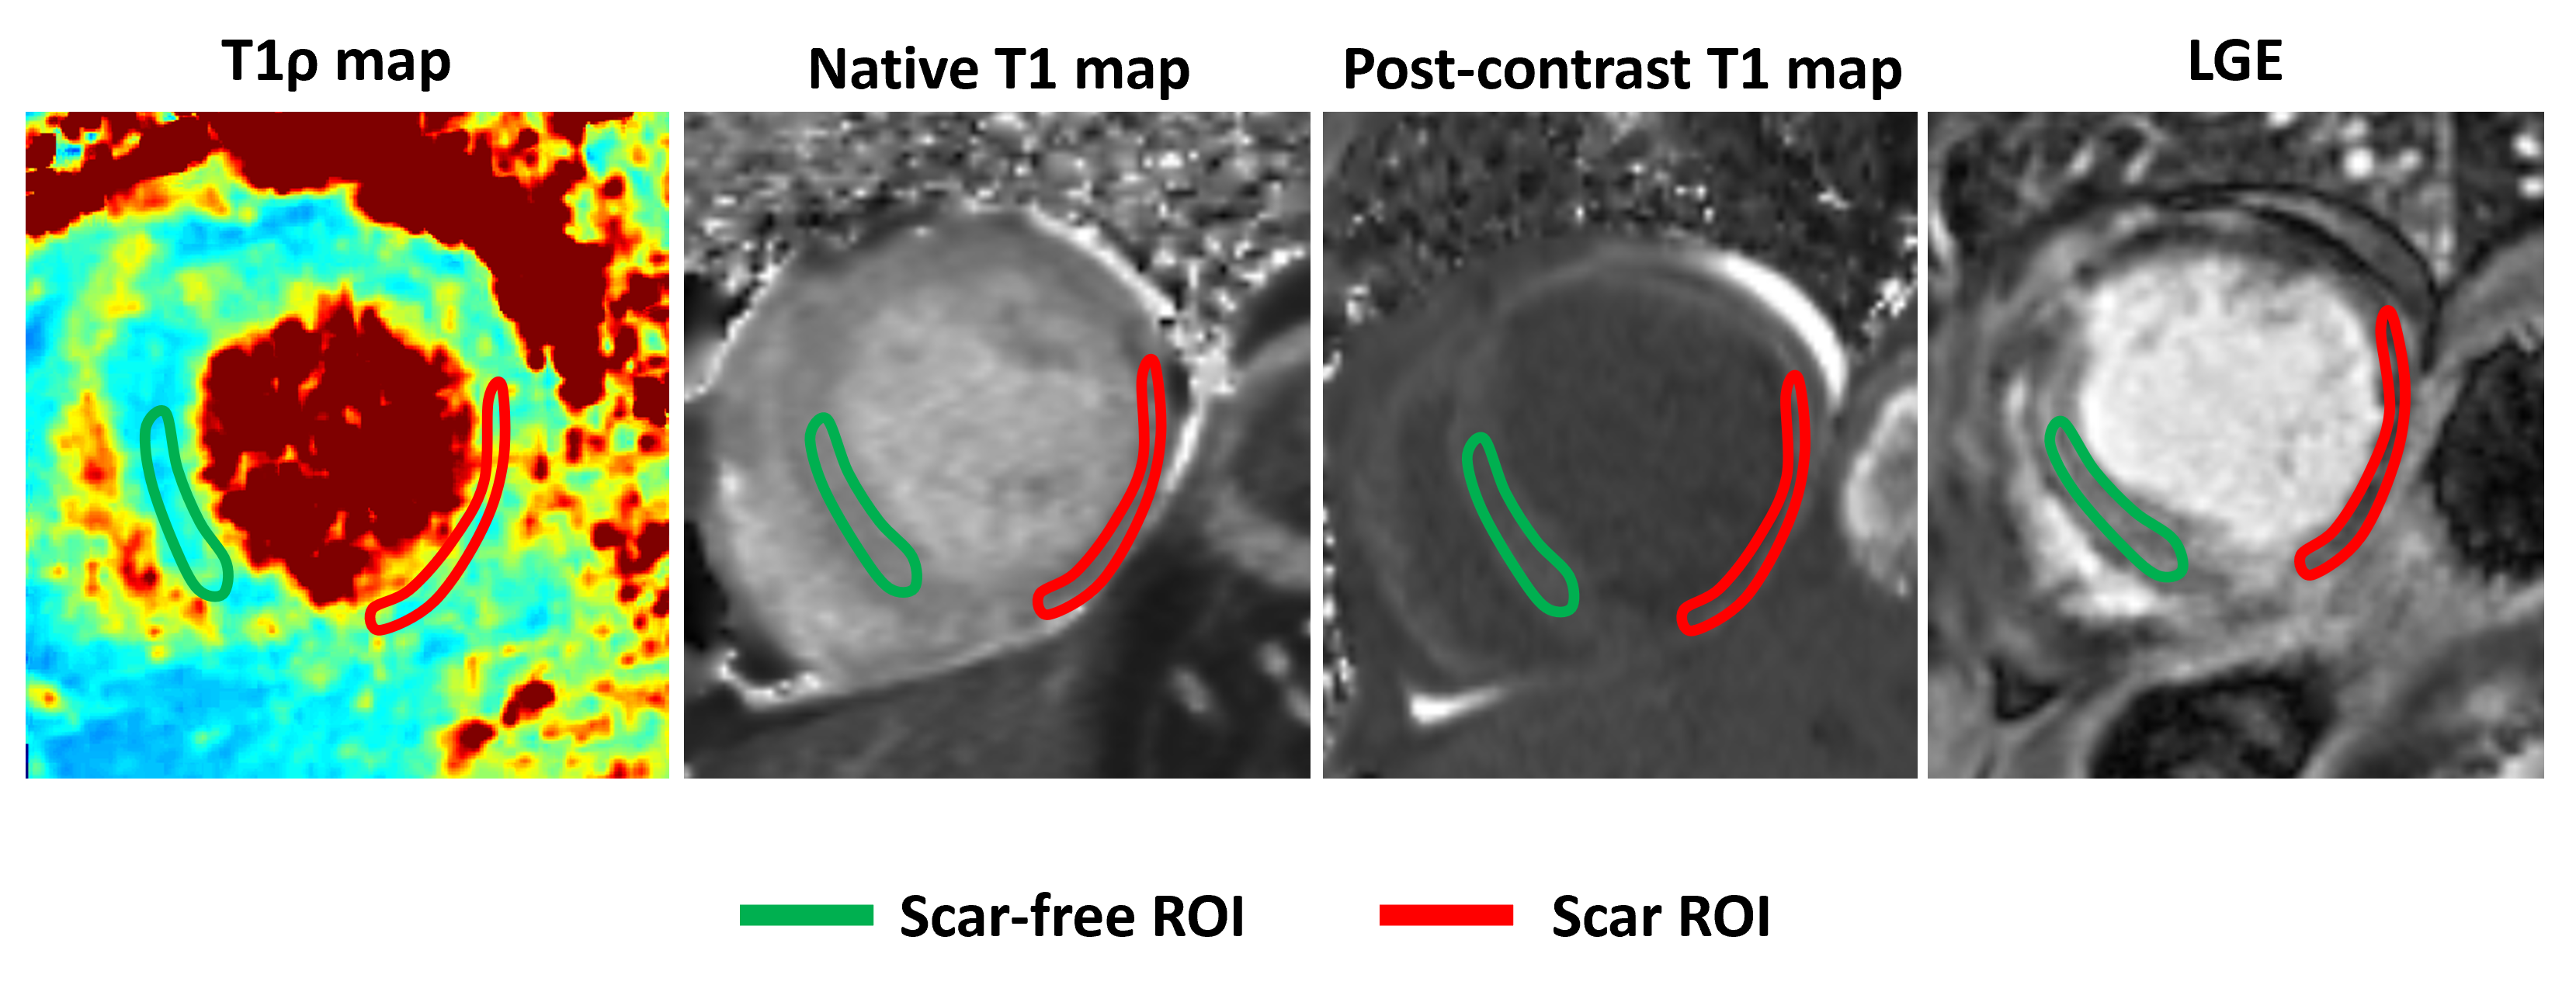
Analysis: T1ρ maps were generated by fitting a two parameter signal model given by S=S0e(−TSL/T1ρ)[12] where S0 is the initial magnetization after the saturation pulse and TSL is the spin-lock duration, using MATLAB (MathWorks). 3D T1ρ was reformatted to the short-axis plane to match T1 mapping and LGE, and contours were drawn to corresponding scar and scar-free regions of interest (ROI) for all slices using CVi42 (Circle Cardiovascular Imaging) (Figure 3). The contours of T1 maps were used to calculate the corresponding extracellular volume fraction (ECV) as previously described[13].
Results
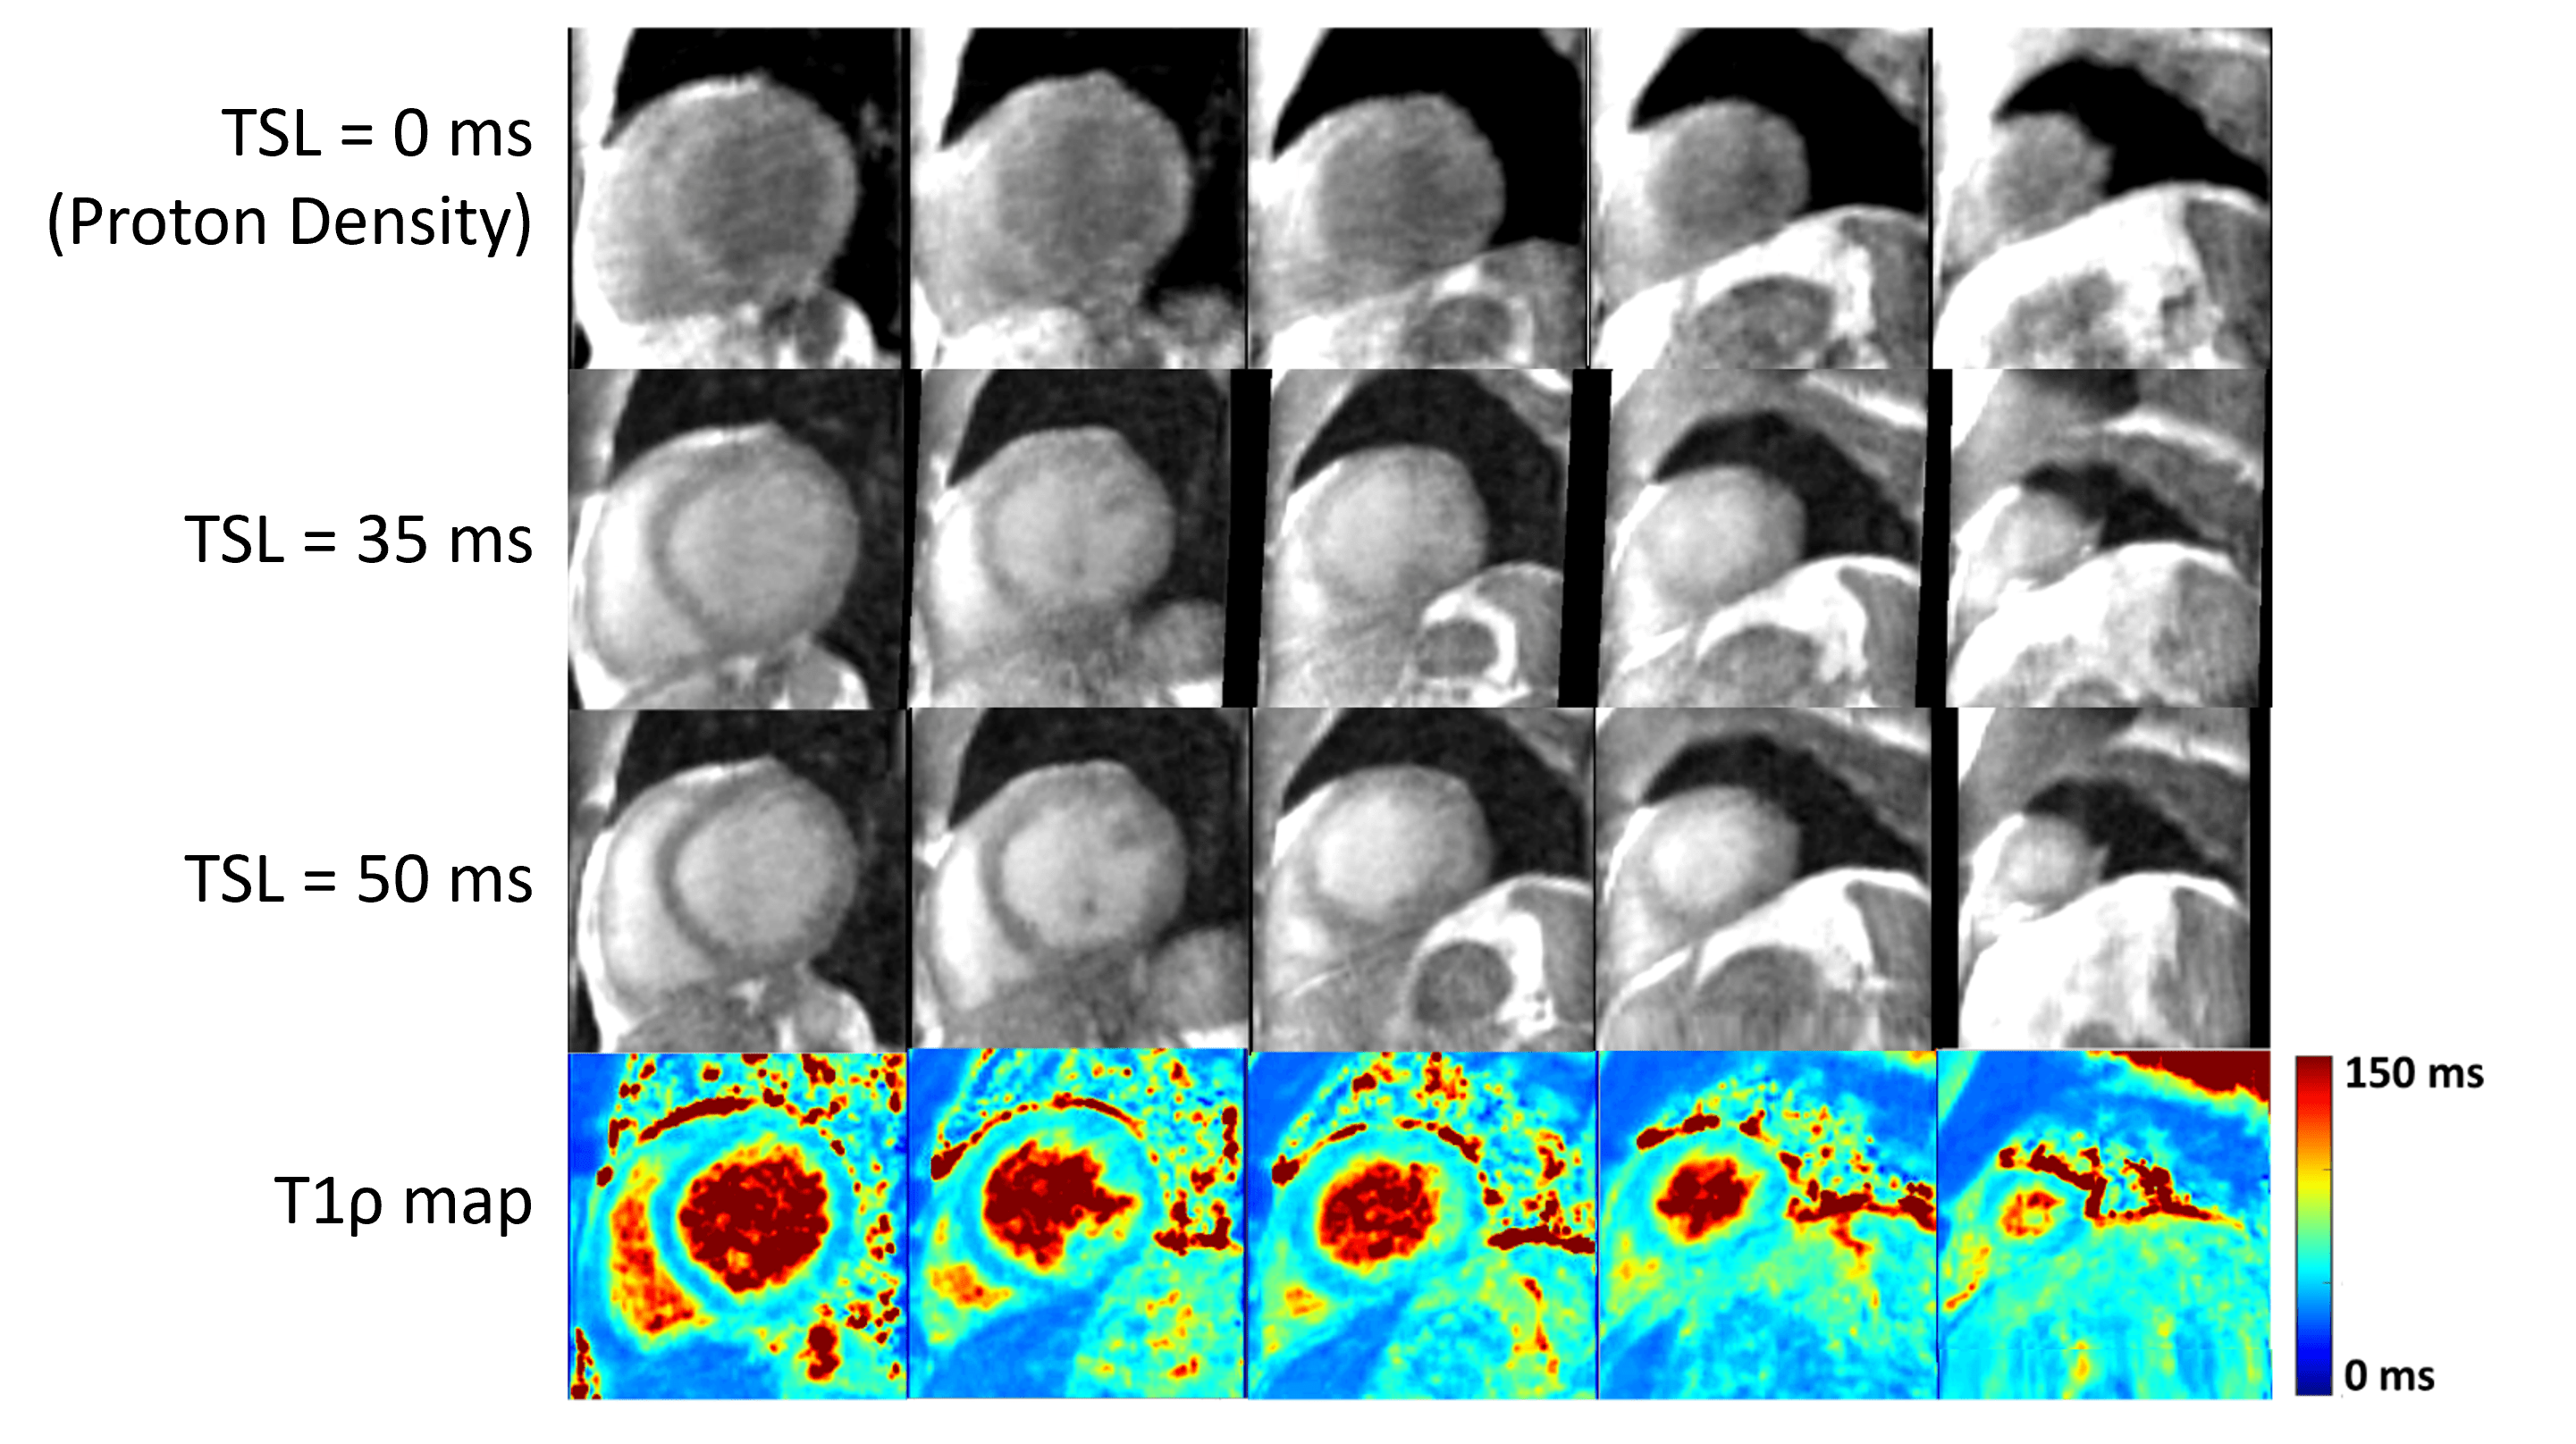
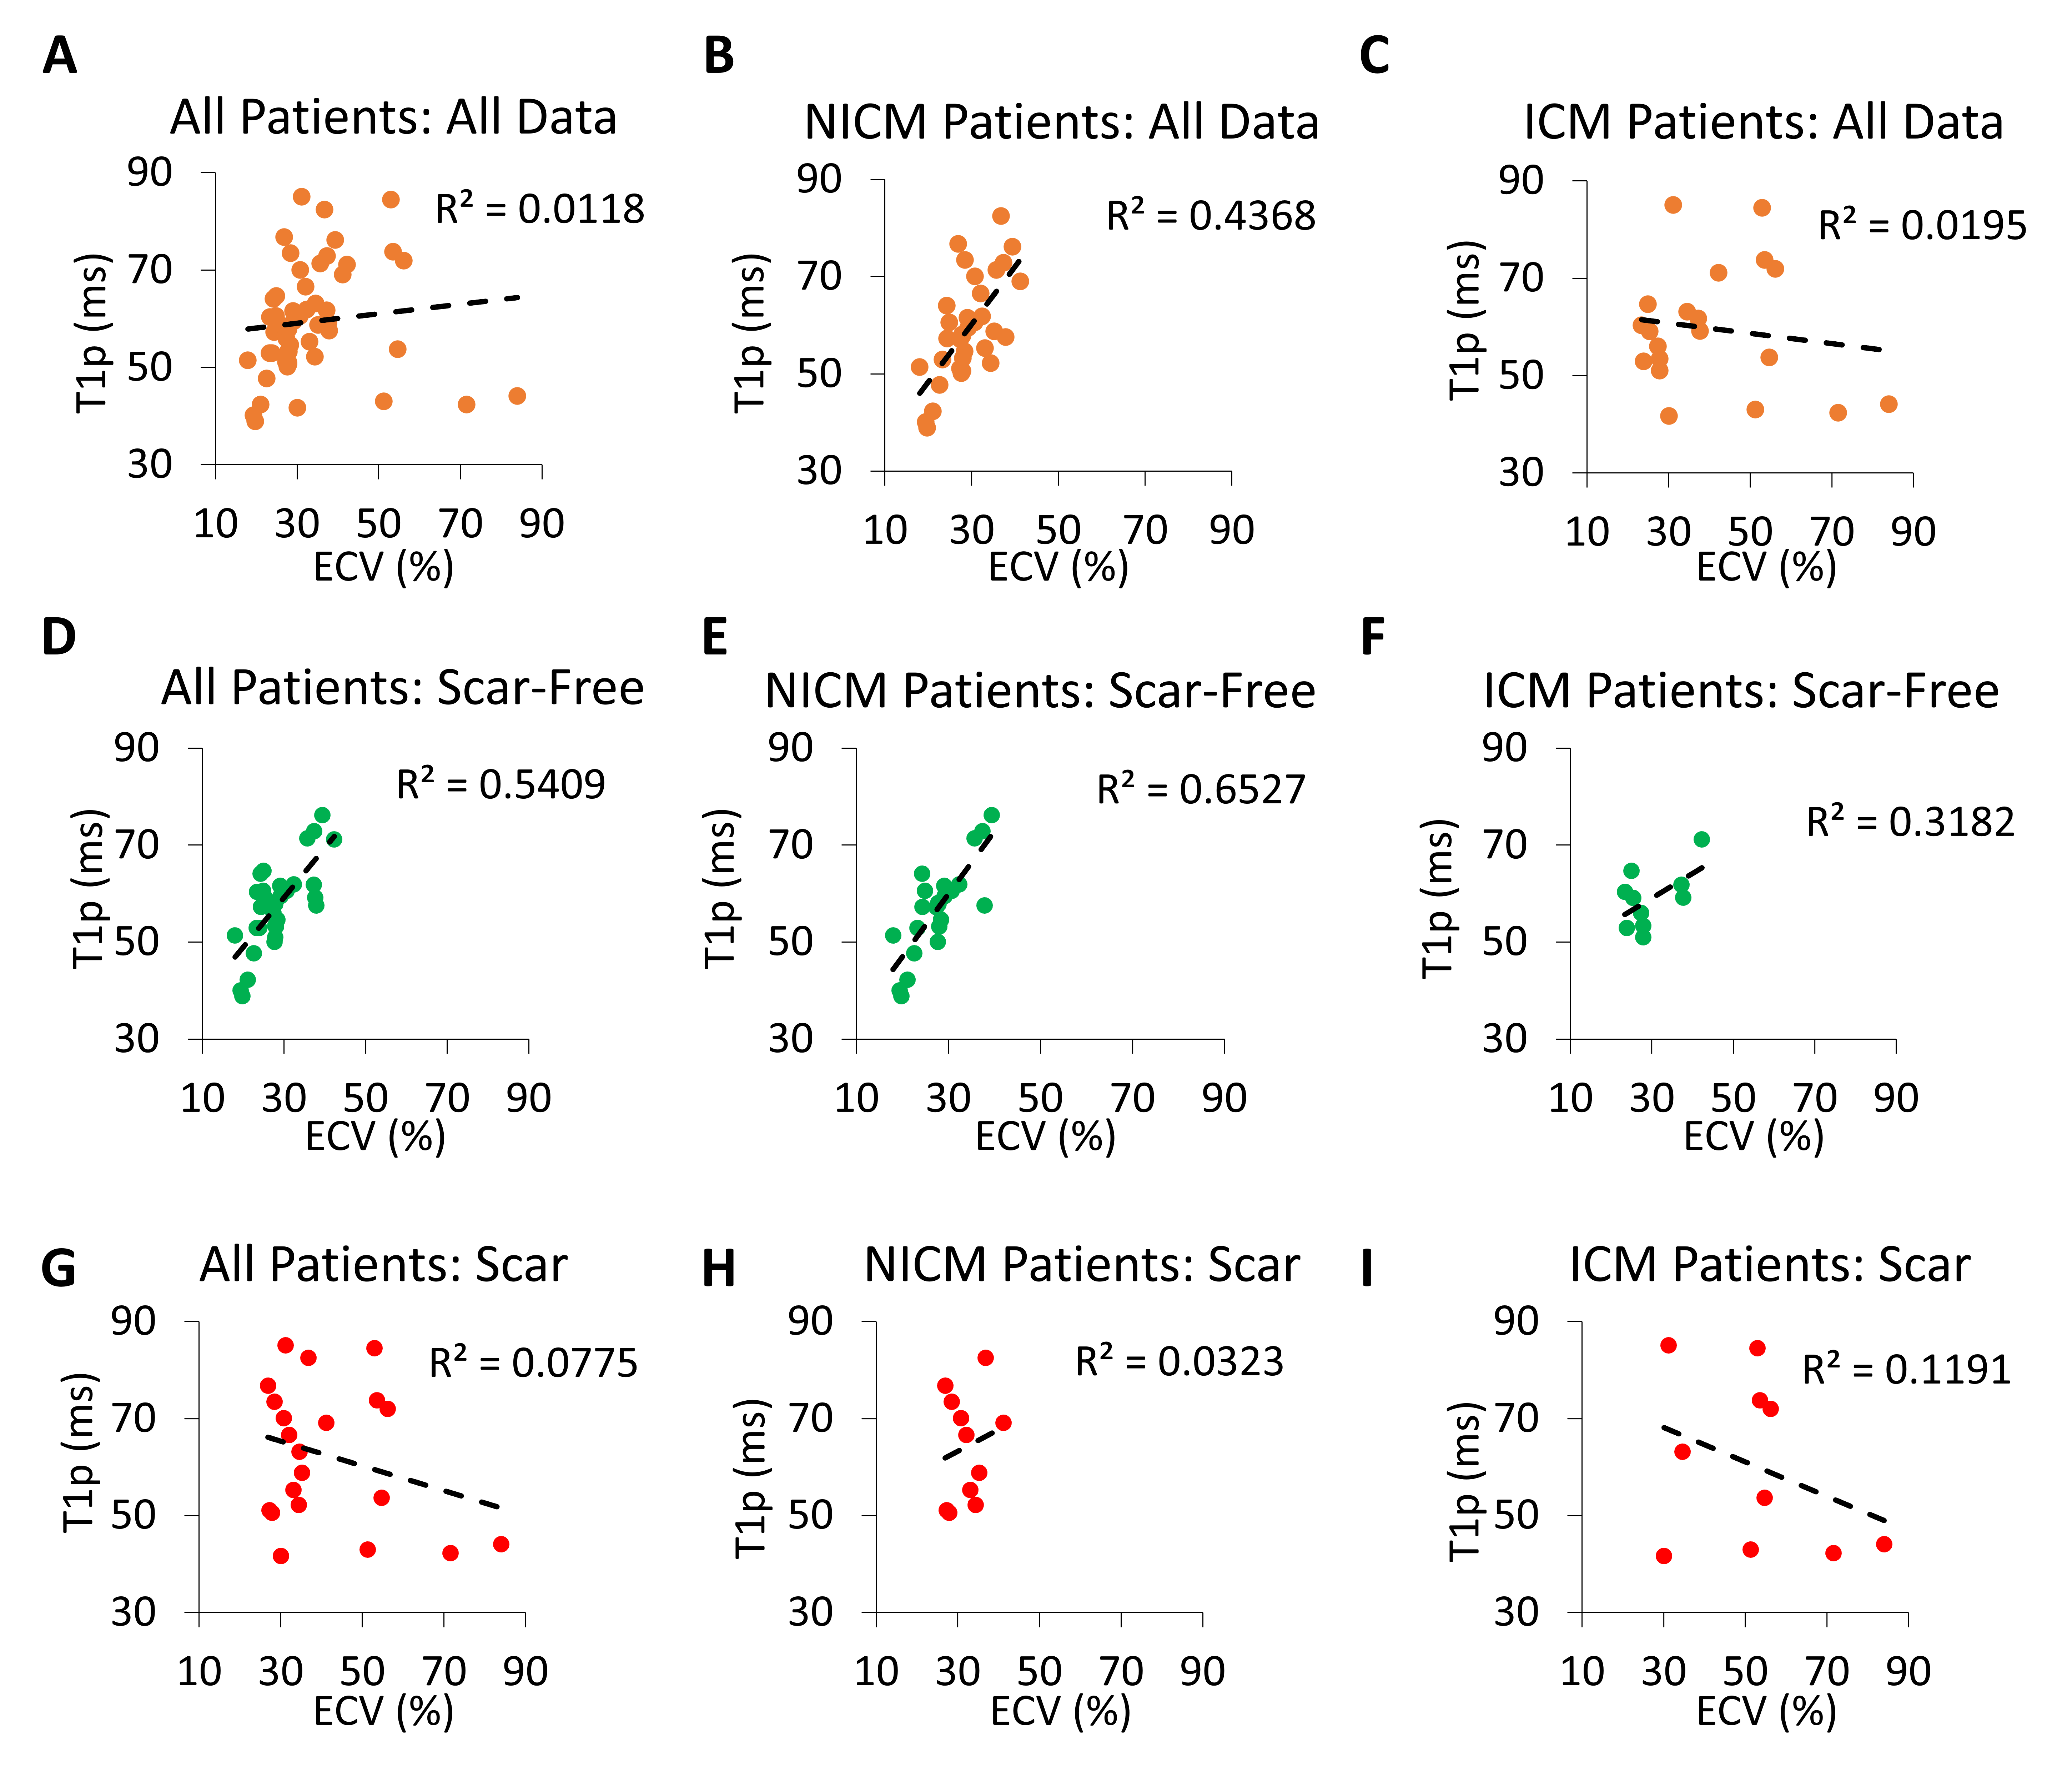
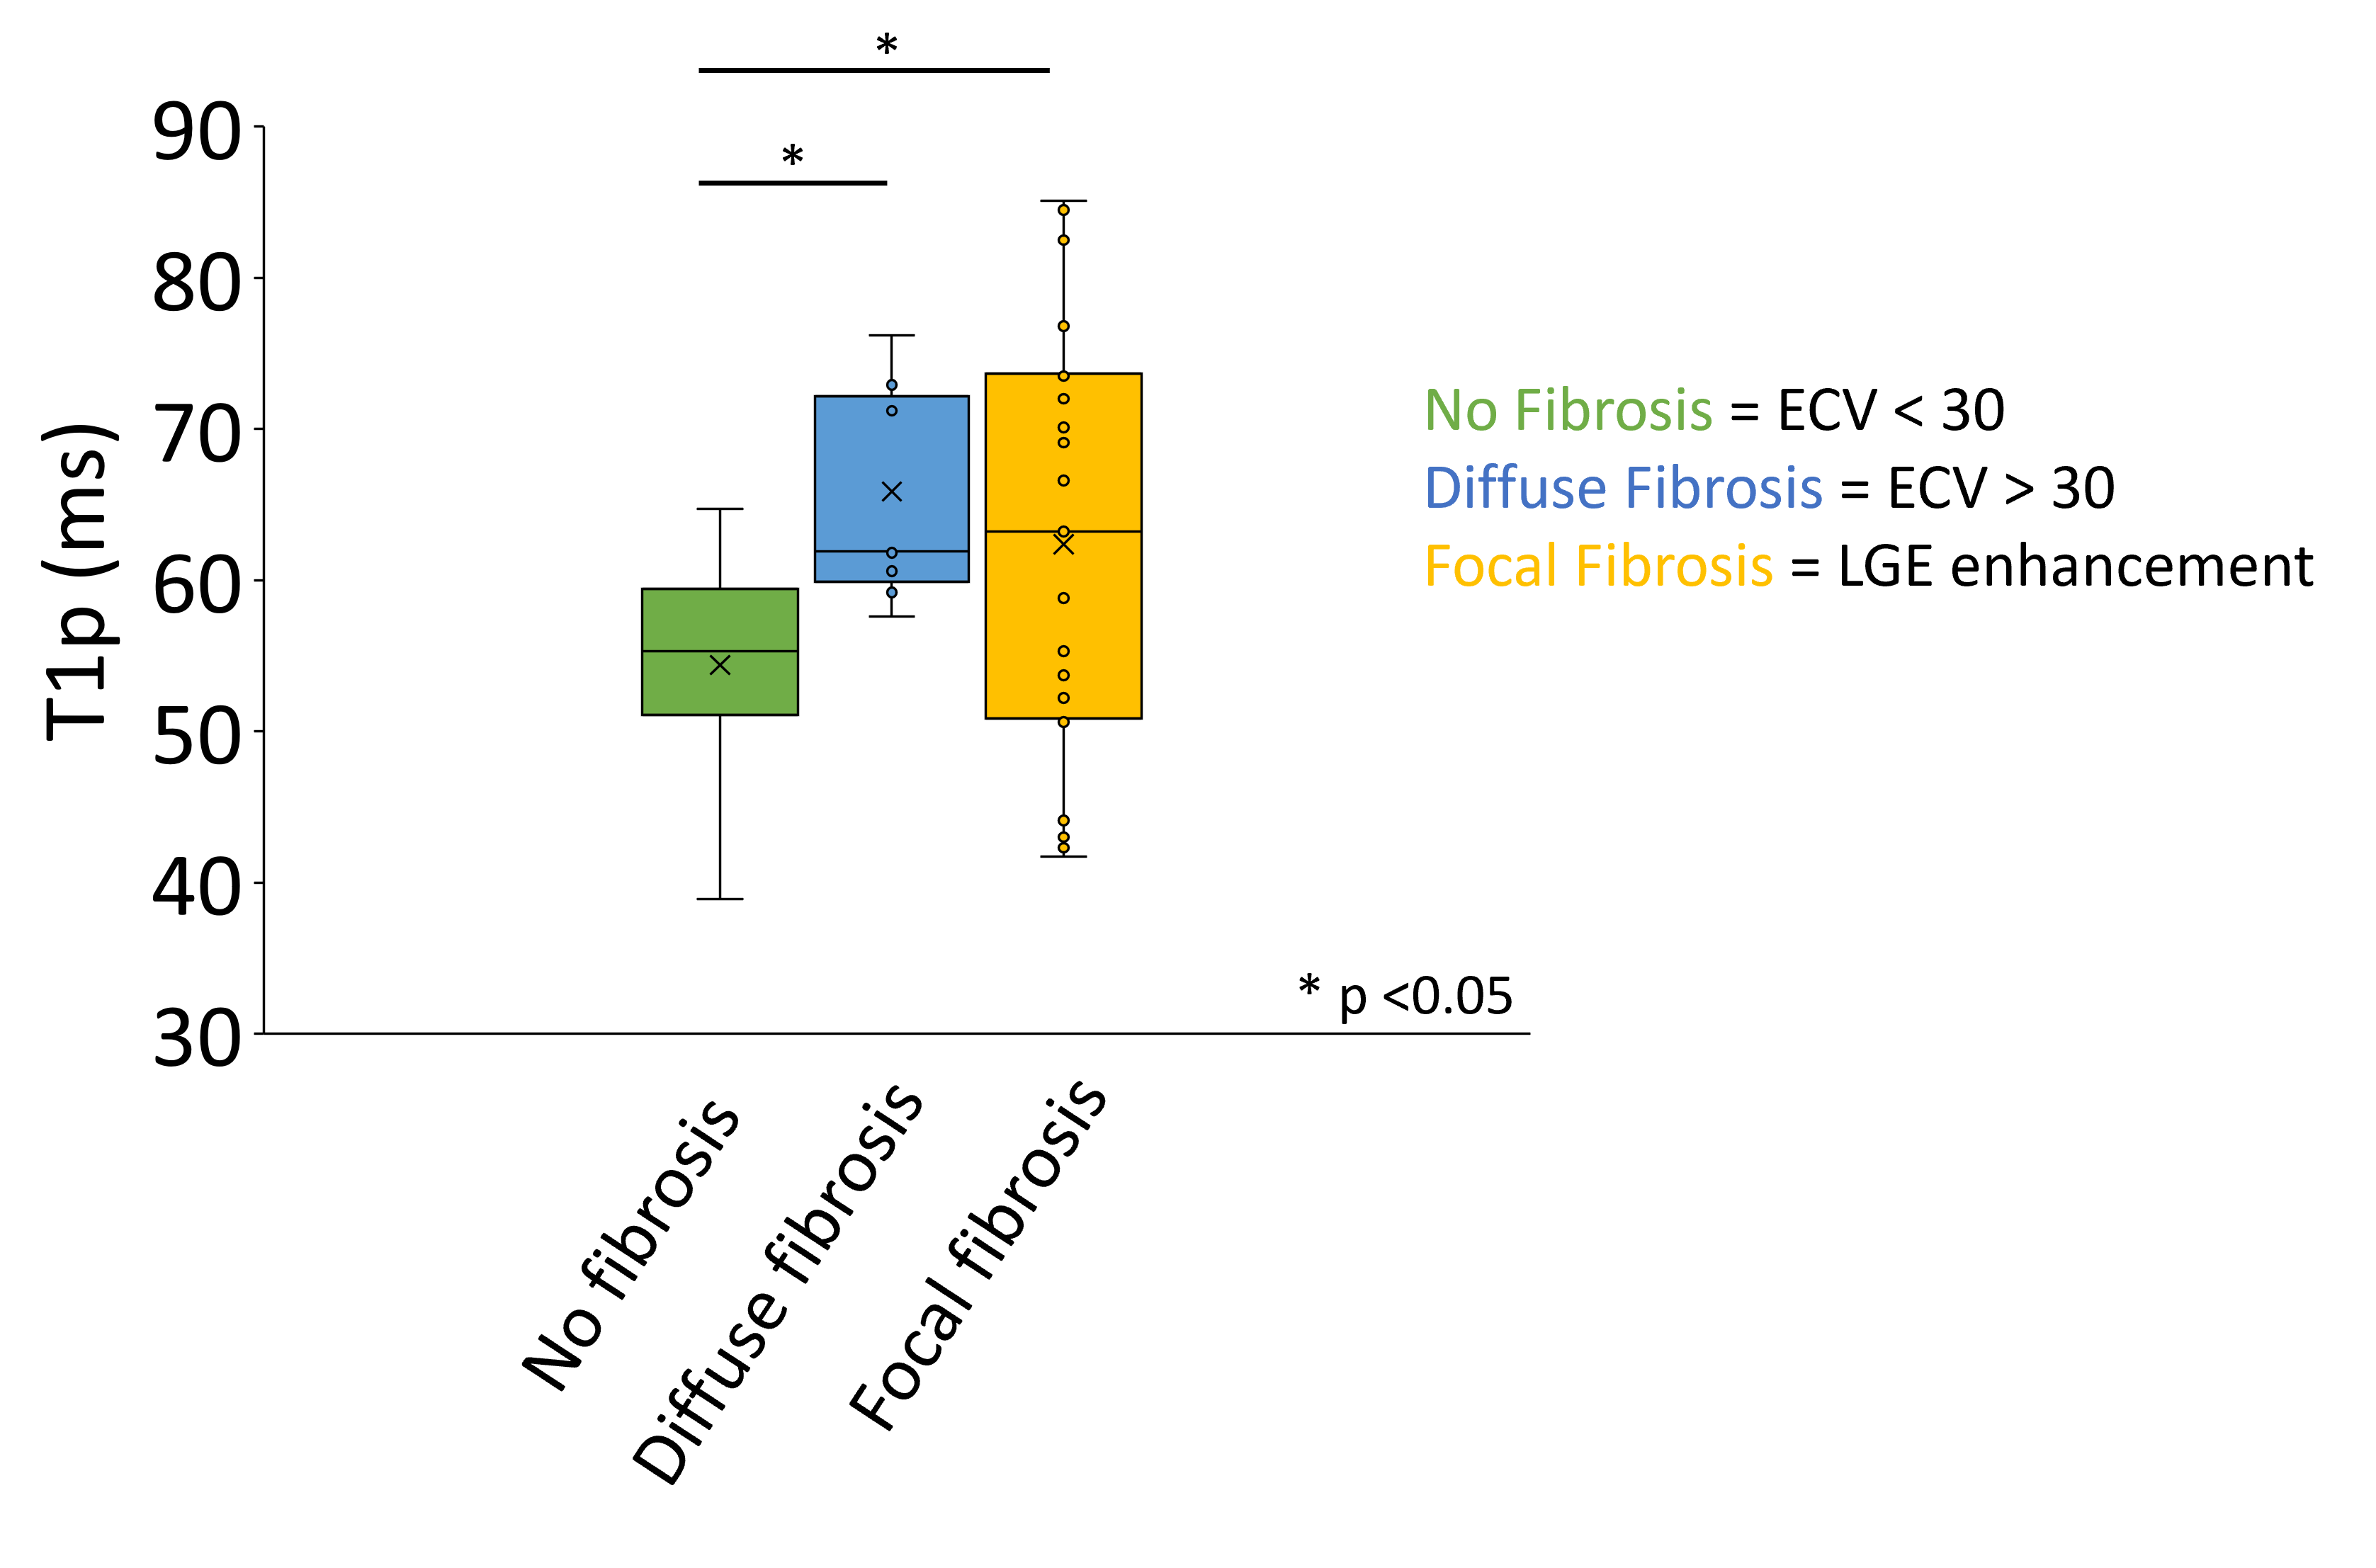
Mean scan time for our 9.5-fold accelerated 3D T1ρ mapping was 6.5 ± 1.6 minutes. 3D T1ρ imaging was reformatted into short-axis planes and achieved good T1ρ map image quality (Figure 2). Comparing T1ρ to ECV of the scar-free regions of all patients resulted in a positive Pearson’s correlation (R2 = 0.54), whereas in areas of focal scar we observed no correlation (R2 = 0.08) (Figure 4A,G). Similarly, the scar-free myocardium in NICM and ICM patients exhibited a positive trend between T1ρ and ECV (Figure 4E-F) whereas no correlation is seen in the scar myocardium (Figure 4H-I). Additionally, significantly increased T1ρ values were seen in areas of diffuse (65.9 ± 7.0 ms) and focal fibrosis (62.4 ± 14.4 ms) compared to no fibrosis (54.4 ± 6.9 ms) (p < 0.05) (Figure 5).Discussion
This study demonstrates that our proposed 3D T1ρ using XD-GRASP reconstruction produces good image quality in patients at 1.5T (Figure 2) and the values are in the same range as previously published results[6, 7]. In scar-free regions of the myocardium, we see a positive correlation between T1ρ and ECV, while no correlation was seen in regions of scar, regardless of patient type (Figure 4). This suggests that while ECV is sensitive to the volume of the extracellular matrix, T1ρ may be sensitive to the macromolecules themselves. Additionally, while both diffuse and focal fibrotic regions have significantly greater T1ρ than no fibrosis regions, the focal fibrosis regions had a much greater standard deviation indicating that the tissue composition of the focal fibrosis is heterogenous (Figure 5). Future studies include scanning more patients, including a 2D T1ρ pulse sequence as reference, further optimizing the 3D T1ρ pulse sequence and reconstruction parameters, and incorporation of deep learning methods for automated quantification of 3D T1ρ maps.Conclusion
3D T1ρ mapping and XD-GRASP reconstruction achieves robust image quality and T1ρ values that agree with literature. While 3D T1ρ correlates well with ECV in non-ischemic myocardium, further research is required to understand the composition of focal scar and what specific composition of tissues T1ρ is sensitive to.Acknowledgements
This work was supported in part by the following grants: National Institutes of Health (1K99HL161469, R01HL116895, 1R01HL167148‐01A1, R01HL151079, R21EB030806A1) and American Heart Association (19IPLOI34760317, 949899)References
1. Muthupillai, R., et al., Acute myocardial infarction: tissue characterization with T1rho-weighted MR imaging--initial experience. Radiology, 2004. 232(2): p. 606-10.
2. Witschey, W.R., et al., In vivo chronic myocardial infarction characterization by spin locked cardiovascular magnetic resonance. J Cardiovasc Magn Reson, 2012. 14: p. 37.
3. van Oorschot, J.W., et al., Endogenous assessment of chronic myocardial infarction with T(1rho)-mapping in patients. J Cardiovasc Magn Reson, 2014. 16: p. 104.
4.van Oorschot, J.W., et al., Endogenous assessment of diffuse myocardial fibrosis in patients with T1rho -mapping. J Magn Reson Imaging, 2017. 45(1): p. 132-138.
5. Zhang, Y., et al., MR extracellular volume mapping and non-contrast T1rho mapping allow early detection of myocardial fibrosis in diabetic monkeys. Eur Radiol, 2019. 29(6): p. 3006-3016.
6. Kamesh Iyer, S., et al., Accelerated free-breathing 3D T1rho cardiovascular magnetic resonance using multicoil compressed sensing. J Cardiovasc Magn Reson, 2019. 21(1): p. 5.
7. Qi, H., et al., Respiratory motion-compensated high-resolution 3D whole-heart T1rho mapping. J Cardiovasc Magn Reson, 2020. 22(1): p. 12.
8. Gunasekaran S, H.H.H.-V., R Passman, D Lee, D Kim Self-Navigated, Free-Breathing 3D Left Atrial Late Gadolinium Enhancement MRI with Stack-of-Stars k-space Sampling and GRASP Reconstruction: A Preliminary Study for Quantification of Atrial Fibrosis. in ISMRM. 2019. Montreal, QC, Canada.
9. Gunasekaran, S., et al., Accelerated 3D Left Atrial Late Gadolinium Enhancement in Patients with Atrial Fibrillation at 1.5 T: Technical Development. Radiol Cardiothorac Imaging, 2020. 2(5): p. e200134.
10. Kim, D., N. Oesingmann, and K. McGorty, Hybrid adiabatic-rectangular pulse train for effective saturation of magnetization within the whole heart at 3 T. Magn Reson Med, 2009. 62(6): p. 1368-78.
11. Haji-Valizadeh, H., et al., Accelerated, free-breathing, noncontrast, electrocardiograph-triggered, thoracic MR angiography with stack-of-stars k-space sampling and GRASP reconstruction. Magn Reson Med, 2019. 81(1): p. 524-532.
12. Witschey, W.R., et al., T1rho-prepared balanced gradient echo for rapid 3D T1rho MRI. J Magn Reson Imaging, 2008. 28(3): p. 744-54.
13. Peterson, T.E., et al., Myocardial extracellular volume fraction is positively associated with activated monocyte subsets among cART-treated persons living with HIV in South Africa. Int J Cardiol, 2023. 392: p. 131332.
Figures