1807
Deep Learning Automated Segmentation of the Left Ventricle for Spin-Echo Cardiac Diffusion Tensor Imaging (cDTI)1Department of Radiology, Stanford University, Stanford, CA, United States, 2Division of Radiology, Veterans Administration Health Care System, Palo Alto, CA, United States, 3Cardiovascular Institute, Stanford University, Stanford, CA, United States, 4Department of Bioengineering, Stanford University, Stanford, CA, United States, 5Department of Computer Science, Stanford University, Stanford, CA, United States
Synopsis
Keywords: Myocardium, Diffusion Tensor Imaging
Motivation: Segmentation is central to cDTI post-processing, but remains subjective, time-intensive, and observer-dependent. Faster methods are needed.
Goal(s): To develop and validate a U-Net for automating and standardizing left ventricle segmentations for cDTI. Our target was for U-net generated masks to yield cDTI metric maps within 5% of ground-truth and Dice scores comparable to a human reader.
Approach: We developed a U-Net to automatically segment cDTI data then compared generated masks to expert annotations.
Results: Median Dice score was 0.79 with cDTI metrics within 5% of ground truth. A multiple-reader study demonstrated the need for further generalization of datasets at different resolutions.
Impact: An automated U-Net approach to cardiac DTI segmentation of the left ventricle minimizes segmentation variability, reduces processing time, and preserves cDTI metric measurement accuracy.
Introduction
Cardiac Diffusion Tensor Imaging (cDTI) is used to probe cardiac tissue microstructure and is known to show microstructural remodeling in various cardiomyopathies1. However, one major limitation for the wider adoption of cDTI for research and clinical purposes is the left ventricle segmentation (LV). Masking the LV can be subjective and varies amongst annotators. Additionally, masking is a time-intensive task, taking several minutes to annotate all images for a volunteer, which is a bottleneck in processing cDTI data.Previous work used a deep-learning model trained on images from stimulated-echo (STEAM) cDTI acquisitions to automatically mask data2. Currently, there are no automated approaches available for spin echo cDTI data.
The purpose of our project was to develop U-Net models that automatically segment the LV for spin-echo cDTI. Our goal was to generate automatic segmentations that produce mean MD and FA values within 5% of the ground-truth (expert annotations) and a U-net-Reader Dice score within ≥ 5% of Reader-Reader Dice score.
Methods
Data Acquisition:Healthy volunteers (N=11) were imaged (IRB, Consent) at 3T (Skyra, Siemens) using an ECG-gated, free-breathing, M1+M2 motion-compensated spin-echo diffusion sequence3 with slice-following. Volunteers were scanned with several cDTI protocols (Fig-1A) at 2x2x8mm3 resolution that covered a range of SNR, diffusion-direction angular resolution, and diffusion-direction orientation. Images underwent Gibb’s ringing reduction, registration, shot-rejection and interpolation. Geometric distortion was corrected using FSL TOPUP4 and ground-truth masks were generated with MITK5. In total, 984 (~11-volunteers× 3-slices× 9-acquisitions× 4-distorted/distortion-corrections) images were used for training/testing/validation(80%/10%/10%).
We also completed a U-net vs. Reader study where five new volunteers underwent a similar protocol but at 2.5x2.5x8mm3 resolution and distortion-free images were annotated by two expert readers(Fig-1B).
Architecture & Training
We implemented a network with a U-Net architecture6(learning-rate=1e-5, batch-size=4, Epochs=30, Adam-optimizer7) using Pytorch8 libraries. The input to the U-Net included 200×200 6-channel images: the maximum intensity projection (MIP) of b=0 s/mm2 and DWI images, Mean Diffusivity (MD), Fractional Anisotropy (FA), and the Primary Eigenvector (E1) map (three different RGB channels). Multiple channels were incorporated because manual masking typically utilizes observations of multiple maps. The U-net output was an LV mask.
We evaluated three loss functions: binary-cross-entropy (BCE), Sørensen–Dice Coefficient (Dice), and combined BCE+Dice losses. Training was done on TITAN RTX GPUs.
Validation
For each loss-function, 4-fold cross-validation was performed. The test dataset was then used to evaluate the performance of the U-Net compared to a reader, followed by a multiple-reader comparison (U-net vs. Reader Study). Dice score, median MD, and median FA for each slice were compared between the U-Net and expert reader segmentations. The target was for the U-Net masks to produce slice-averaged estimates of MD and FA within 5% of the expert readers and Dice score within 5% of inter-reader Dice.
Results
Segmentation time for experts ranged from 6-10 minutes/3-slices while U-net inference time was 23µs/3-slices, with ~30 seconds to load data and model.There are large overlaps between U-Net segmentations vs. ground-truth (Fig-2). However, in some circumstances, the U-Net does not complete LV epicardial and endocardial borders. In training, we see a decrease in loss function while Dice scores in validation datasets level out (Fig 3A-B). In the test dataset, median Dice score between the U-Net and ground-truth segmentations was 0.65, 0.79, and 0.74 for BCE, Dice and BCE+Dice loss respectively (Fig 3C). For all loss functions, median MD of U-Net segmentations were within 1% of the ground-truth (MD=1.71x10⁻³mm2/s) and median FA (FA=0.22a.u.) of U-Net segmentations were within 5% of the ground-truth (Fig 3D-E). From these observations, the U-Net trained with Dice loss was used for the reader study.
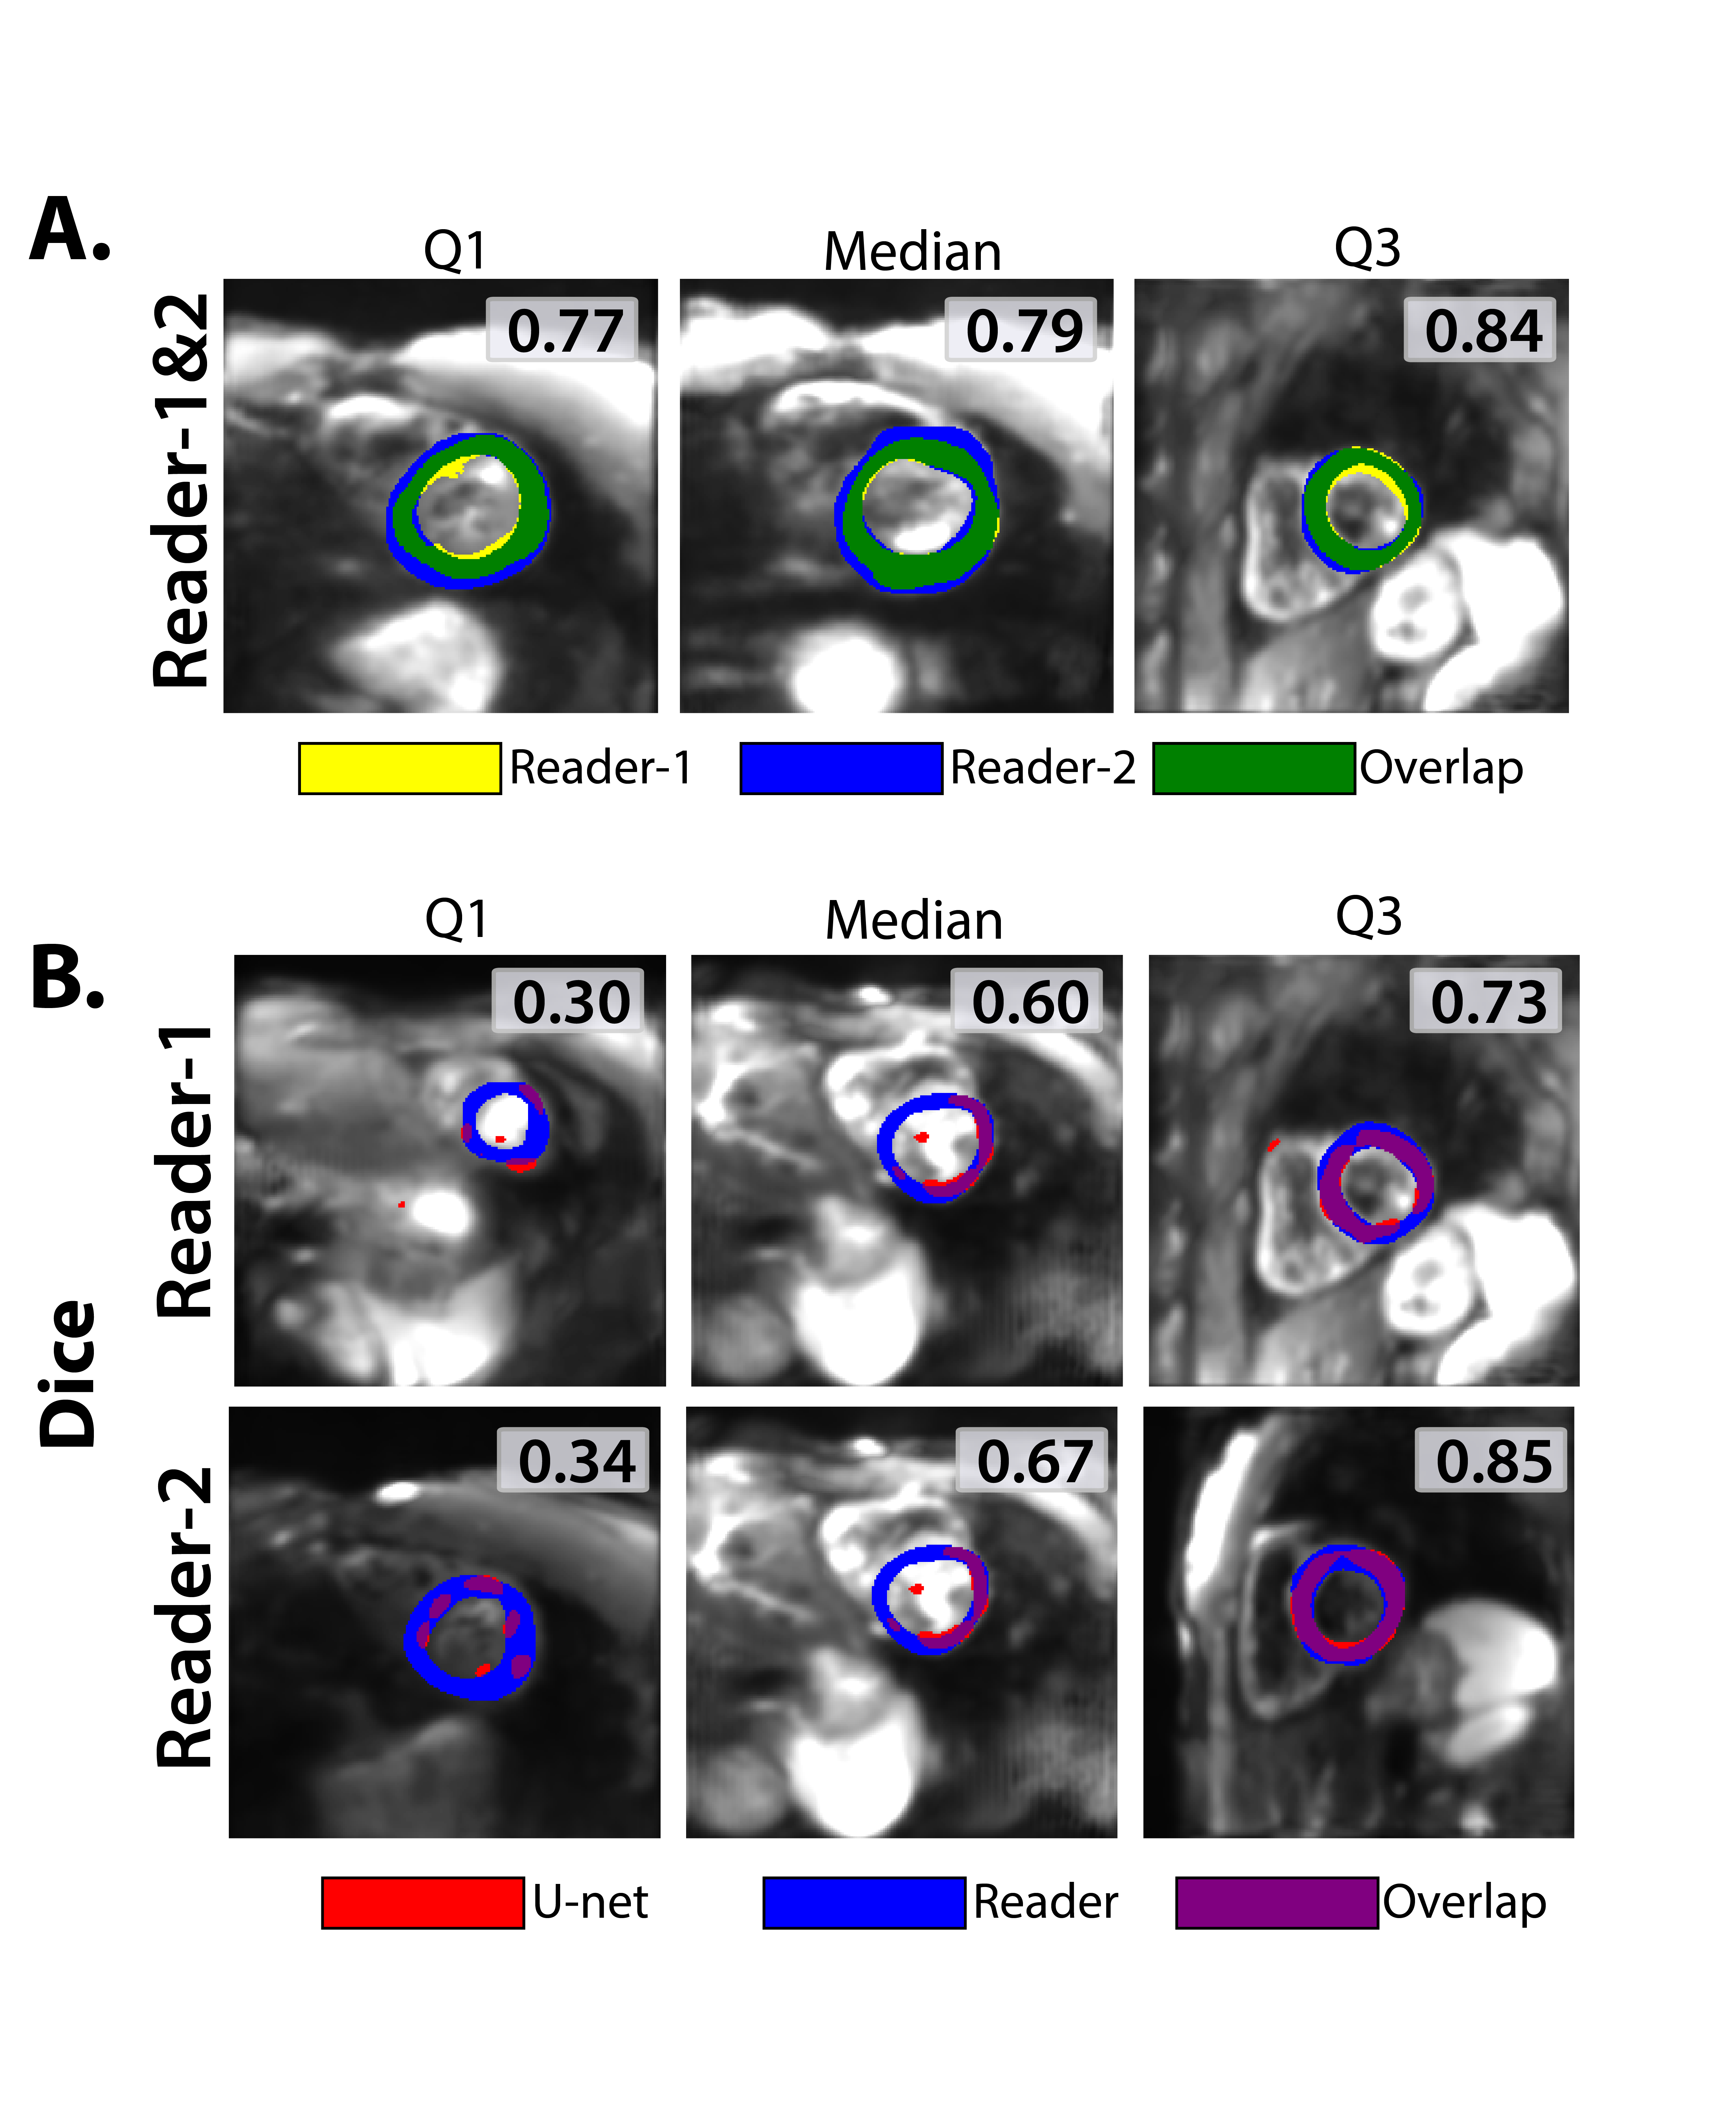
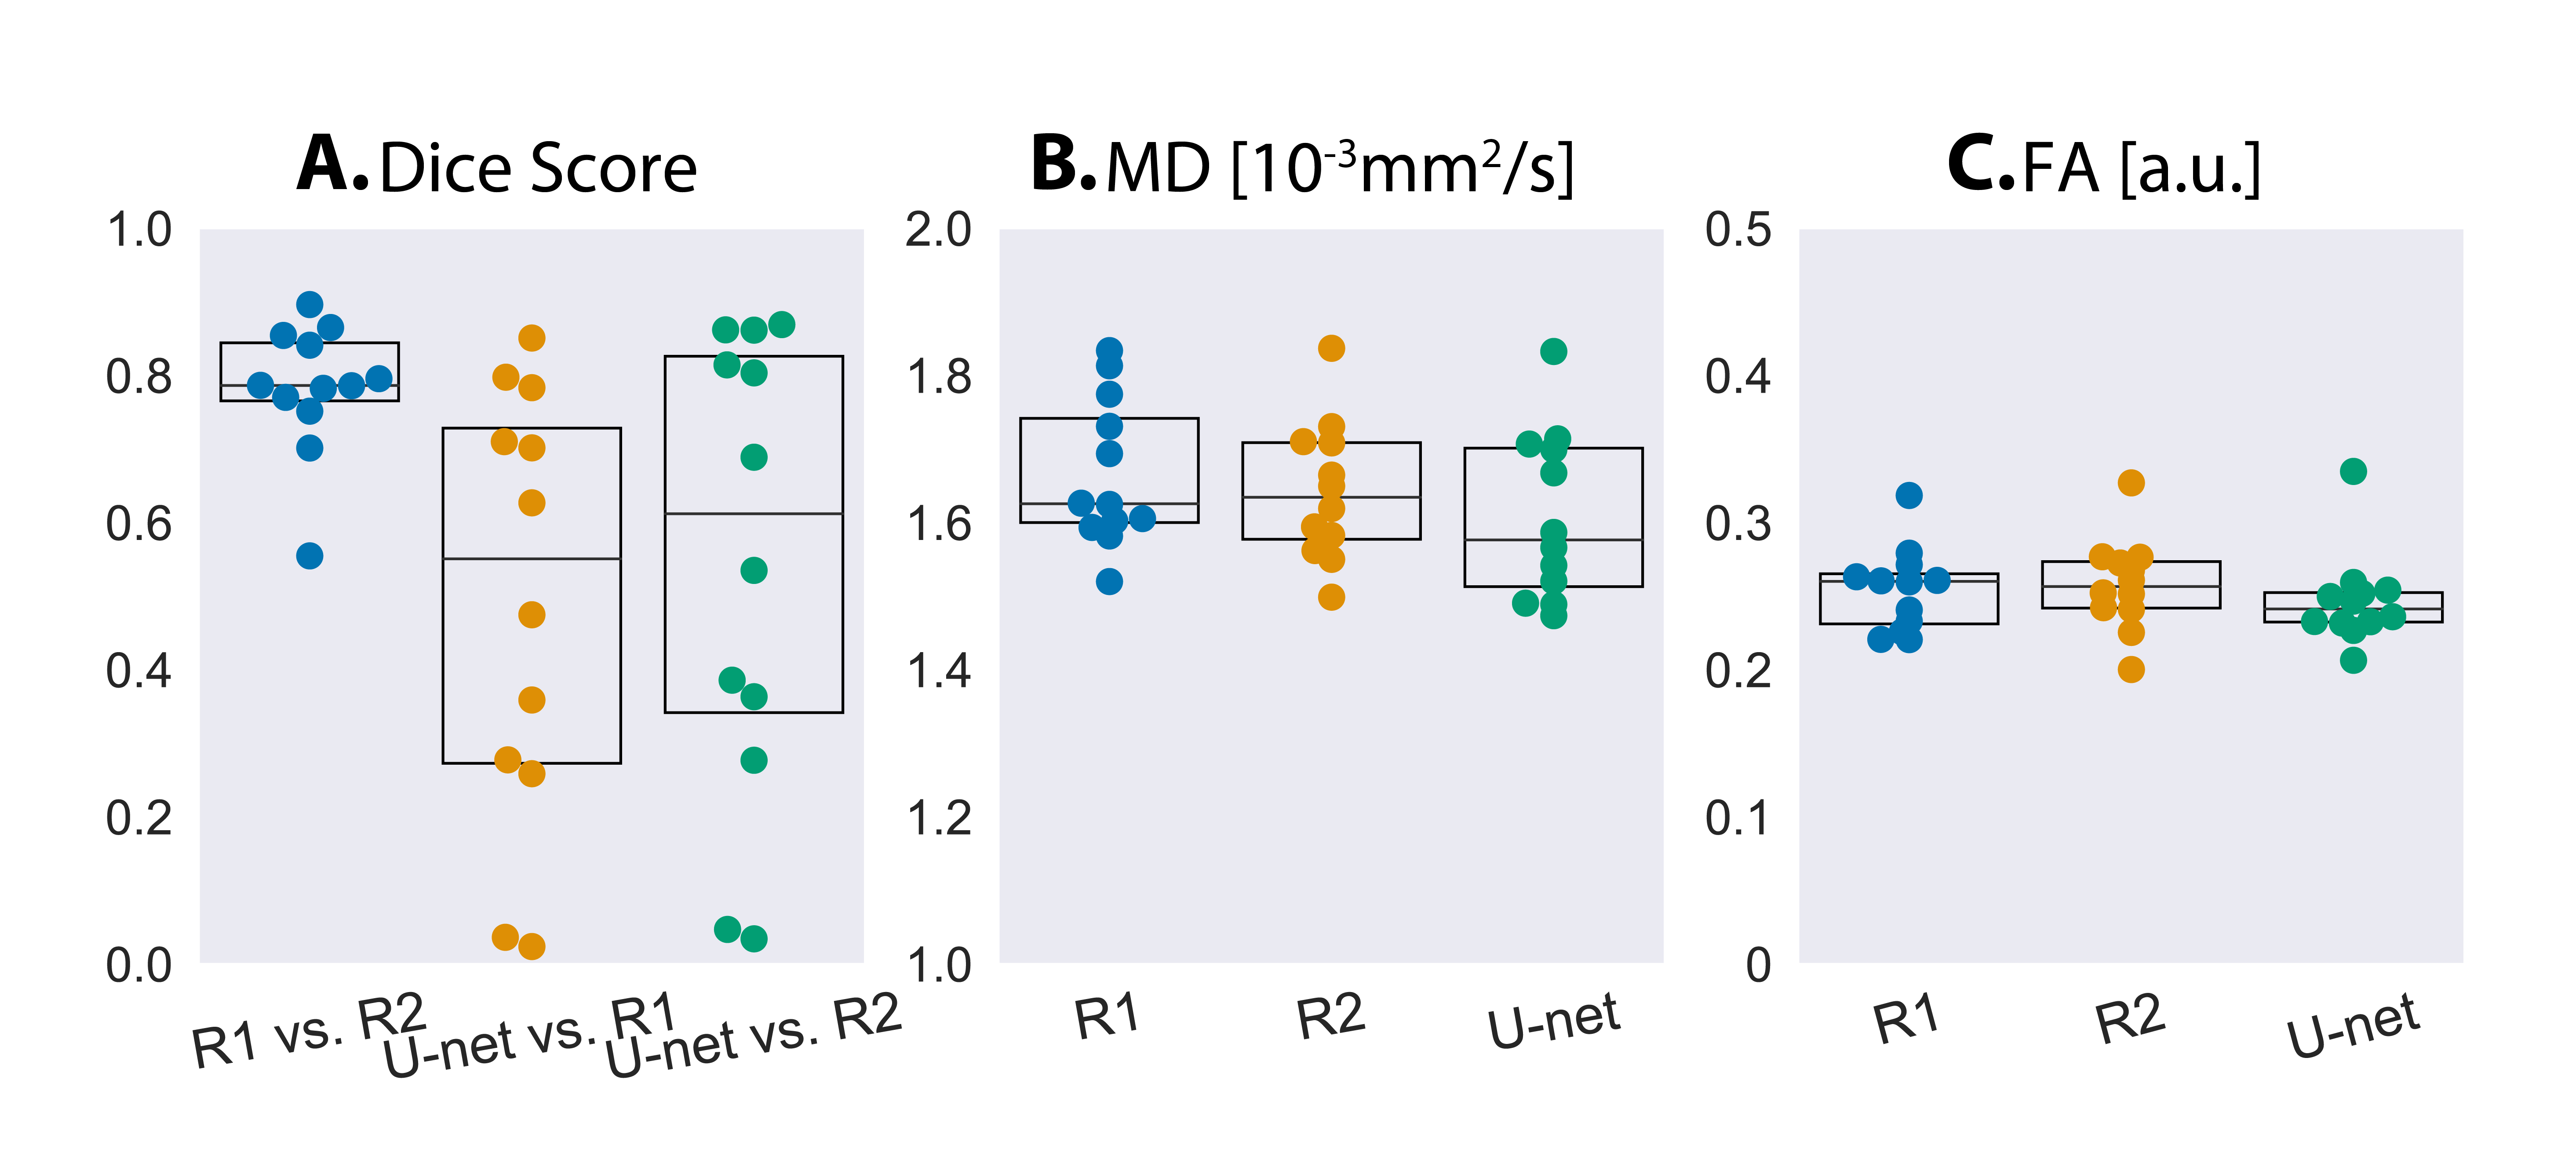
In the U-net vs. Reader study (2.5x2.5x8mm3 data), inter-reader consistency yielded a median Dice score of 0.79. U-net vs. Reader Dice score was lower (0.60 between U-Net and Reader-1 and 0.67 between U-Net and Reader-2). U-Net masks targeted the LV, but were thinner segmentations compared to readers(Fig-4). U-net median MD and FA was within 3% of Reader-1 and Reader-2(Fig-5).
Discussion
Training with Dice-loss was most generalizable in segmenting testing data. The U-net vs. Reader comparison was a challenging task for the U-Net as it involved segmenting data acquired at a different resolution than training data. We plan to iterate by incorporating additional data at different resolutions, investigate alternative architectures9, and incorporate edge-metrics like Hausdorff distance.Conclusion
We developed a preliminary U-Net to automatically segment the LV for spin-echo cDTI. The U-Net trained with Dice-Loss performed well in our test dataset, with a median Dice score of 0.79 and median MDs and FAs within 5% of the ground-truth. We plan to continue to improve upon this design to increase generalizability.Acknowledgements
We would like to acknowledge our funding sources:
References
[1] Nielles-Vallespin Sonia, Scott Andrew, Ferreira Pedro, Khalique Zohya, Pennell Dudley, Firmin David. Cardiac diffusion: technique and practical applications. Journal of Magnetic Resonance Imaging. 2020;52(2):348–368.
[2] Ferreira PF, Martin RR, Scott AD, et al. Automating in vivo cardiac diffusion tensor postprocessing with deep learning-based segmentation. Magn Reson Med. 2020;84(5):2801-2814.
[3] Moulin K, Croisille P, Feiweier T, et al. In vivo free-breathing DTI and IVIM of the whole human heart using a real-time slice-followed SE-EPI navigator-based sequence: A reproducibility study in healthy volunteers. Magn Reson Med. 2016;76(1):70-82.
[4] J.L.R. Andersson, S. Skare, J. Ashburner. How to correct susceptibility distortions in spin-echo echo-planar images: application to diffusion tensor imaging. NeuroImage, 20(2):870-888, 2003.
[5] Wolf I, Vetter M, Wegner I, et al. The medical imaging interaction toolkit. Med Image Anal. 2005;9(6):594-604.
[6] Ronneberger O, Fischer P, Brox T. U-Net: Convolutional Networks for Biomedical Image Segmentation. In: Navab N, Hornegger J, Wells W, Frangi A, editors. Medical Image Computing and Computer-Assisted Intervention – MICCAI 2015. MICCAI 2015. Lecture Notes in Computer Science, vol 9351. Springer, Cham; 2015.
[7] Kingma D, Ba J. Adam: A Method for Stochastic Optimization. In: International Conference on Learning Representations (ICLR); 2015. San Diego, CA, USA.
[8] Paszke A, Gross S, et al. PyTorch: An Imperative Style, High-Performance Deep Learning Library. In: Advances in Neural Information Processing Systems 32; 2019:8024-8035.
[9] Isensee F, Jaeger PF, Kohl SAA, Petersen J, Maier-Hein KH. nnU-Net: a self-configuring method for deep learning-based biomedical image segmentation. Nat Methods. 2021;18(2):203-211.
Figures
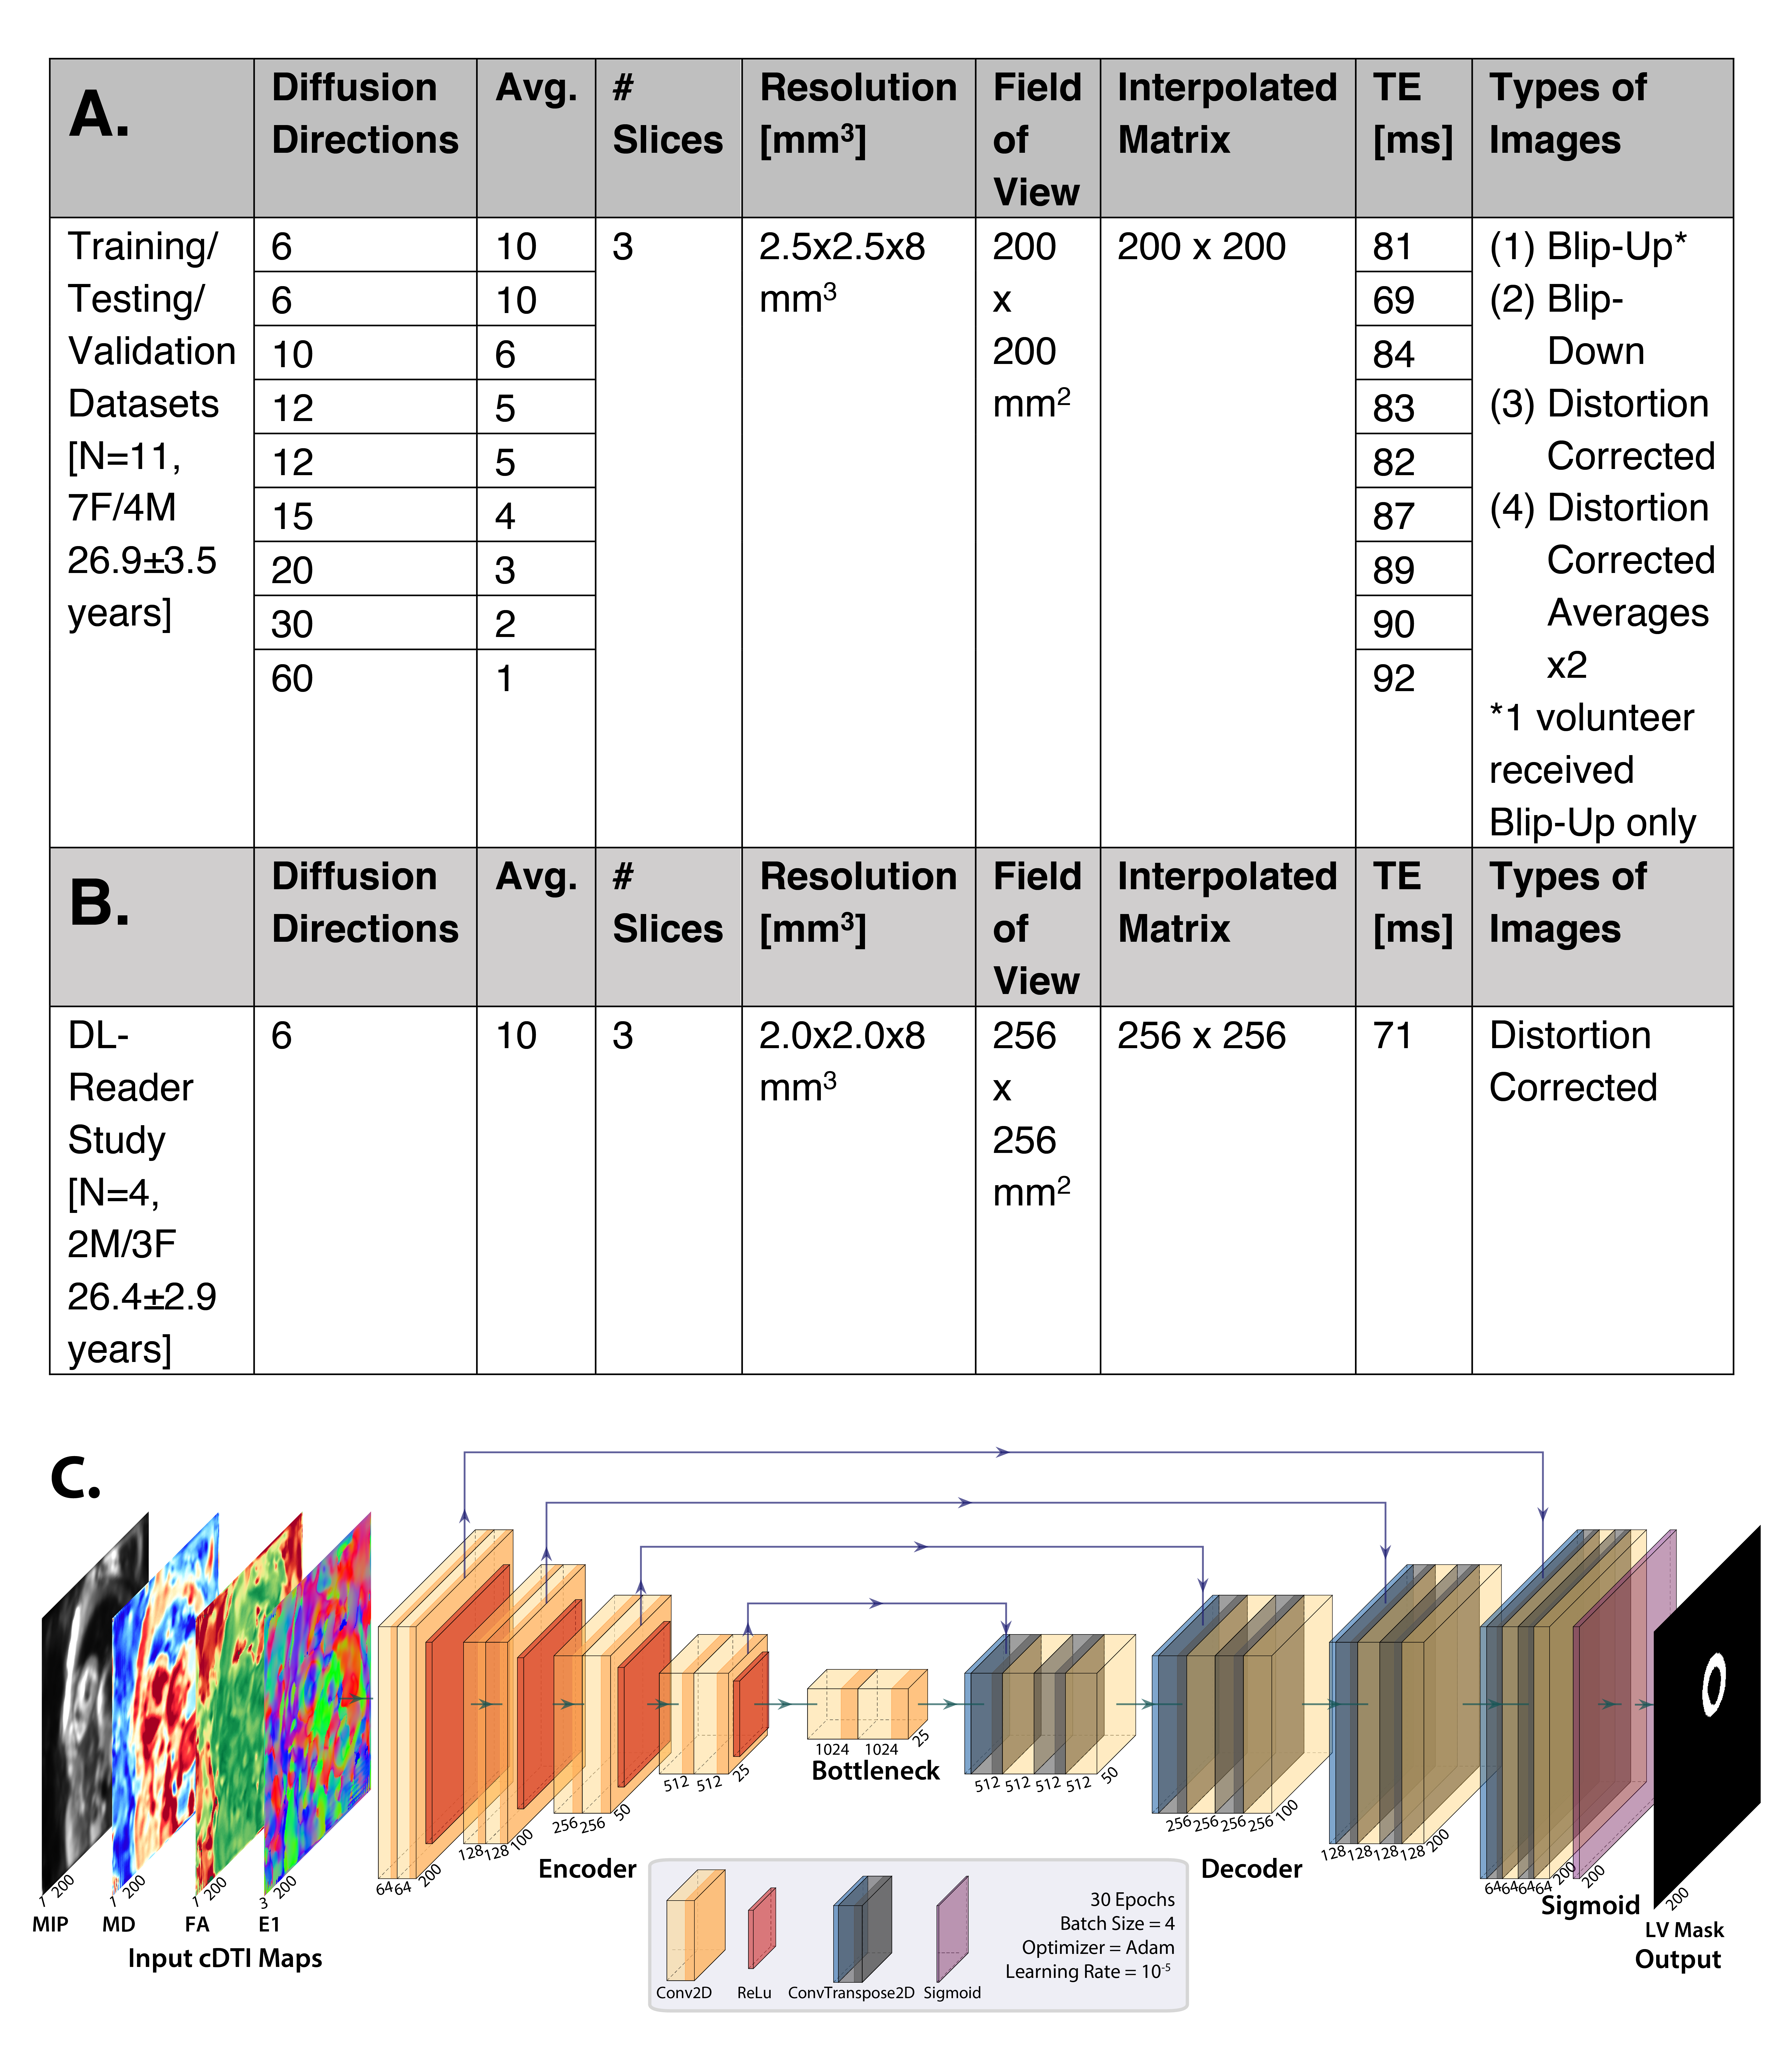
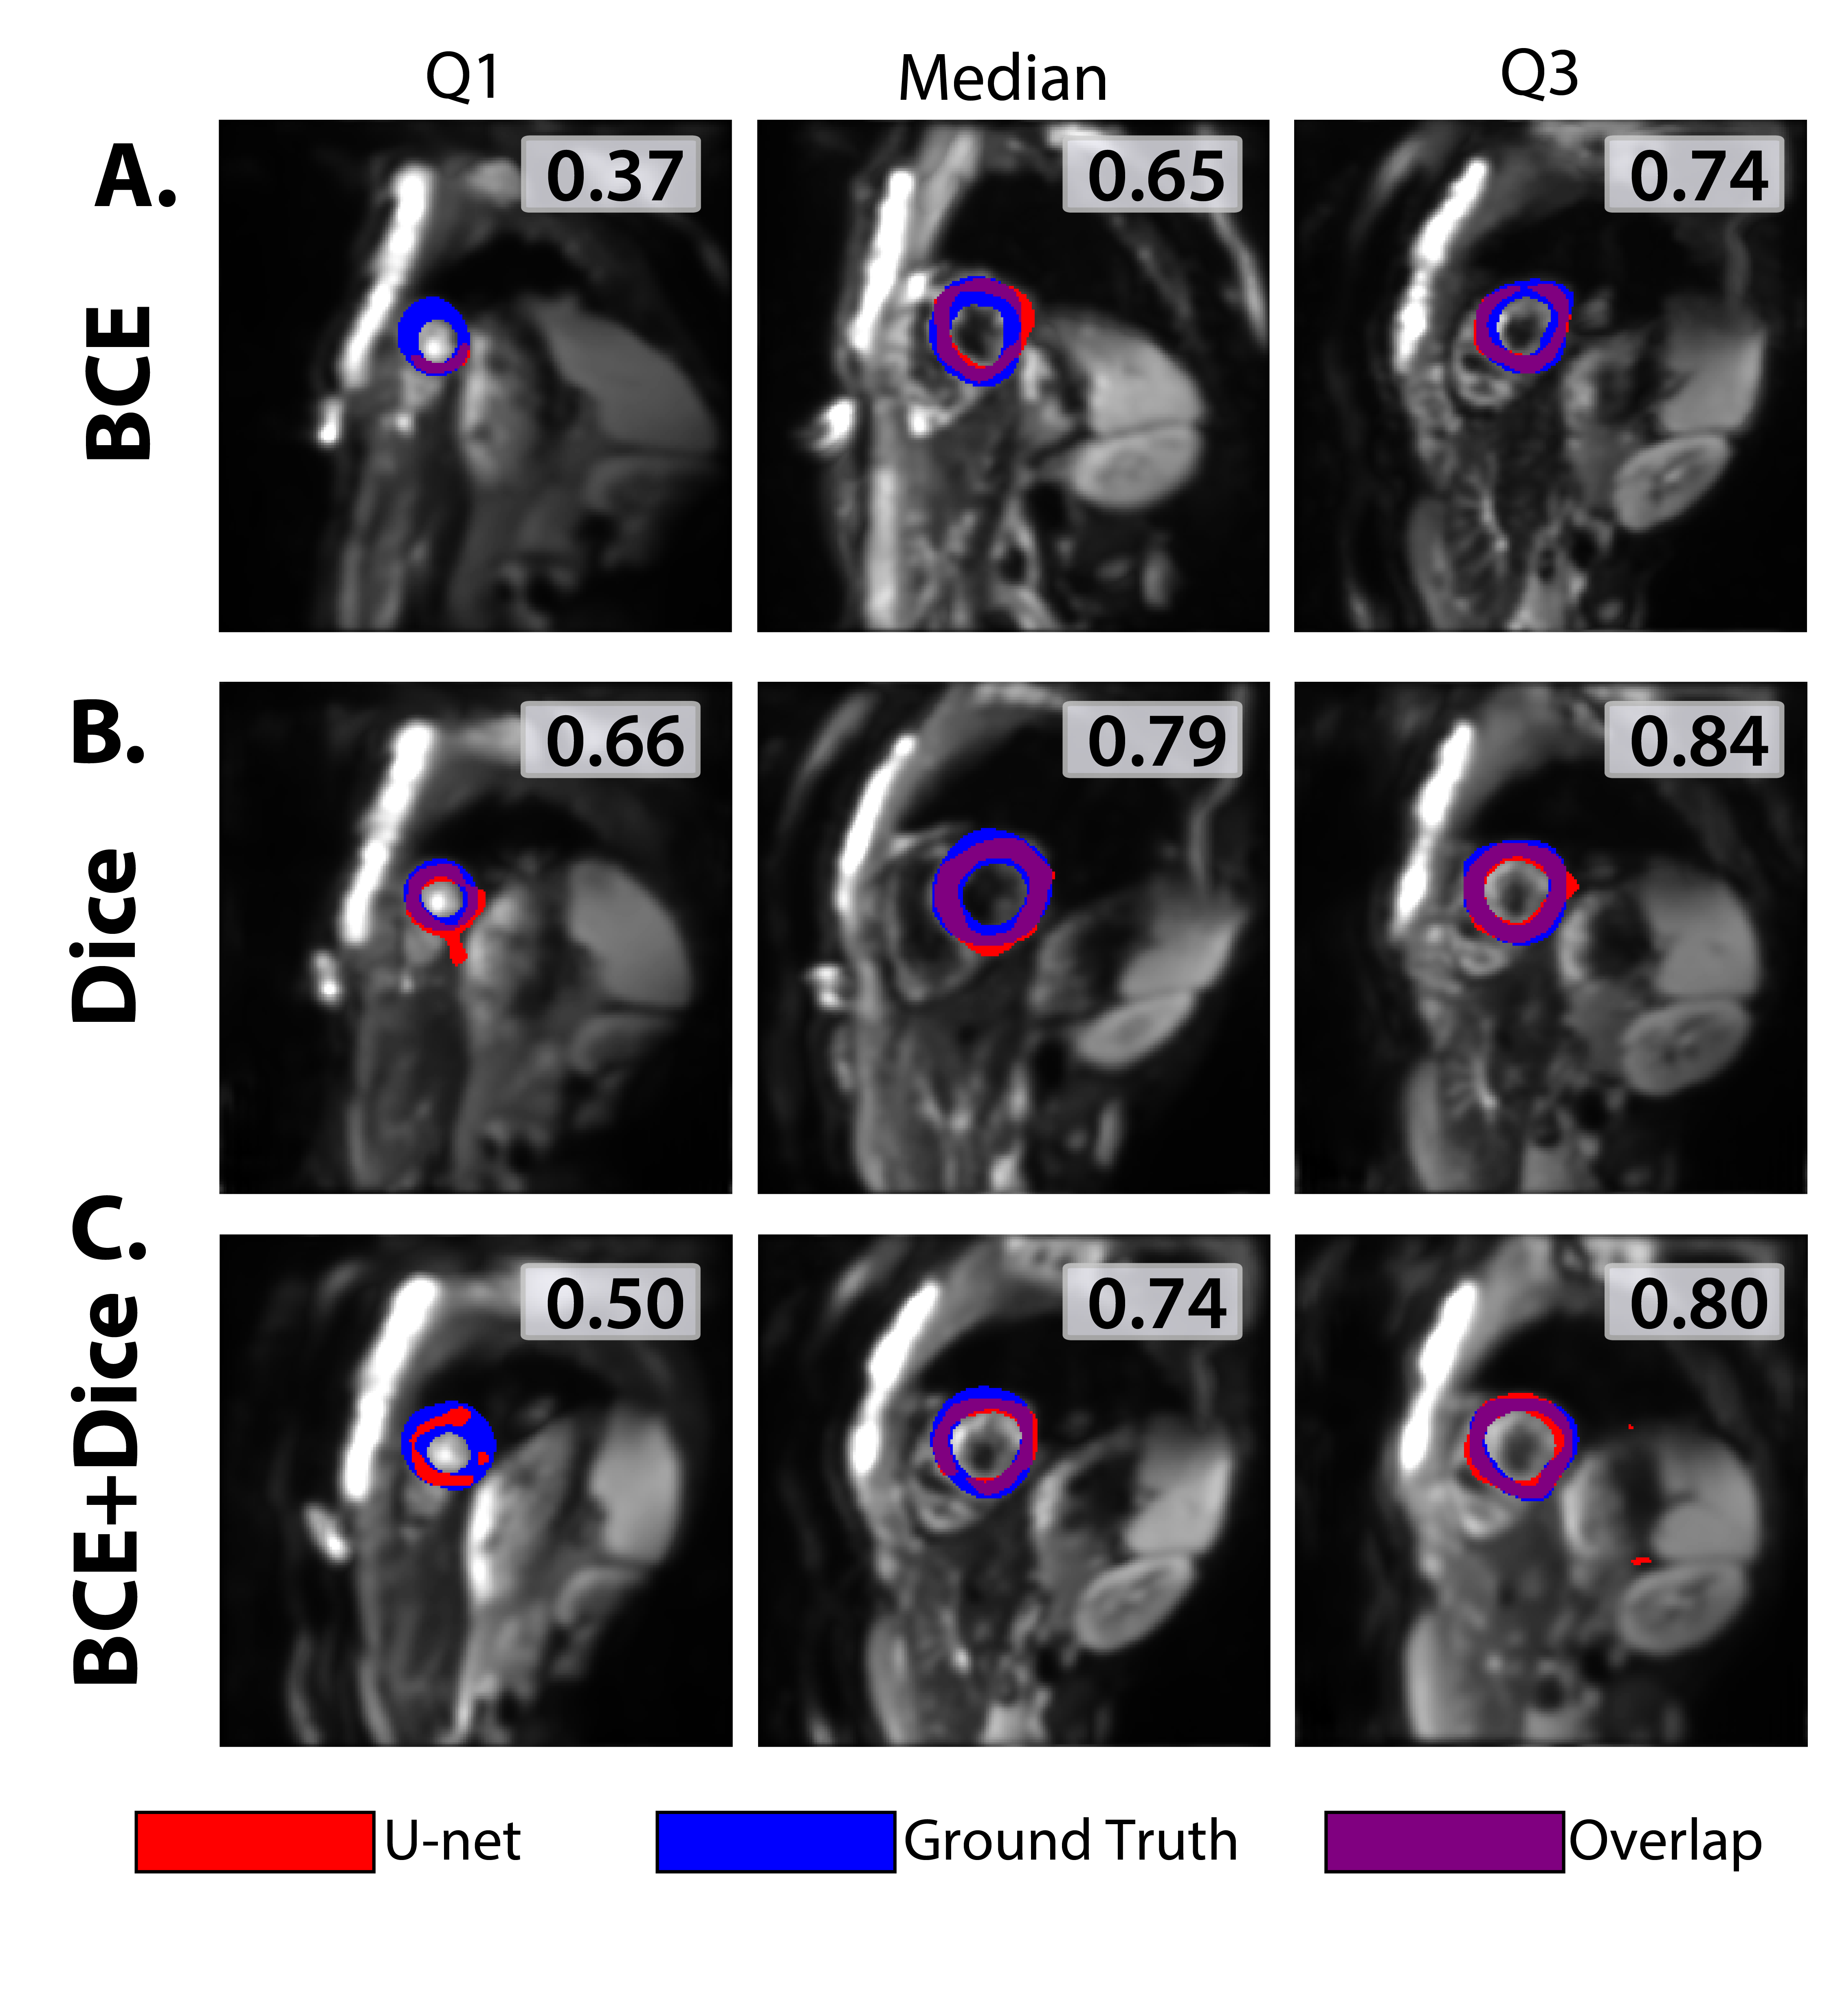
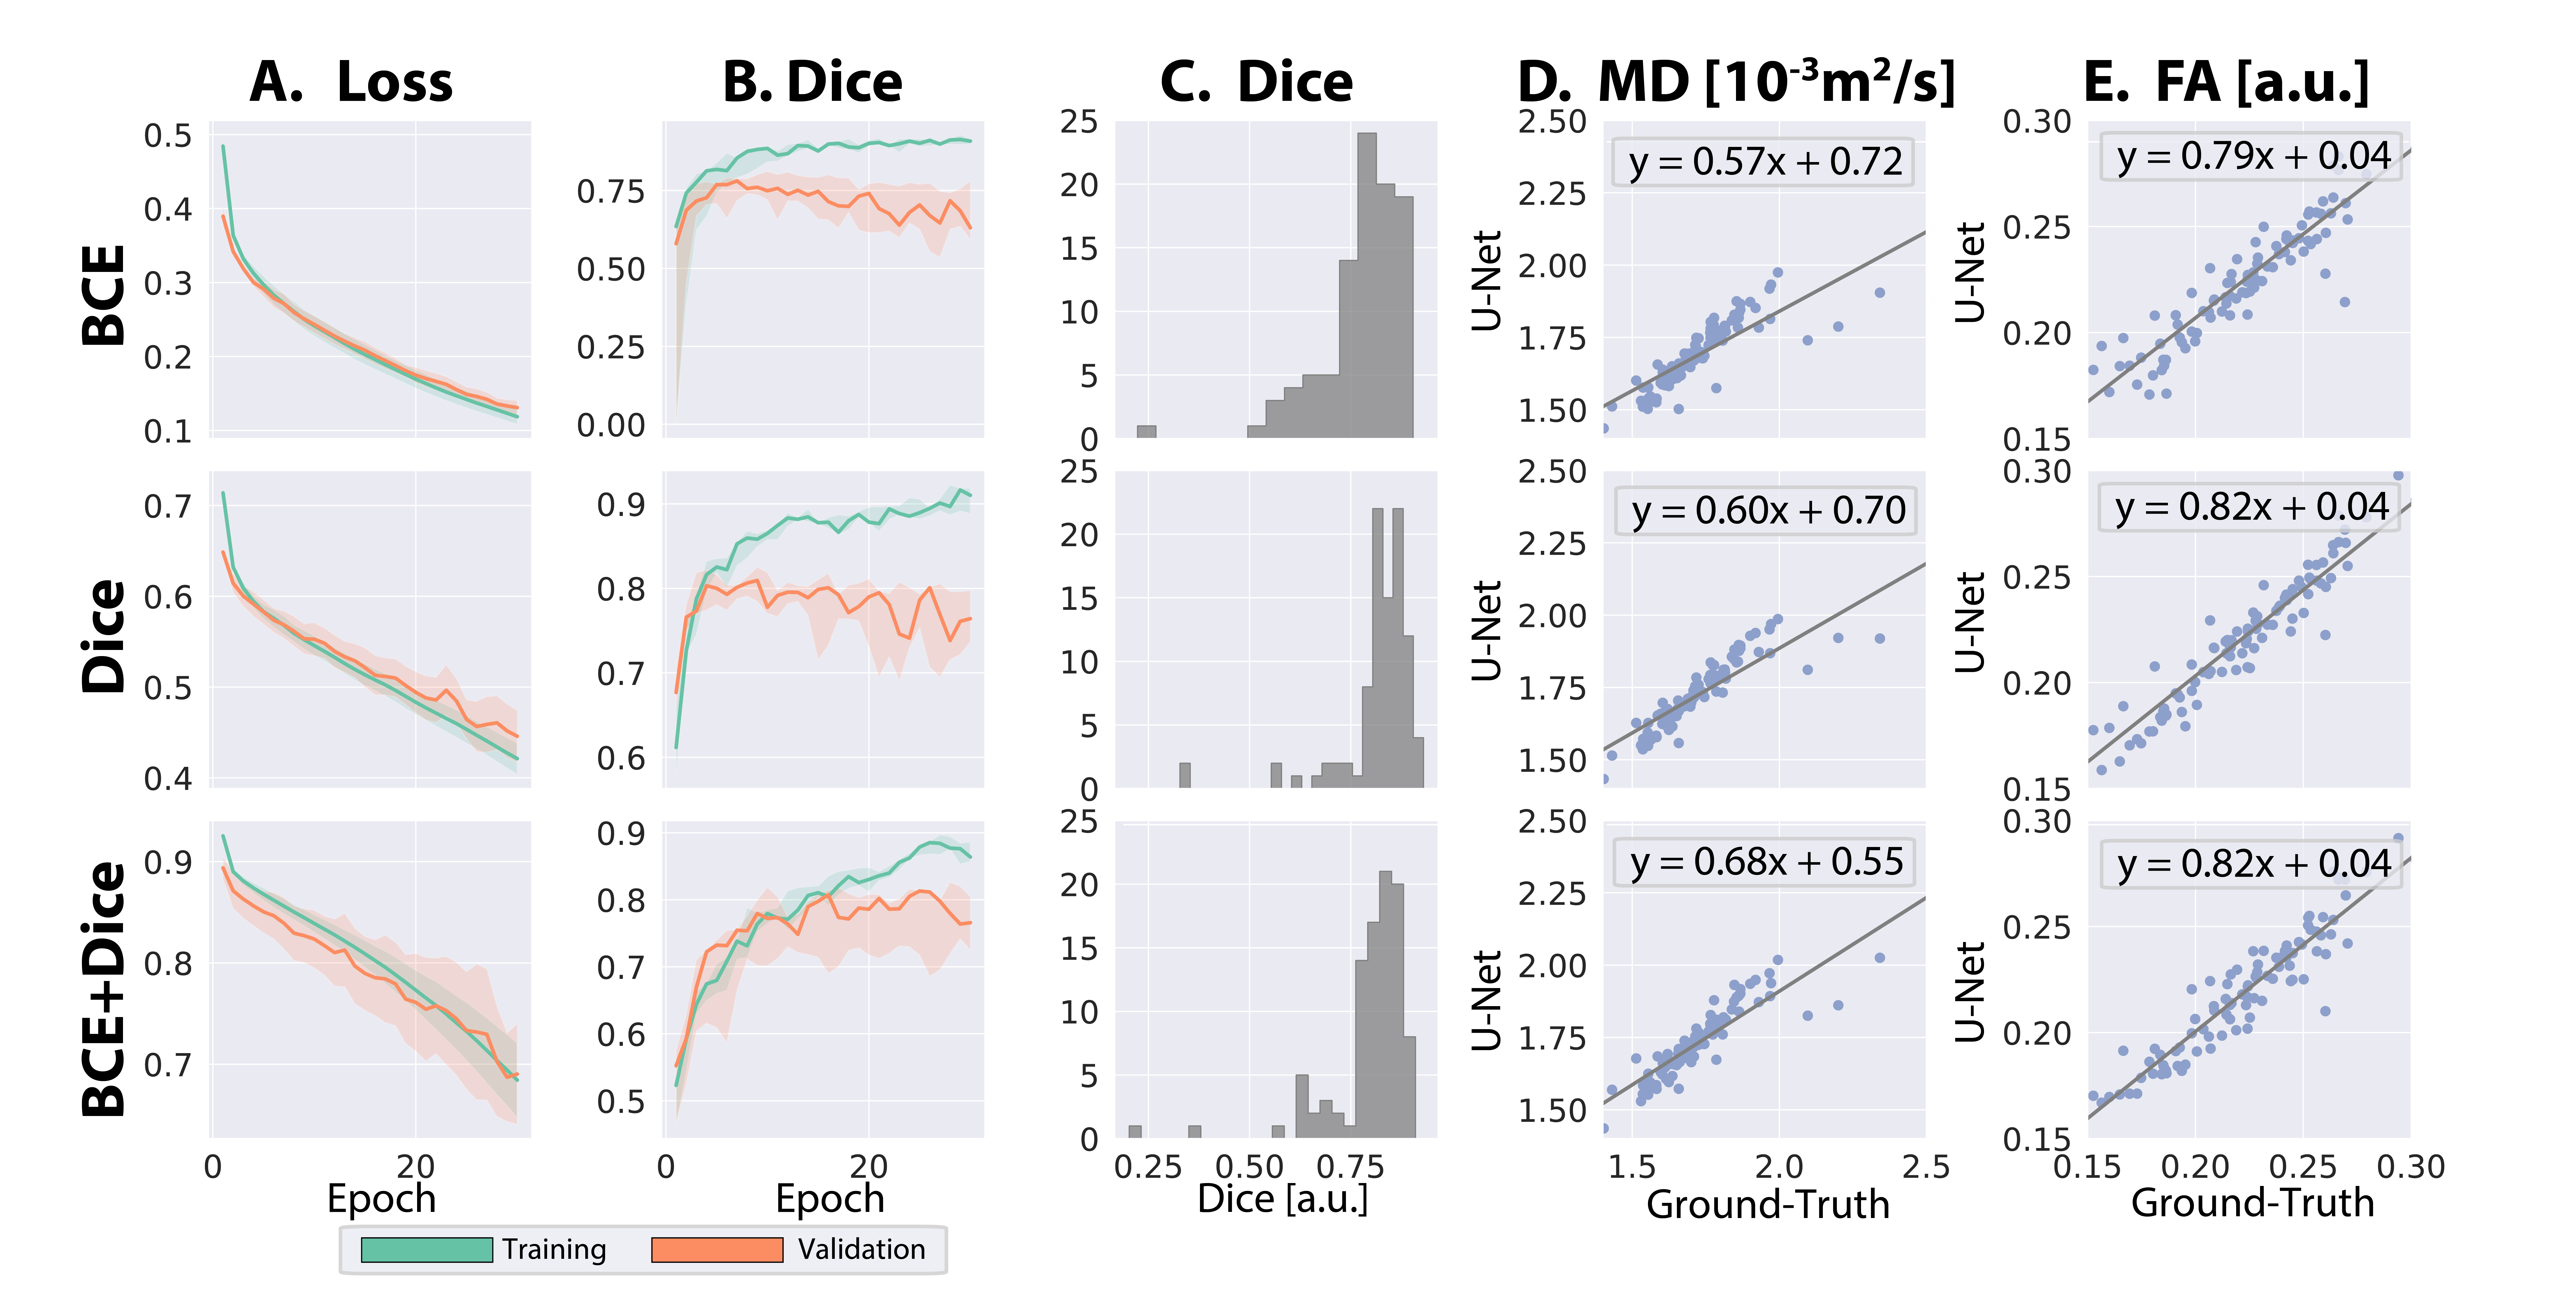
Fig-3. Analysis of testing, training, and validation of the U-Net for the 3 loss functions investigated. (A) Median Loss and (B) Dice scores over 30 epochs. While loss continues to decrease, dice scores level in the validation datasets. (C) Dice score distributions of test dataset show more consistency with Dice and BCE+Dice losses. (D) Median MD for Dice loss and BCE+Dice loss shower stronger agreement vs. BCE loss to ground truth. (E) FA values show similar consistency.