1798
Radiomics Analysis of Cardiovascular Magnetic Resonance Images in Patients with Fabry Disease1Department of Biomedical Engineering and Environmental Sciences, National Tsing Hua University, Hsinchu, Taiwan, 2Department of Radiology, Kaohsiung Veterans General Hospital, Kaohsiung, Taiwan, 3Department of electrical engineering, National Taiwan University of Science and Technology, Taipei, Taiwan
Synopsis
Keywords: Radiomics, Radiomics, Fabry Disease
Motivation: The assessment of clinical severity of Fabry disease (FD) is challenging. The radiomics analysis of CMR in patients with FD has not been studied.
Goal(s): The aim of this study was to establish radiomics classification model by using CMR cine images to distinguish FD patients from normal volunteers.
Approach: The classification model was built by linear SVM model with the top five features selected through ANOVA features selection.
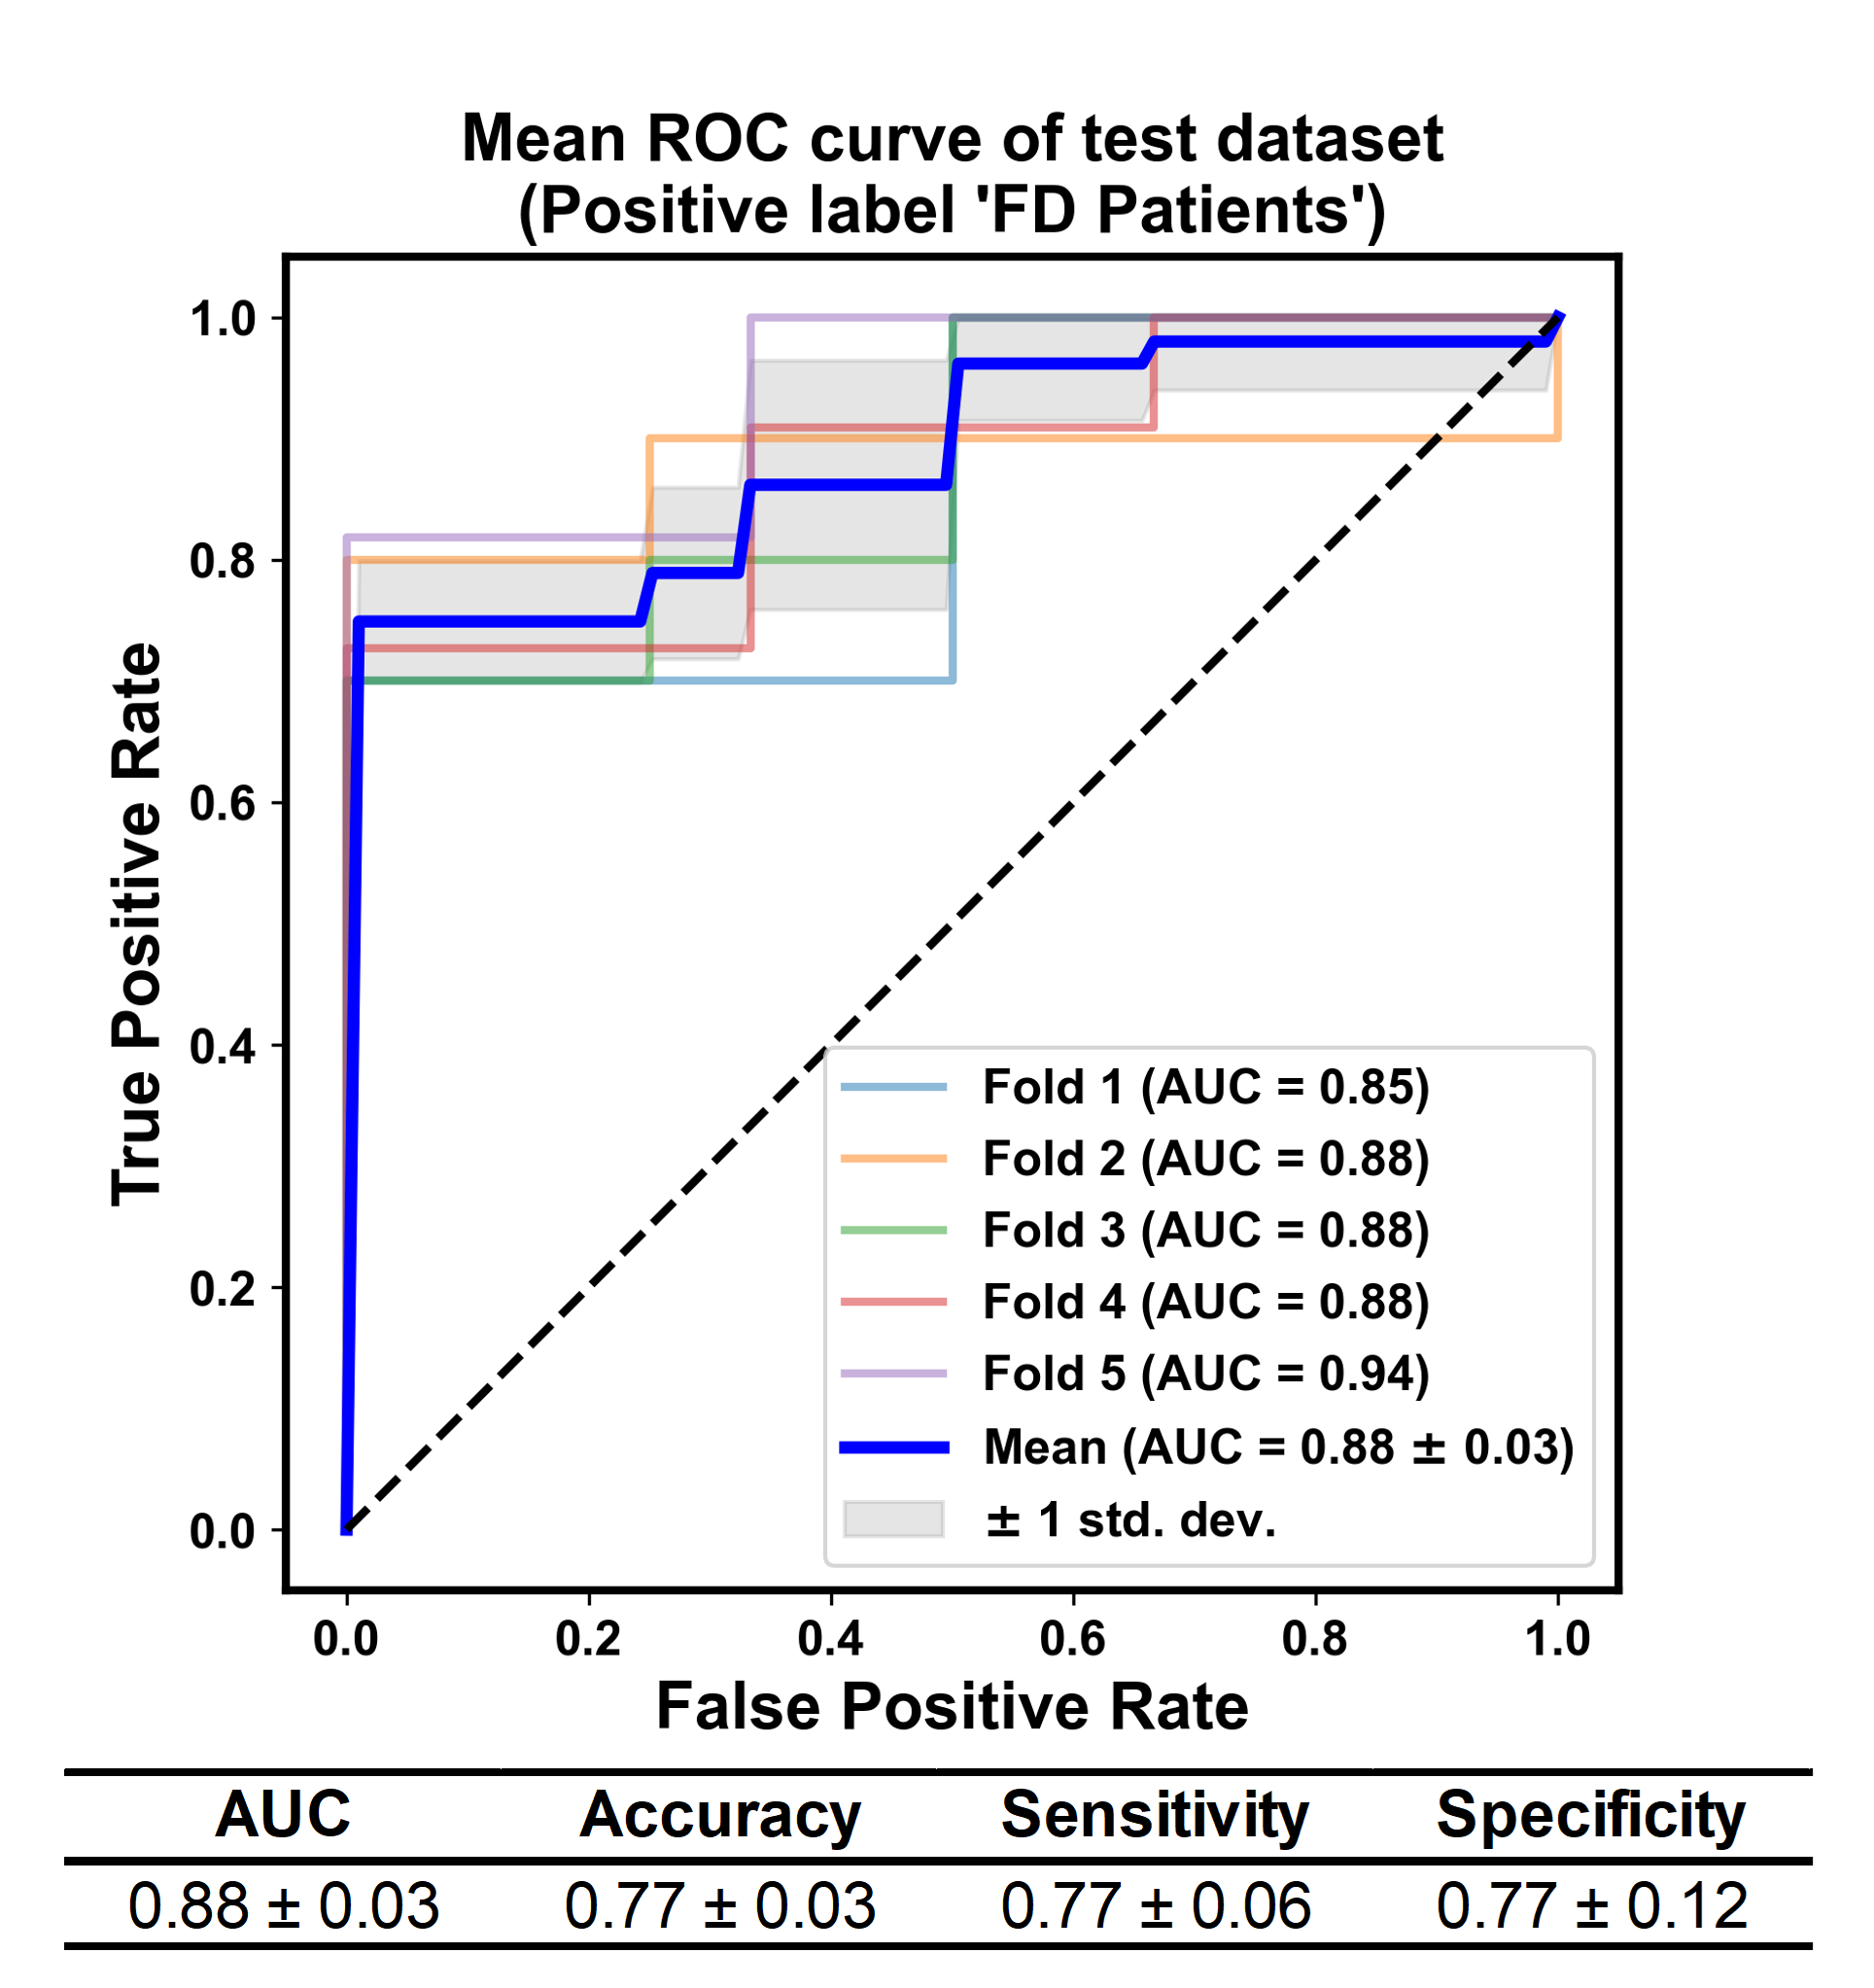
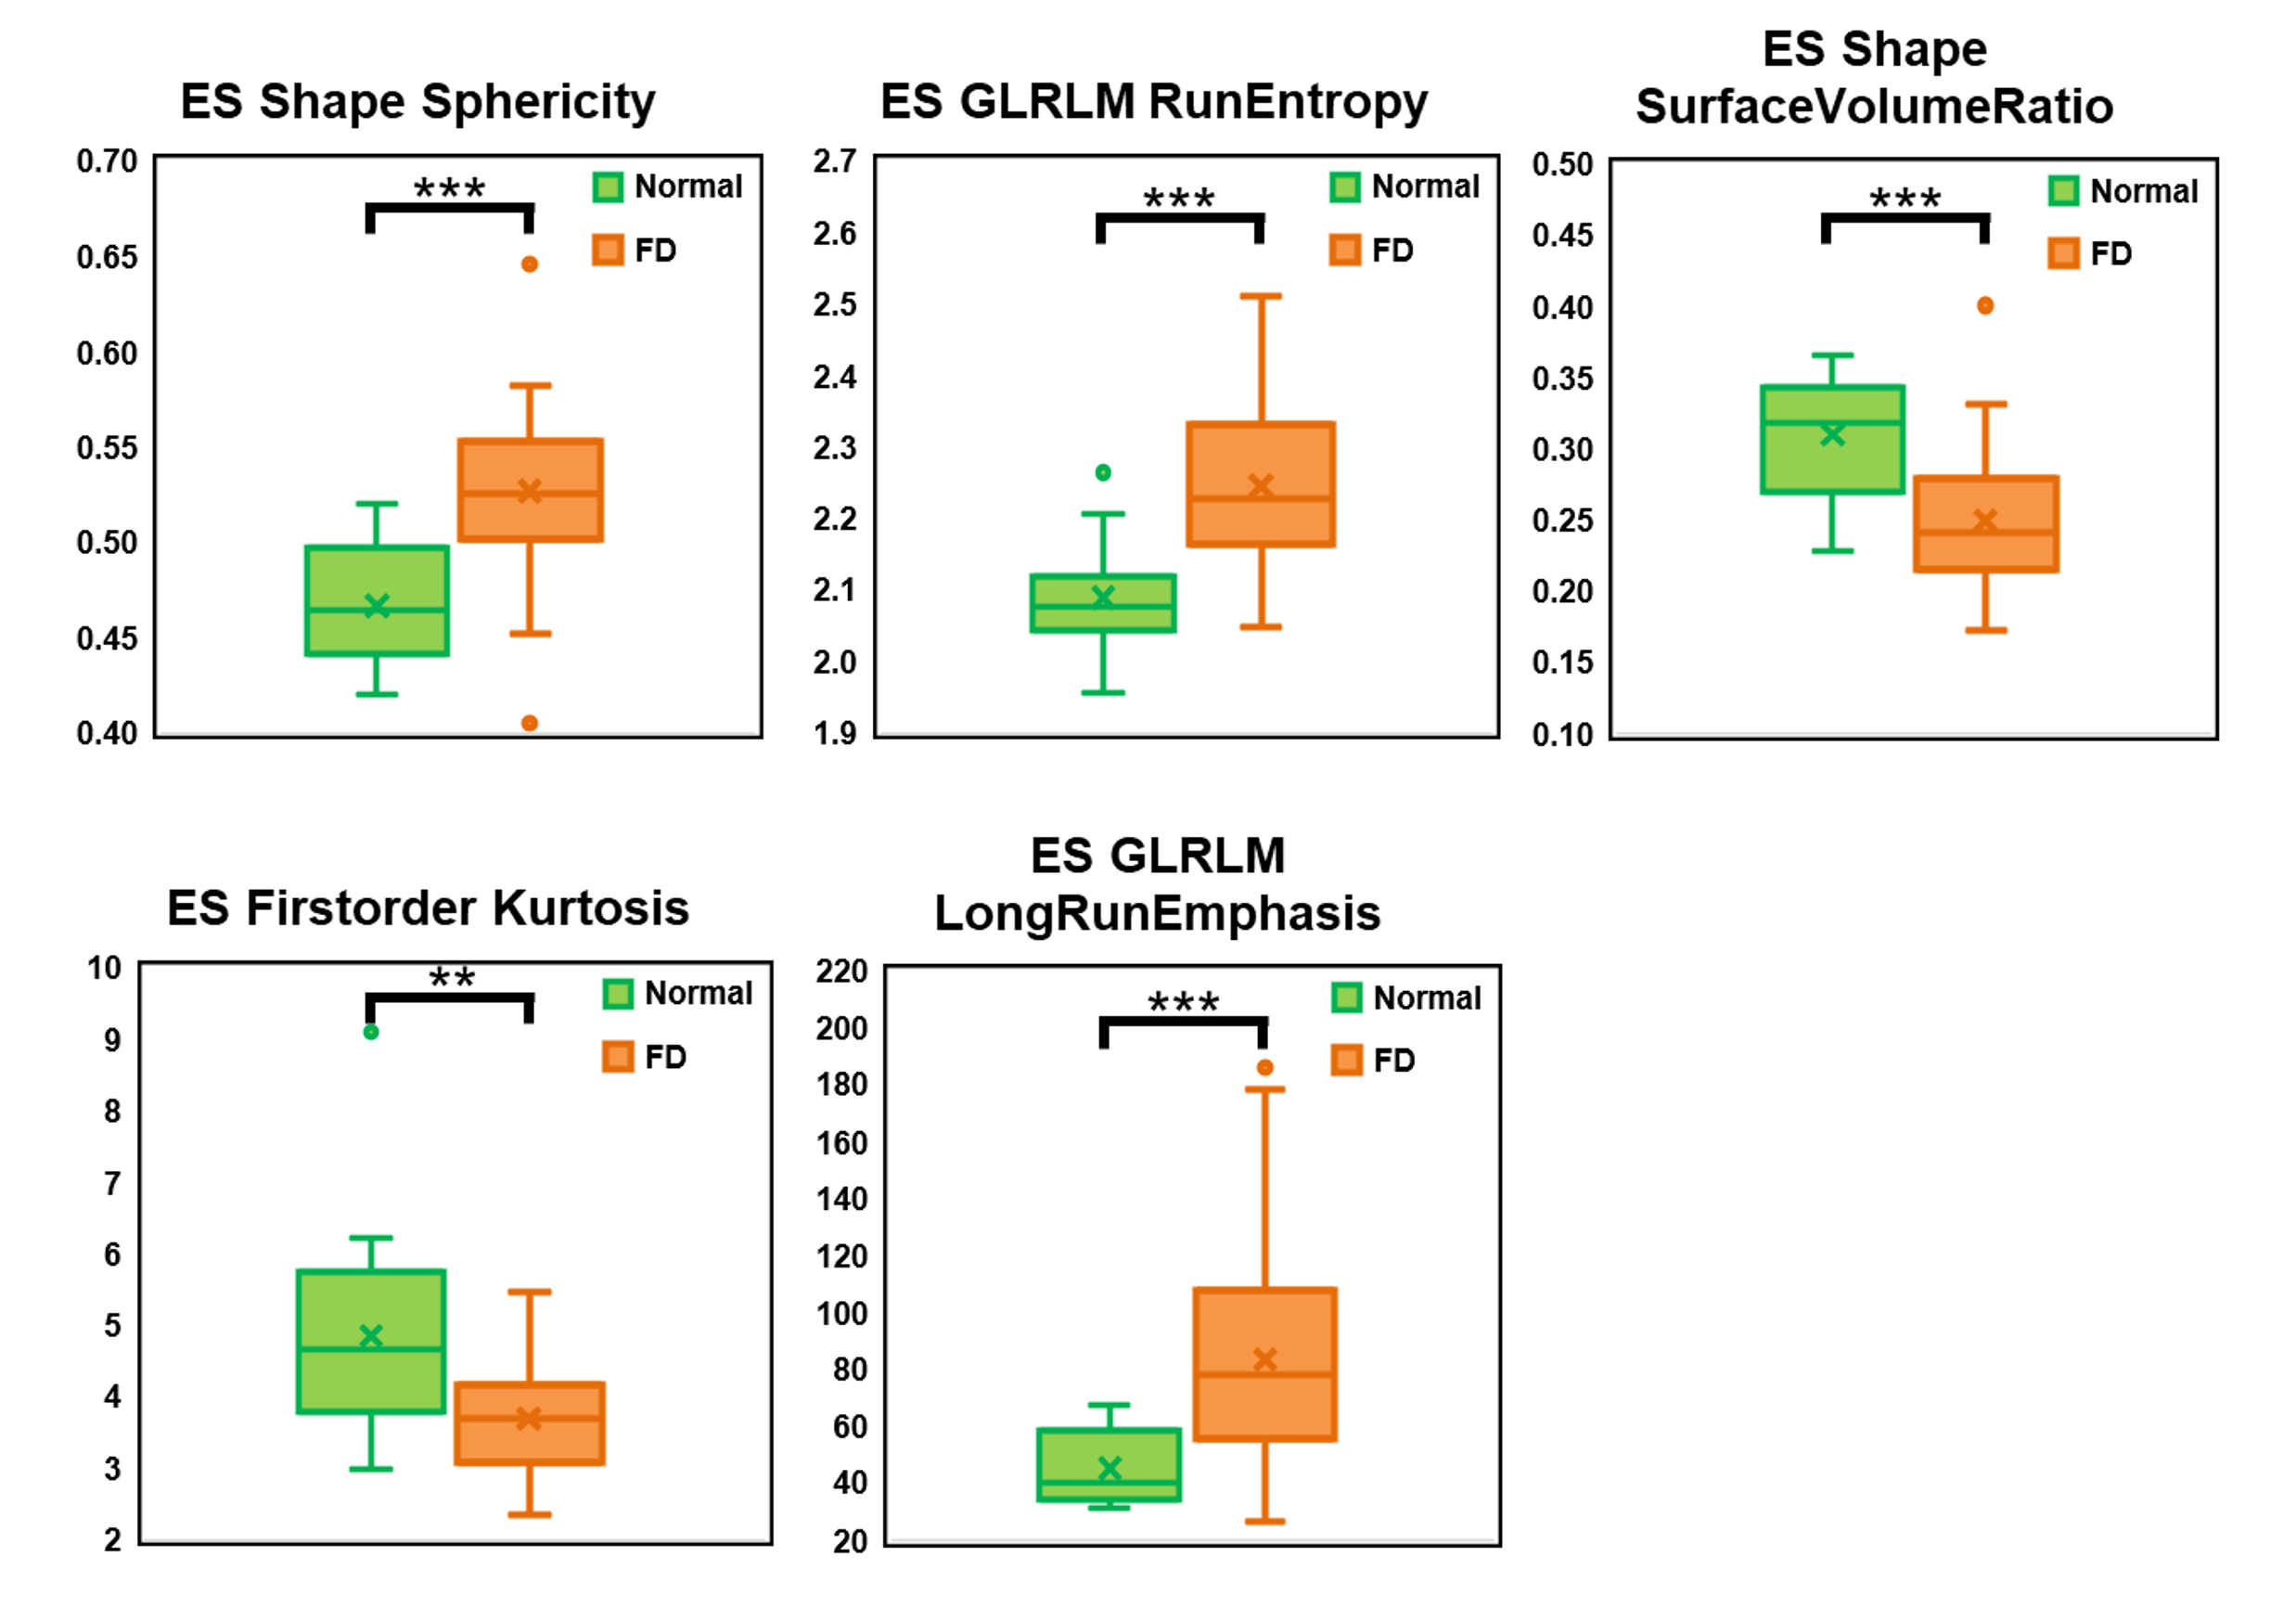
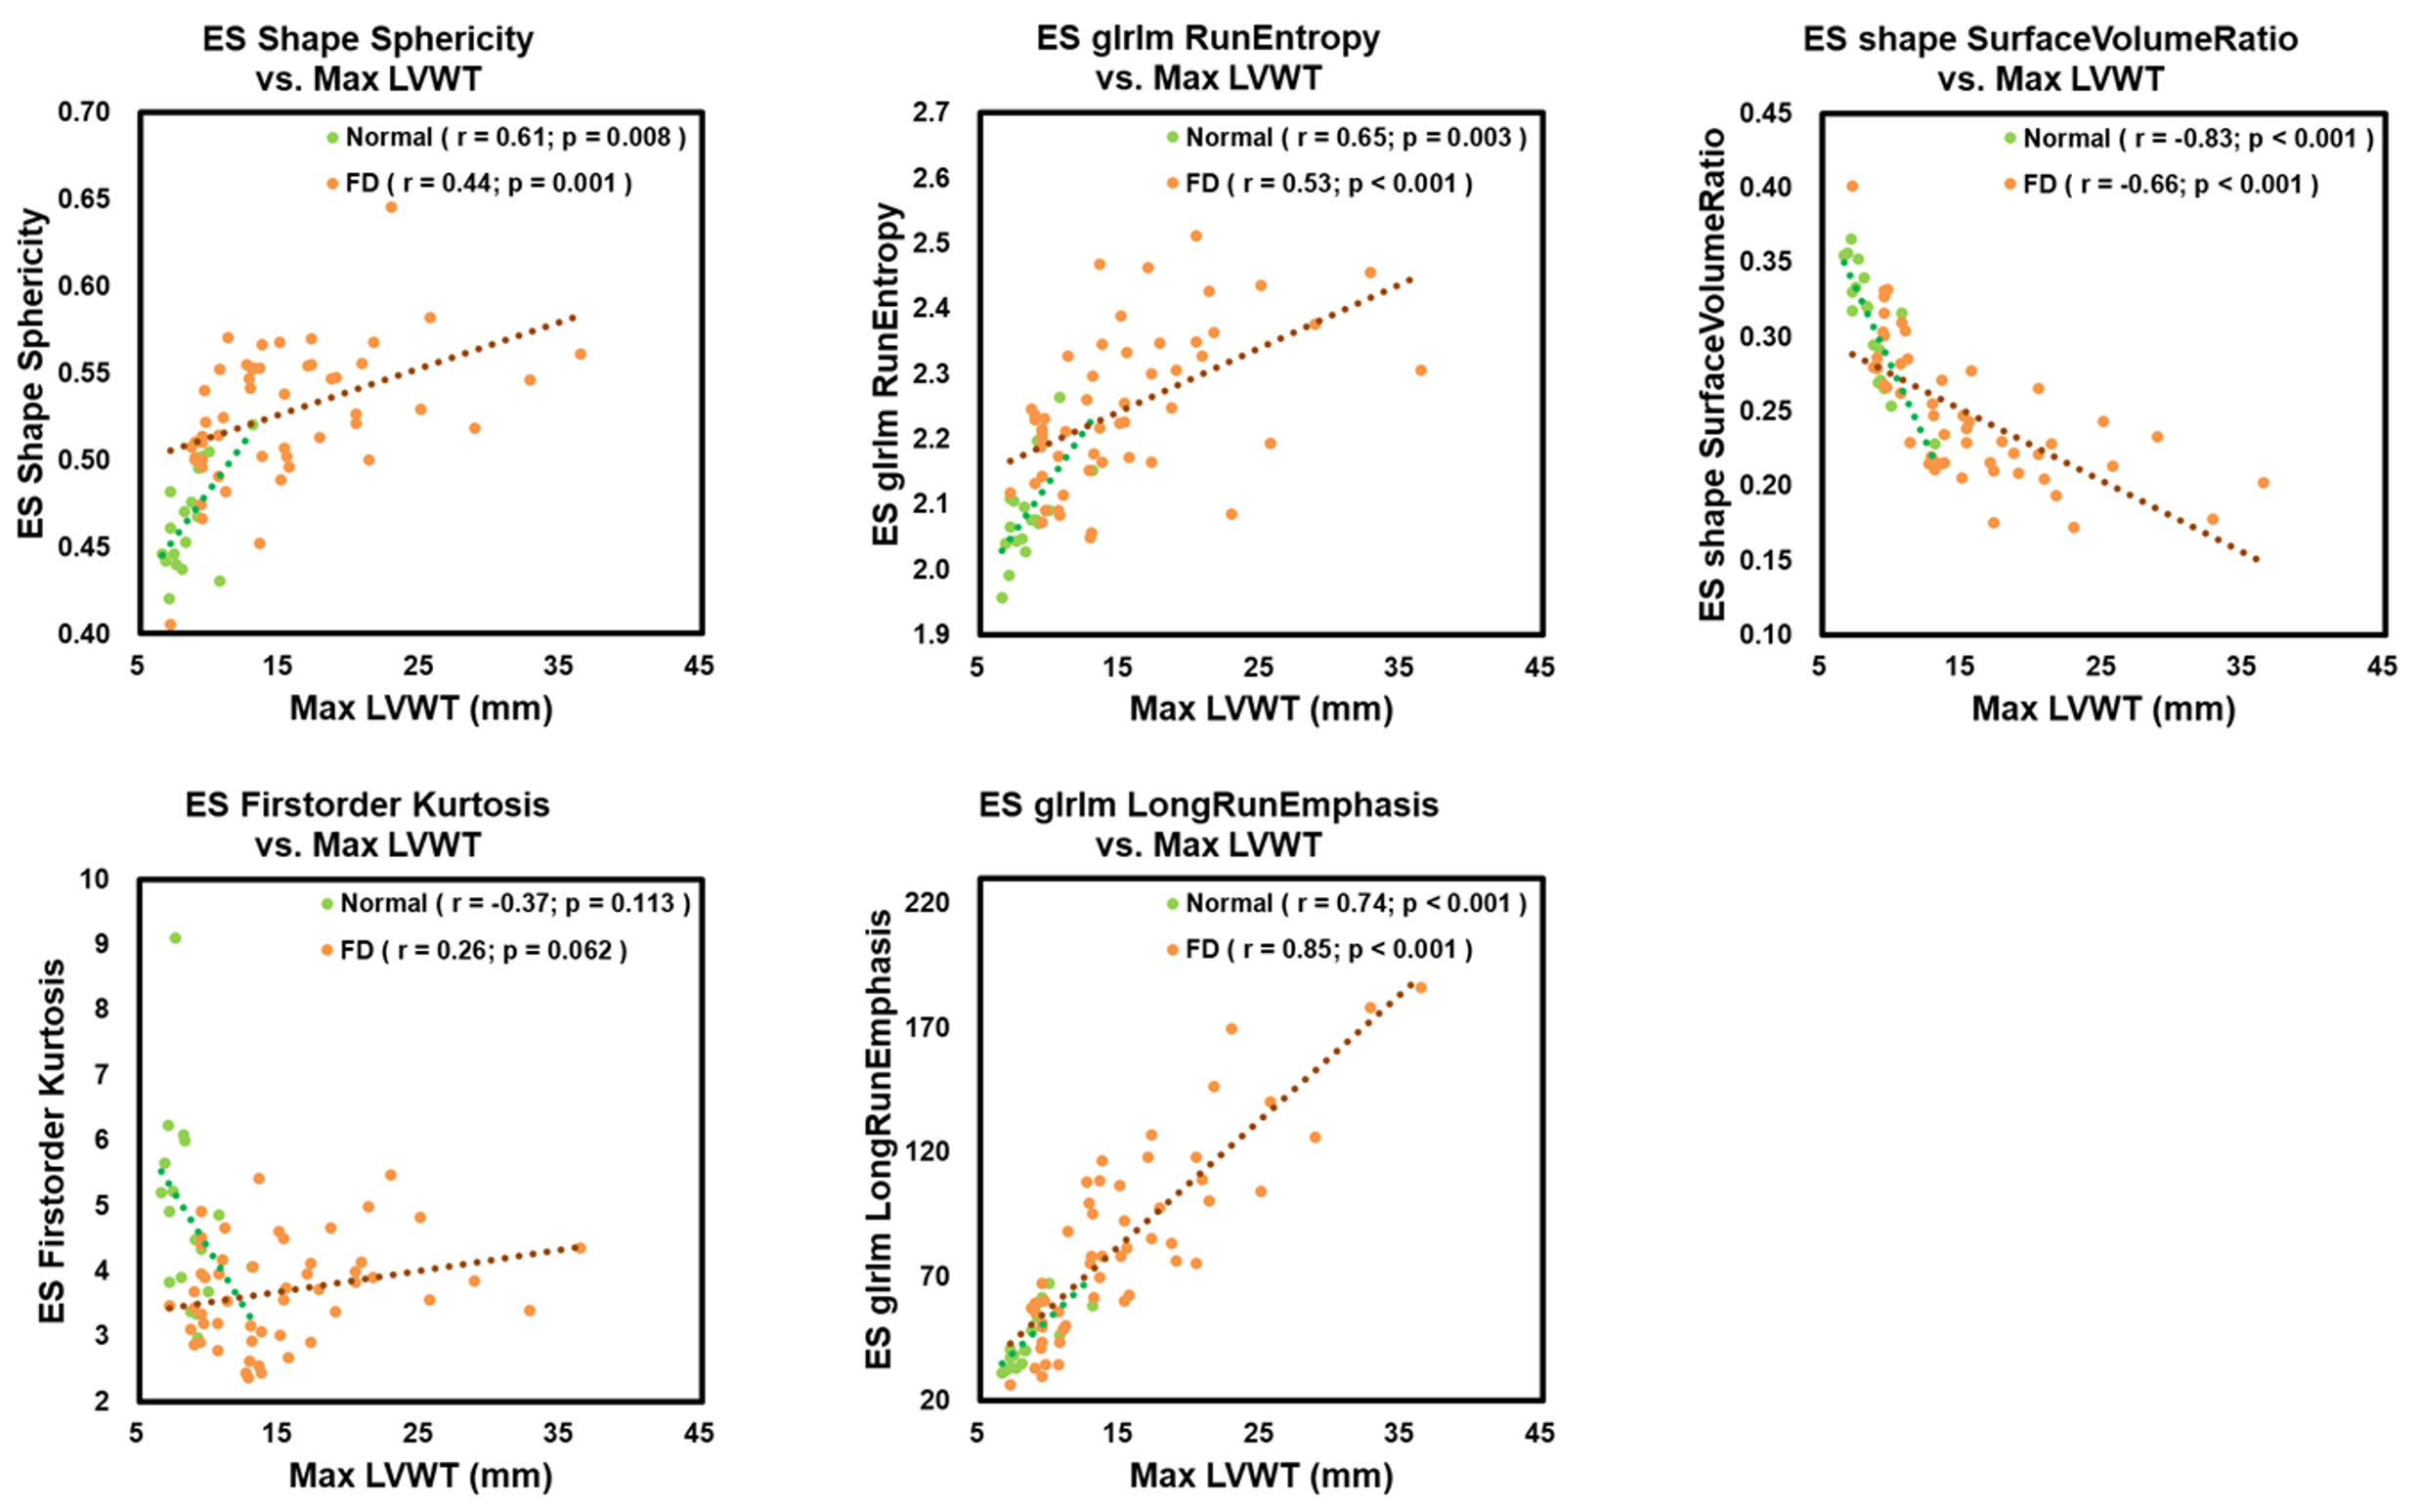
Results: Our model presented good performance with mean AUC of 0.88±0.03. The top 5 features were significantly different (p<0.05) between FD patients and normal volunteers. The selected radiomics features were associated with max. LVWT.
Impact: Radiomics analysis of CMR cine images can be used to distinguish FD patients from normal volunteers. The radiomics features may suggest a pathological association with LV remodeling.
Introduction
Fabry disease (FD) is an X-linked, rare, progressive disorder related to a genetic defect in alpha-galactosidase. The assessment of the clinical severity of Fabry disease is challenging, especially regarding cardiac involvement.1Radiomics refers to the extraction of quantitative features, which are unperceivable by a human eye, from radiologic images. Compared to conventional cardiovascular magnetic resonance (CMR) parameters, a previous study reported that radiomic features can enhance the performance of classification models in distinguishing hypertrophic cardiomyopathy from hypertensive heart disease.2 Although FD is one of the subtypes of hypertrophic cardiomyopathy, the radiomic analysis of CMR cine images in patients with FD has not been investigated thoroughly. The aim of this study was to employ radiomic analysis of CMR cine images to distinguish FD patients from normal volunteers.
Methods
The study included 18 normal volunteers (age: 21±1 years, 10 males) and 52 FD patients (age: 55±11 years, 21 males).All MR images were acquired in a 3T MR scanner (Skyra, Siemens, Erlangen, Germany). Cine steady-state free precession images in a short-axis view were acquired with retrospective ECG-gating and breath-hold technique. The scanning parameters are as follows: TR/TE=3.2/1.7 ms, flip angle=54º, voxel size=1.15×1.15×8 mm3, gap=2 mm.
Figure 1 illustrates the workflow of the present work. An institution-developed semi-automatic segmentation tool was used to delineate the regions of interest (ROIs) of endocardial and epicardial borders of the myocardium on basal, middle, and apical slices at end-systolic (ES) and end-diastolic (ED) phases. These ROIs in both groups were used for radiomic features extraction. PyRadiomics was used to extract 107 features in categories of shape (N=14), first-order (N=18), and 2nd-order (N=75).3 Therefore, in total of 214 features for ED and ES phases were extracted in this study.
The classification model was trained by linear SVM with a 5-fold cross-validation in the outer loop and a 3-fold cross-validation in the inner loop.4 The ANOVA feature selection method in the inner loop was applied to select the most significant five features (in Table 1) in the training and validation datasets. The model performance was evaluated using receiver operating characteristic (ROC) curve analysis. The Mann-Whitney U-test was used to compare the differences in features between normal volunteers and FD patients.5 The Pearson correlation was used to evaluate the correlation between feature values and maximum left ventricular wall thickness (max. LVWT).
Results
In Figure 2, the classification model presented an area under the curve (AUC) of 0.88±0.03 in distinguishing FD patients from normal volunteers. The accuracy, sensitivity, and specificity of the classification model were 0.77±0.03, 0.77±0.06, and 0.77±0.12, respectively.Figure 3 illustrates that the top five selected features demonstrated significant differences (all p<0.05) between FD and normal groups. In Figure 4, the max. LVWT exhibited positive correlations with ES Sphericity (normal: r=0.61, p=0.008; FD: r=0.44, p=0.001), ES RunEntropy (normal: r=0.65, p=0.003; FD: r =0.53, p<0.001), and ES GLRLM LongRunEmphasis (normal: r = 0.74, p<0.001; FD: r = 0.85, p<0.001). The max. LVWT showed negative correlation with ES Shape SurfaceVolumeRatio in both groups (normal: r=-0.83, p<0.001, FD: r=-0.66, p<0.001).
Discussion
The proposed radiomics classification model established by using CMR cine images demonstrated good performance in distinguishing FD patients from normal volunteers. Four of the selected top five features exhibited significant correlations with max. LVWT.A previous study reported that a radiomics model could effectively distinguished hypertrophic cardiomyopathy from hypertensive heart disease.2 FD is one of the subtypes of hypertrophic cardiomyopathy but was not included in the study population in the previous study. Our result presented that radiomics analysis of CMR cine images can help in identifying myocardial involvements in FD patients, suggesting the potential of radiomics analysis in diagnosis of FD patients.
The RunEntropy measures the uncertainty in the distribution of run lengths and gray levels. The higher RunEntropy in FD group than in normal group reflected more heterogeneous tissue texture patterns in the LV,6 which might be attributed to the heterogenous accumulation of globotriaosylceramide (GL-3) in the myocardium or myocardial fibrosis in FD patients. The moderate positive correlations between max. LVWT and ES RunEntropy and ES Sphericity might indicate the LV remodeling resulting from LV hypertrophy and fibrosis7 in FD patients.
Conclusion
The radiomics classification model established by CMR cine images can distinguish FD patients from normal volunteers. The selected radiomics features were associated with max. LVWT and might reveal information regarding LV remodeling and myocardial fibrosis in FD patients.Acknowledgements
No acknowledgement found.References
- Tanislav C, Guenduez D, Liebetrau C, et al. Cardiac Troponin I: A Valuable Biomarker Indicating the Cardiac Involvement in Fabry Disease. PLoS One. 2016;11(6):e0157640. Published 2016 Jun 20.
- Liu Q, Lu Q, Chai Y, et al. Papillary-Muscle-Derived Radiomic Features for Hypertrophic Cardiomyopathy versus Hypertensive Heart Disease Classification. Diagnostics (Basel). 2023;13(9):1544.
- van Griethuysen JJM, Fedorov A, Parmar C, et al. Computational Radiomics System to Decode the Radiographic Phenotype. Cancer Res. 2017;77(21):e104-e107.
- Pedregosa et al., Scikit-learn: Machine Learning in Python. JMLR 12, pp. 2825-2830, 2011.
- Virtanen P, Gommers R, Oliphant TE, et al. SciPy 1.0: fundamental algorithms for scientific computing in Python. Nat Methods. 2020;17(3):261-272.
- Shi J, Bao G, Hong J, et al. Deciphering CT texture features of human visceral fat to evaluate metabolic disorders and surgery-induced weight loss effects. EBioMedicine. 2021;69:103471.
- Spinelli L, Giugliano G, Imbriaco M, et al. Left ventricular radial strain impairment precedes hypertrophy in Anderson-Fabry disease. Int J Cardiovasc Imaging. 2020;36(8):1465-1476.
Figures
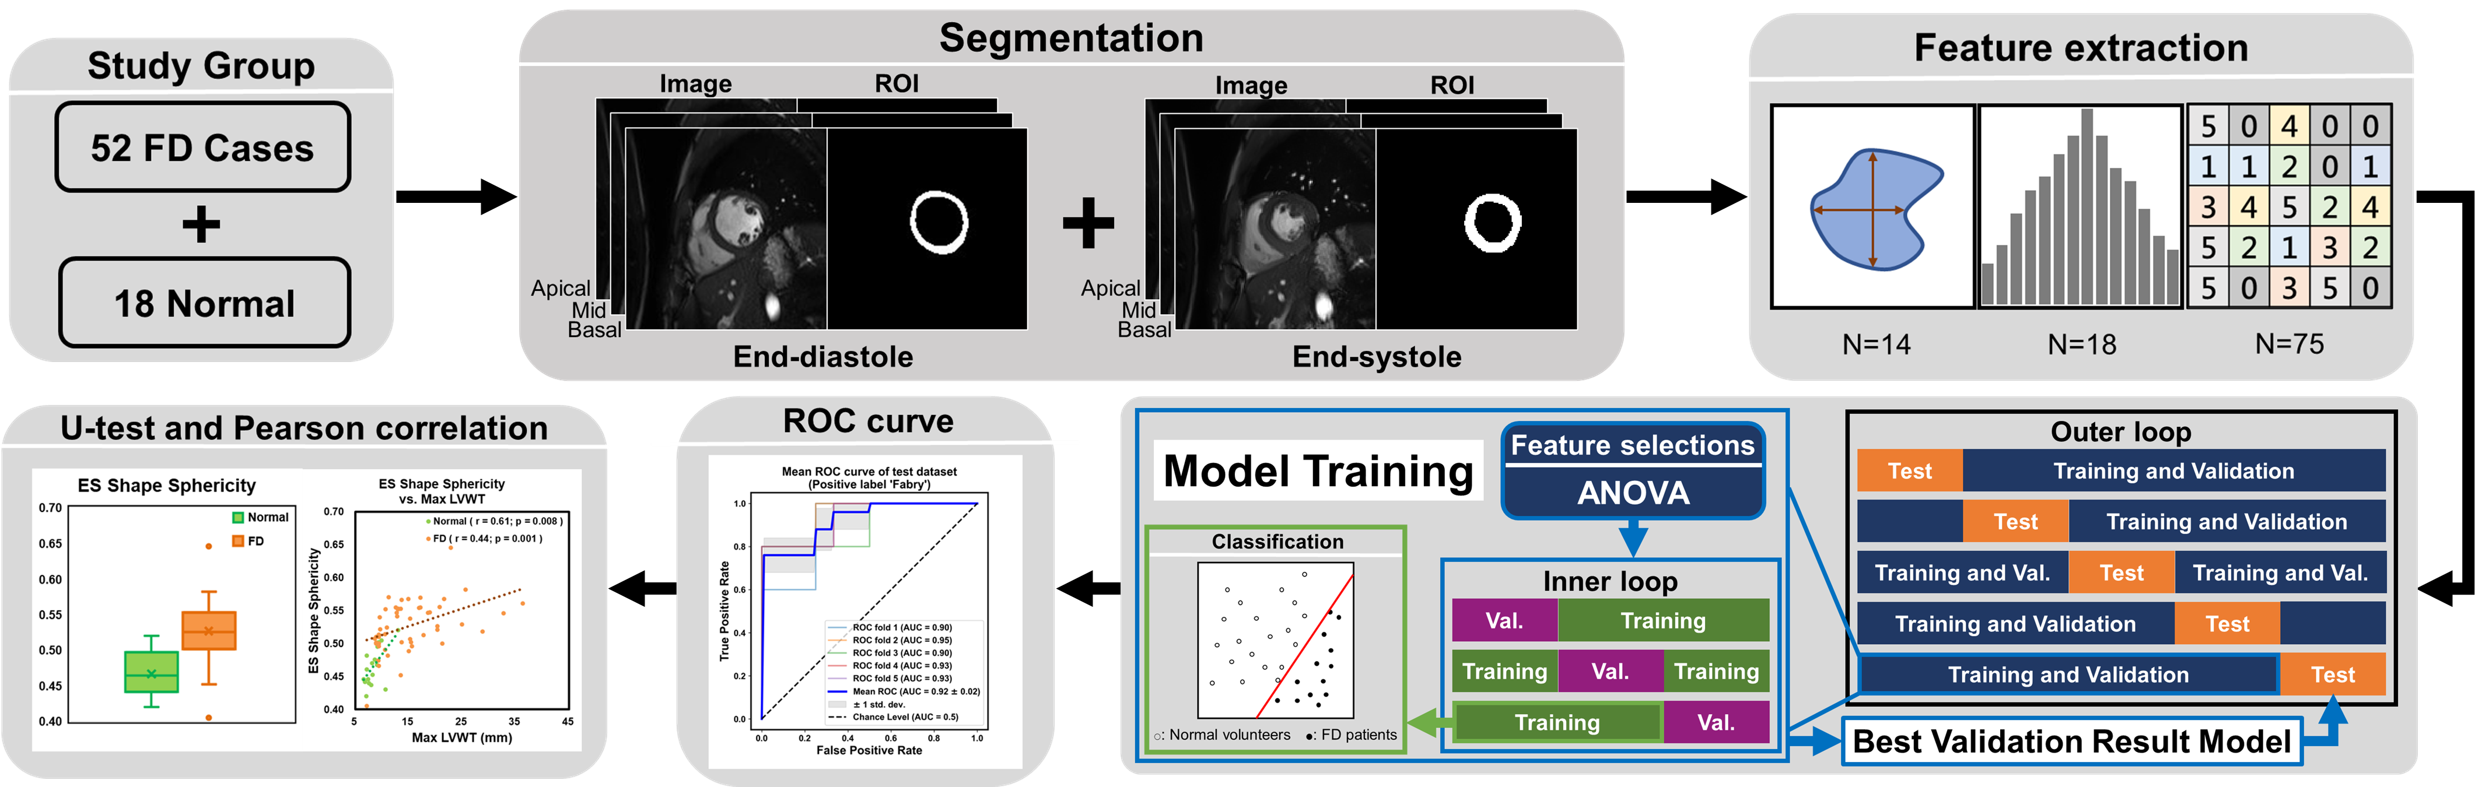
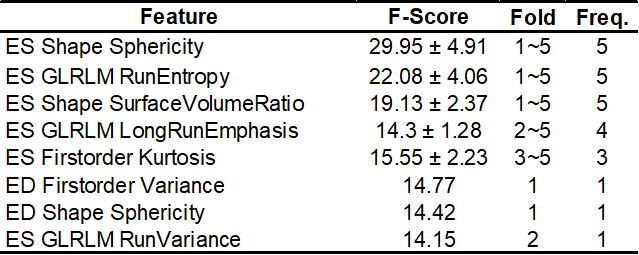
Table 1. Top 5 features selected by ANOVA in each fold
ES: end-systolic phase, ED: end-diastolic phase, GLRLM: gray-level size zone matrix, Freq. : The frequency of features selected by feature selection in each fold.