1796
Myocardial tissue characterization by CMR for the evaluation of heart failure with preserved ejection fraction in hypertrophic cardiomyopathy.1Department of MRI, Chinese National Center for Cardiovascular Diseases, Beijing, China
Synopsis
Keywords: Heart Failure, Cardiomyopathy
Motivation: The association between myocardial tissue characteristics detected by cardiac magnetic resonance (CMR) and heart failure with preserved ejection fraction (HFpEF) in hypertrophic cardiomyopathy (HCM) remains unclear.
Goal(s): We sought to evaluate the role of myocardial tissue characteristics detected by CMR in the identification of HFpEF in HCM.
Approach: CMR was used to access tissue characteristics including native T1 values, extracellular volume fraction (ECV) and indexed ECV (iECV).
Results: Native T1 was a sensitive biomarker independently associated with the diagnosis of HFpEF-HCM.
Impact: The inclusion of myocardial tissue characteristics by cardiac magnetic resonance in the diagnostic algorithms of heart failure with preserved ejection fraction in patients with hypertrophic cardiomyopathy should be considered in clinical practice and future studies.
Objectives
The majority of heart failure (HF) in hypertrophic cardiomyopathy (HCM) manifests as a phenotype with preserved left ventricular (LV) ejection fraction (HFpEF). However, the association between myocardial tissue characteristics detected by cardiac magnetic resonance (CMR) and HFpEF in HCM remains unclear. This study sought to evaluate the role of myocardial tissue characteristics detected by CMR in the identification of HFpEF in HCM.Methods
In this prospective study, 133 patients with HCM were consecutively enrolled for biomarker testing, echocardiography and CMR including Late gadolinium-enhanced (LGE) imaging and T1 mapping to access tissue characteristics including native T1 values, extracellular volume fraction (ECV) and indexed ECV (iECV).Results
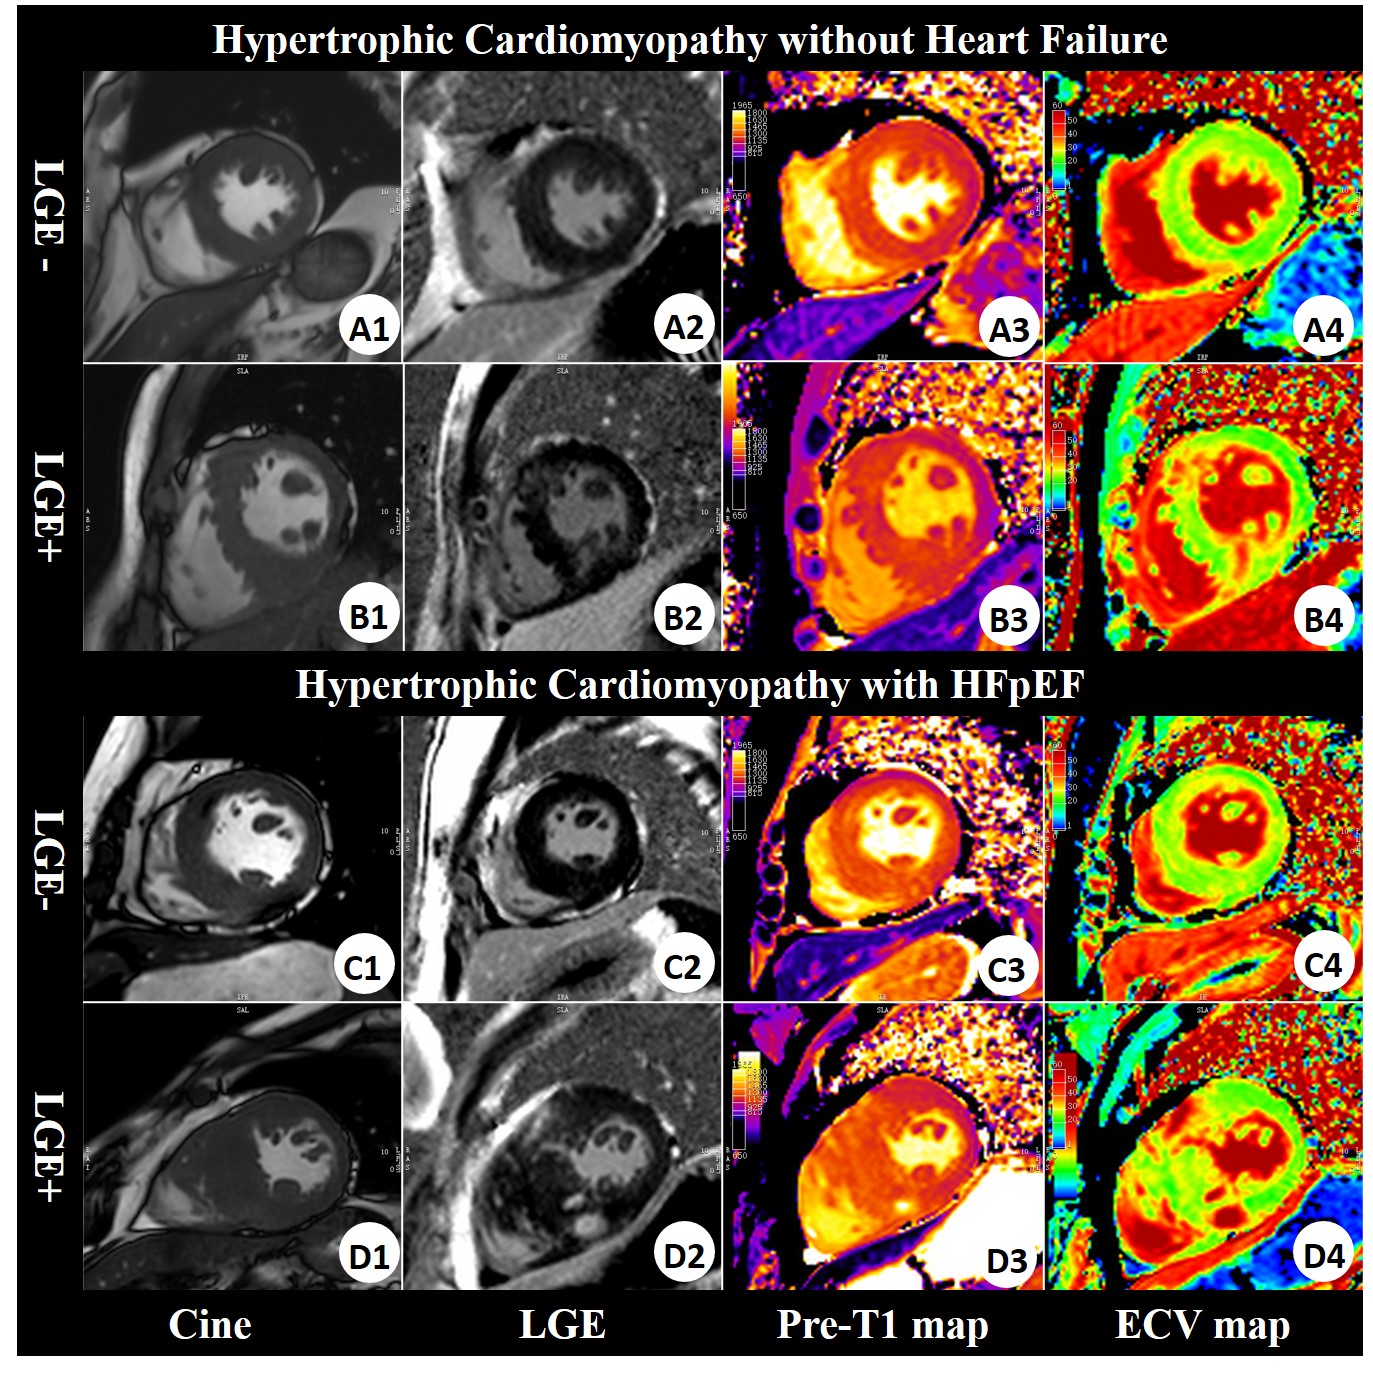
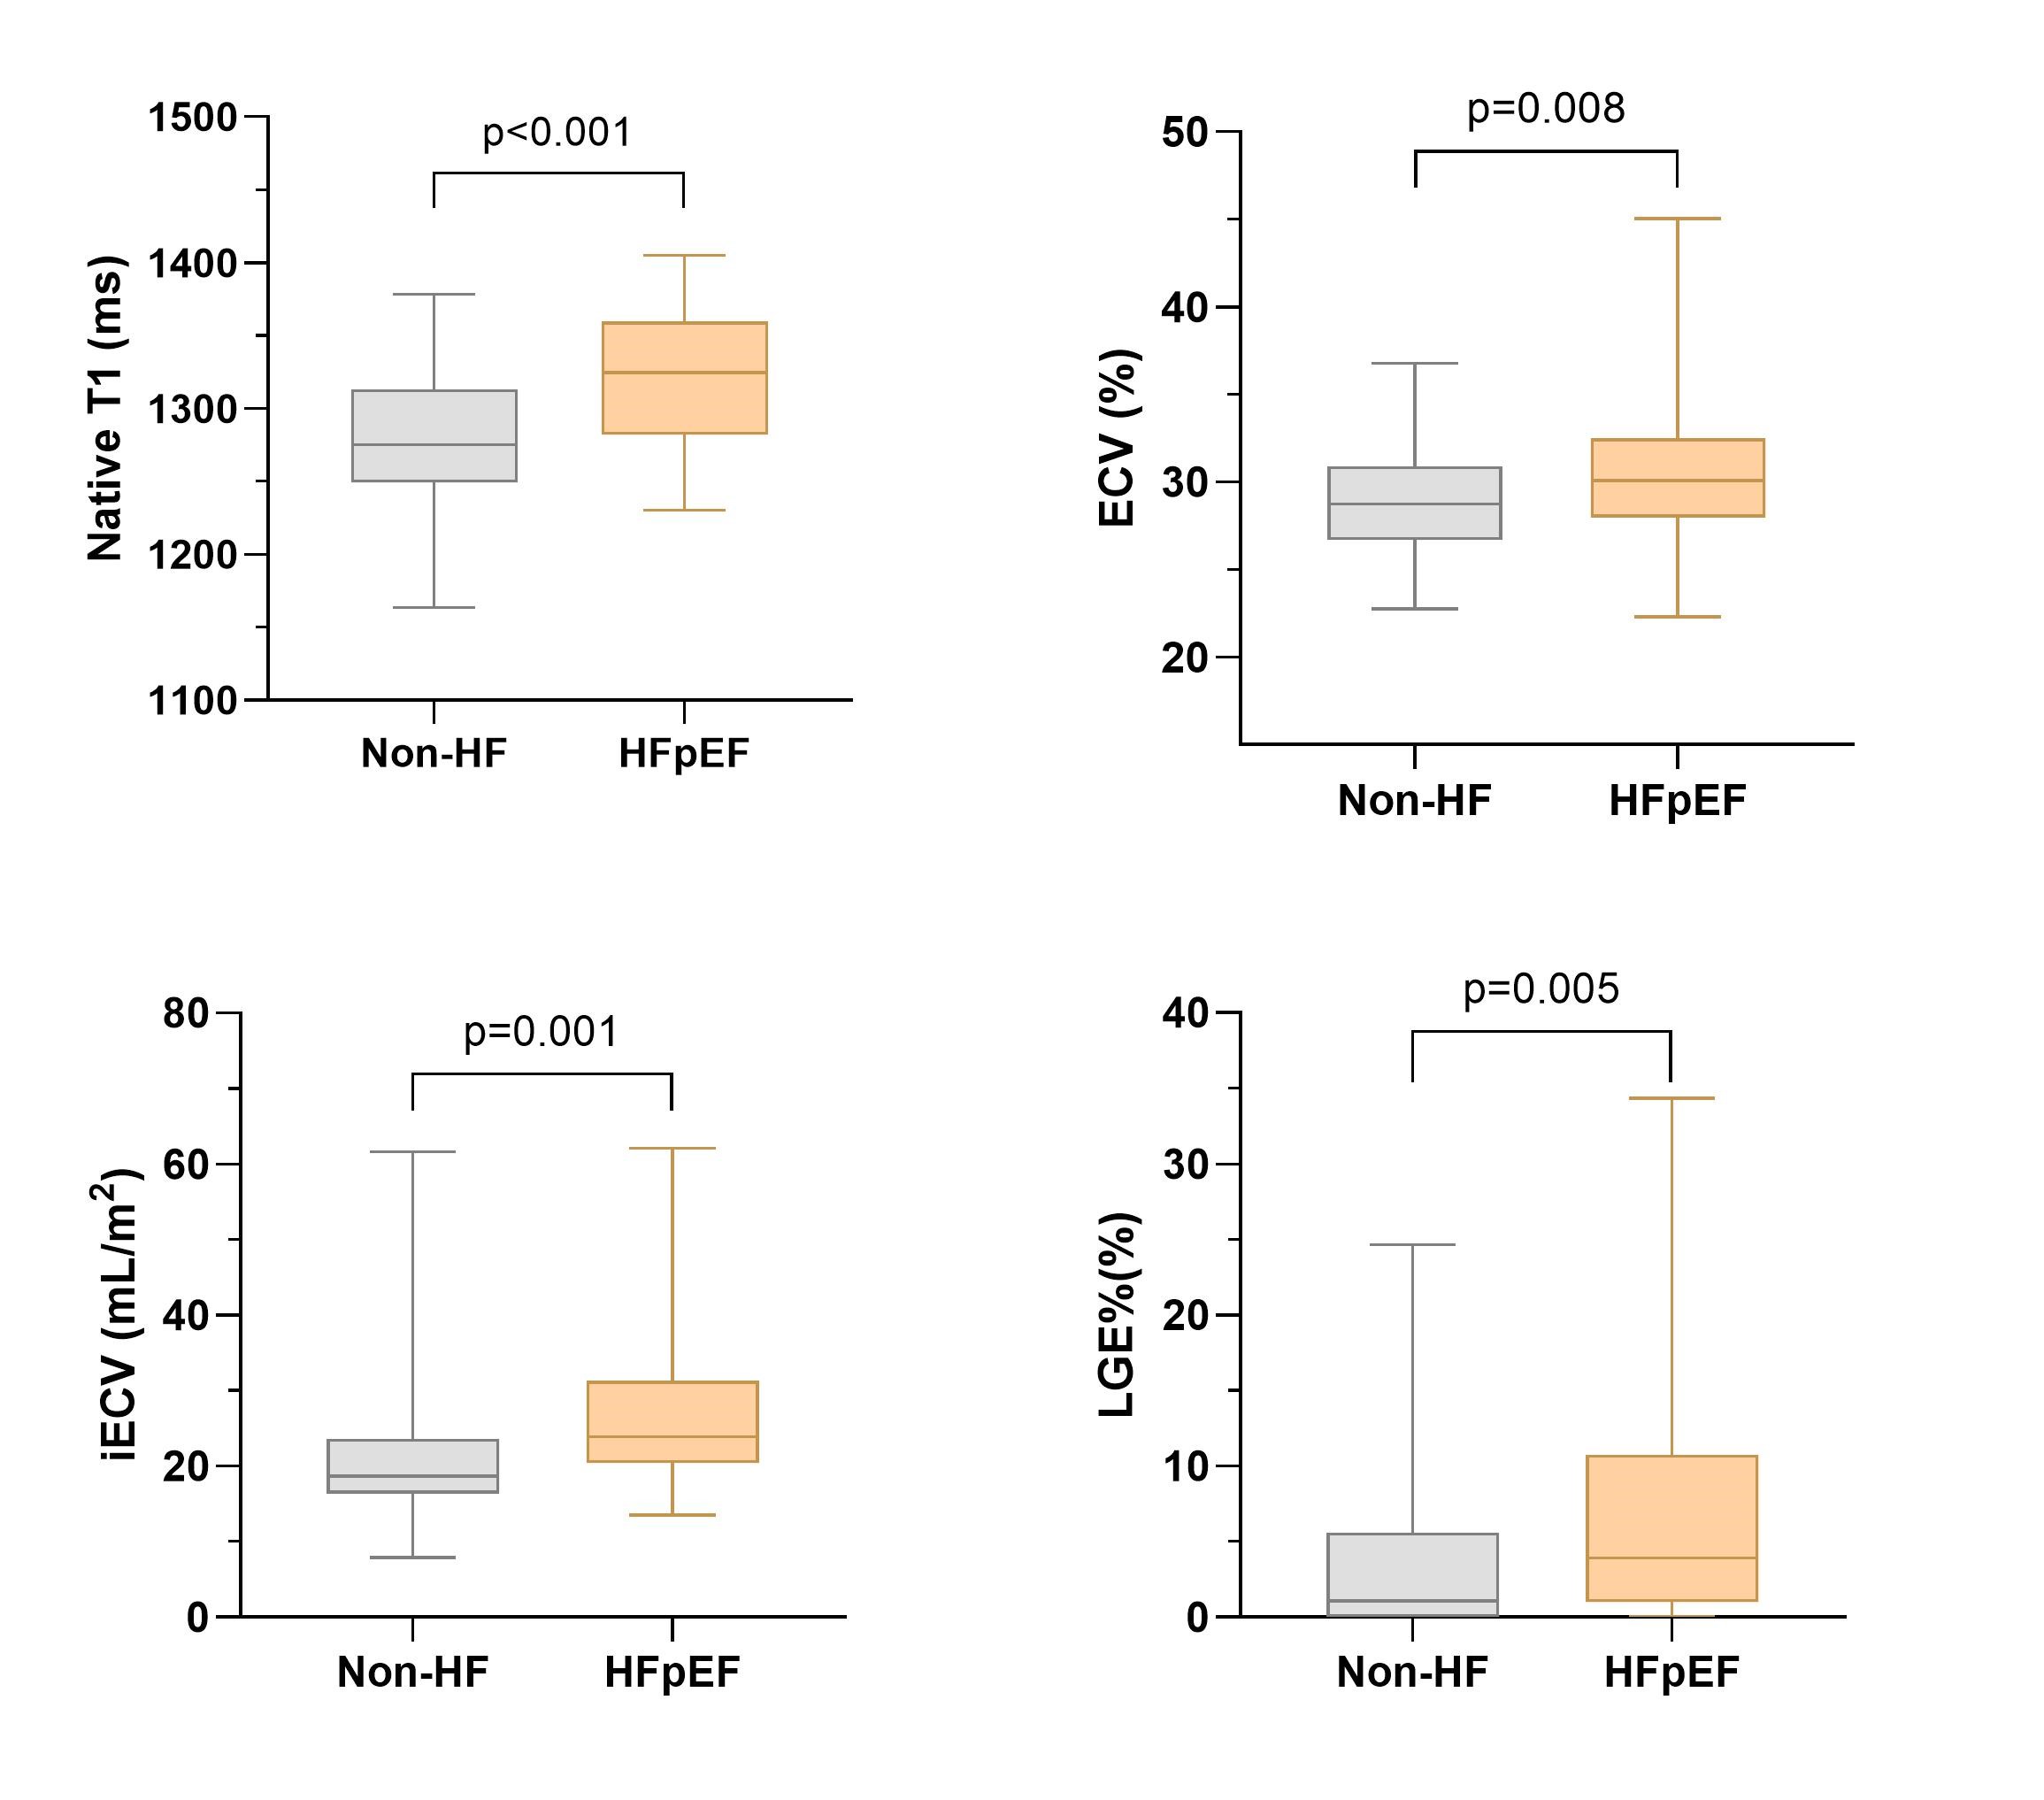
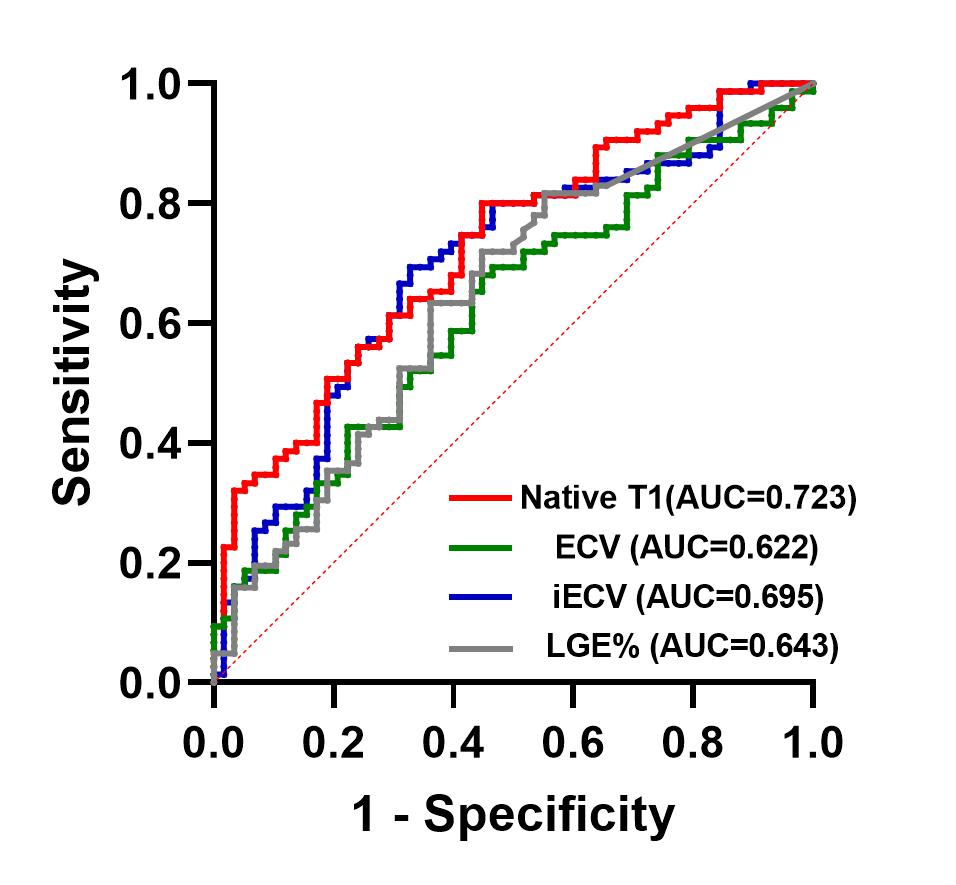
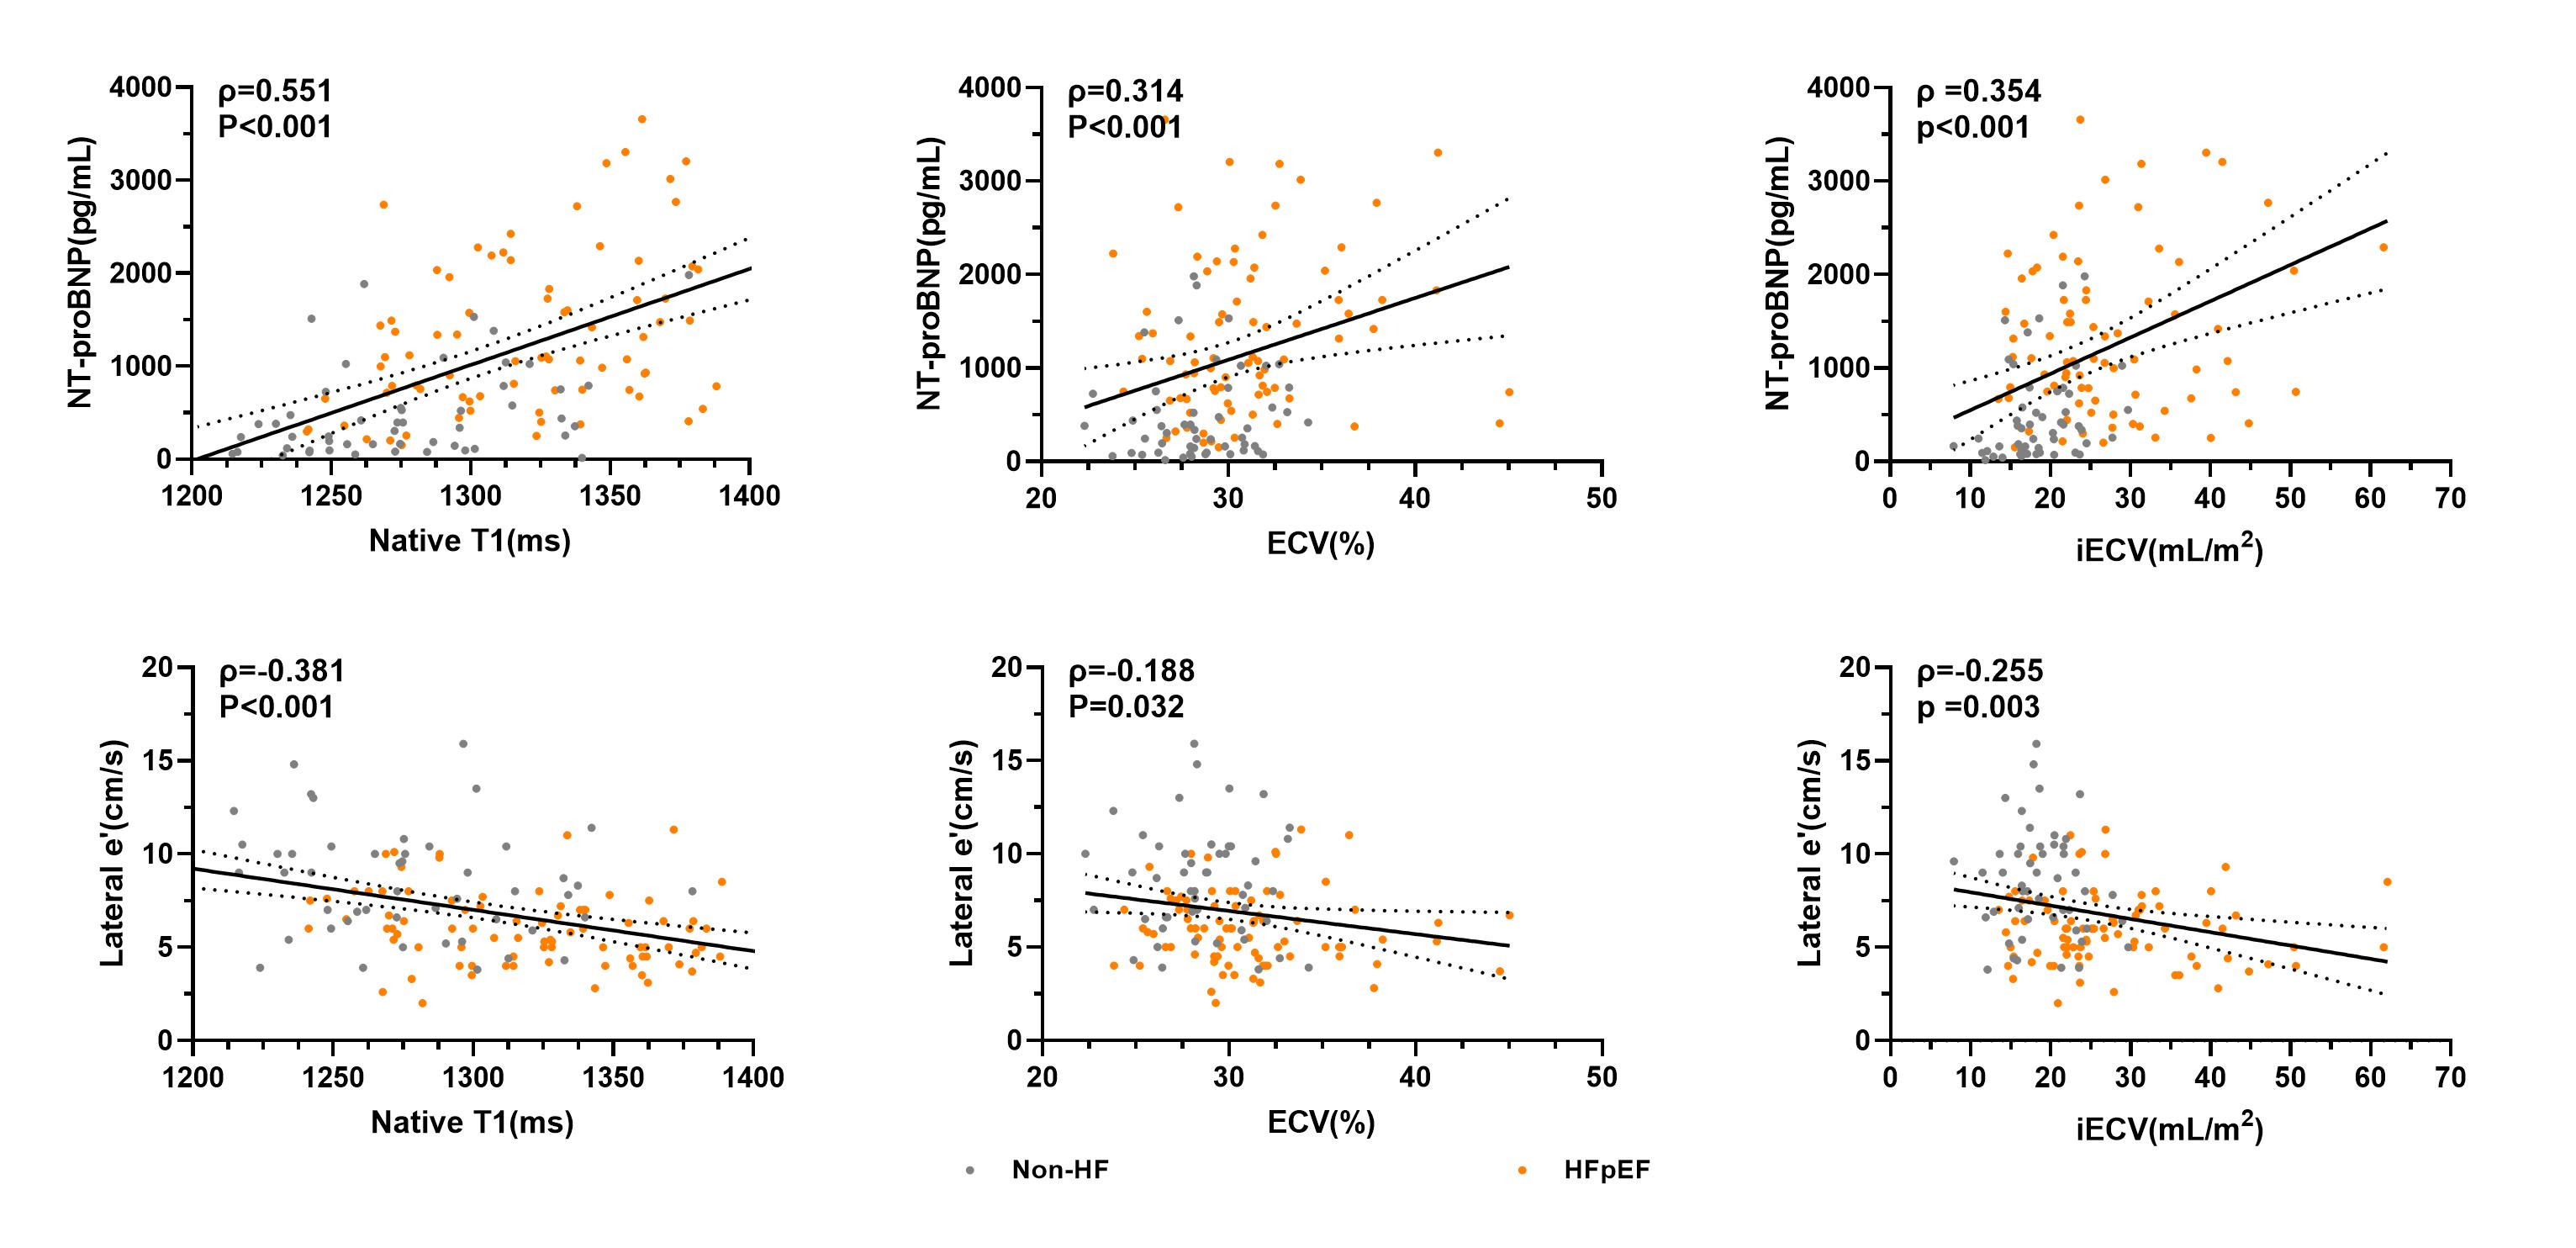
Finally, 75 (56.4%) HCM patients were diagnosed with HFpEF based on the 2019 ESC HFA-PEFF diagnostic algorithm. LGE%, native T1, ECV, and iECV were all significantly greater in HFpEF subjects than in non-HF subjects (all p<0.05). Native T1 value (AUC: 0.723; p<0.001) was a stronger discriminator with the highest sensitivity (80%) than ECV (AUC: 0.622, p = 0.016) and iECV (AUC: 0.695; p<0.001). In multivariable regression analysis, native T1 (odd ratio [95%confidence interval]: 1.223[1.078-1.388] per 10 ms increase, p=0.002) remained significantly related to the diagnosis of HFpEF-HCM while LGE%, ECV, and iECV were not. Native T1, ECV, and iECV weakly/moderately correlated with elevated NT-proBNP (ρ: 0.551, 0.314, and 0.352 respectively; all p<0.05) and lower early diastolic mitral annular velocity (e’) (ρ: -0.381, -0.188 and -0.255 respectively; all p<0.05).Conclusions
Native T1 was a sensitive biomarker independently associated with the diagnosis of HFpEF-HCM. Prolonged native T1 and elevated extracellular volume correlated with increased NT-proBNP and impaired diastolic function in HCM patients.Acknowledgements
The authors declare no competing interests.References
1. Liu J, Wang D, Ruan J et al. Identification of heart failure with preserved ejection fraction helps risk stratification for hypertrophic cardiomyopathy. BMC Med 2022;20:21.
2. Pieske B, Tschope C, de Boer RA et al. How to diagnose heart failure with preserved ejection fraction: the HFA-PEFF diagnostic algorithm: a consensus recommendation from the Heart Failure Association (HFA) of the European Society of Cardiology (ESC). Eur Heart J 2019;40:3297-3317.
3. Kanagala P, Cheng ASH, Singh A et al. Relationship Between Focal and Diffuse Fibrosis Assessed by CMR and Clinical Outcomes in Heart Failure With Preserved Ejection Fraction. JACC Cardiovasc Imaging 2019;12:2291-2301.
Figures