1793
Association of reduced cortical thickness with myocardial strain in patients with heart failure1Xuanwu Hospital, Capital Medical University, Beijing, China, 2Shanghai United Imaging Healthcare, Shanghai, China, 3Beijing United Imaging Research Institute of Intelligent Imaging, Beijing, China
Synopsis
Keywords: Heart Failure, Dementia, Myocardial strains
Motivation: The mechanism of heart failure()-induced brain alterations is unclear
Goal(s): To investigate the alterations in brain structure in patients with HF and their relationship with cardiac dysfunction and cognitive impairment.
Approach: Using CAT12 to analyze intergroup differences in cortical thickness between HF patients and healthy controls, correlation analyses were performed to assess cortical thickness and cognitive impairment, cardiac dysfunction
Results: Reduced cortical thickness in patients with HF and correlation of reduced cortical thickness with cognitive impairment and cardiac dysfunction
Impact: Decreased cortical thickness in HF patients may play a mediating role between cardiac dysfunction and cogntive impairment.And our findings provide imaging evidence of brain alterations in HF patients.
Introduction
Heart failure (HF) is associated with an increased risk of cognitive impairment (CI), leading to a poor prognosis for patients, but the mechanisms underlying these alterations are unclear. The aim of this study was to investigate the alterations in brain structure in patients with HF and their relationship with cardiac dysfunction and cognitive impairment.Methods
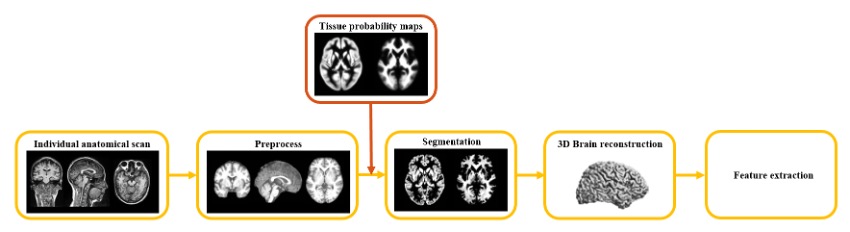
56 patients and 37 healthy volunteers underwent brain PET/MR scans (uPMR790, United Imaging, Shanghai). A sagittal T1 weighted fast-spoiled gradient echo sequence was acquired for following research (TE = 3.0 ms, TR = 7.2 ms, filp angle = 10°, FOV = 230 × 256 mm2 , matrix = 460 × 512, voxel size = 0.5 × 0.5 × 0.7 mm3) . All recruited patients underwent CMR and cerebral PET/MR examinations within one day by using same PET/MR system and were also screened for cognition deficit through Mini-Mental State Examination (MMSE) and Montreal Cognitive Assessment (MoCA). 10 patients were excluded because of incomplete cognition measurement and CMR parameters. The patient group was further split into Cognition+ (without cognition deficit) and Cogniton- (with cognition deficit) groups based on cognition measurement.We used the CAT12 and SPM12 toolkits for structural brain imaging. Preprocessing and segmentation steps were performed with appropriate default settings. Correction of nonlinear record was performed for displacement field uniformity. Reconstructions of the cortical surface was followed by measurement of cortical thickness at vertex level. Whole processing workflow was illustrated in Fig 1. Analysis of variance and post-hoc tests were performed between the patient and control data at vertex level. Partial correlation was utilized between CMR parameter and cortical thickness. A p-value < 0.05 after FDR multiple test correction was considered statistically significant.Results
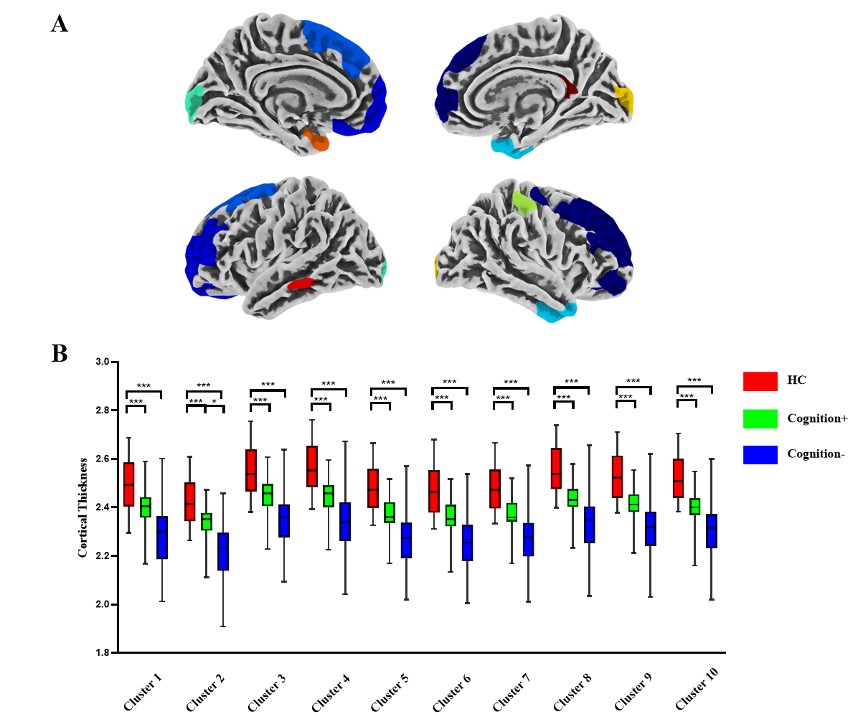
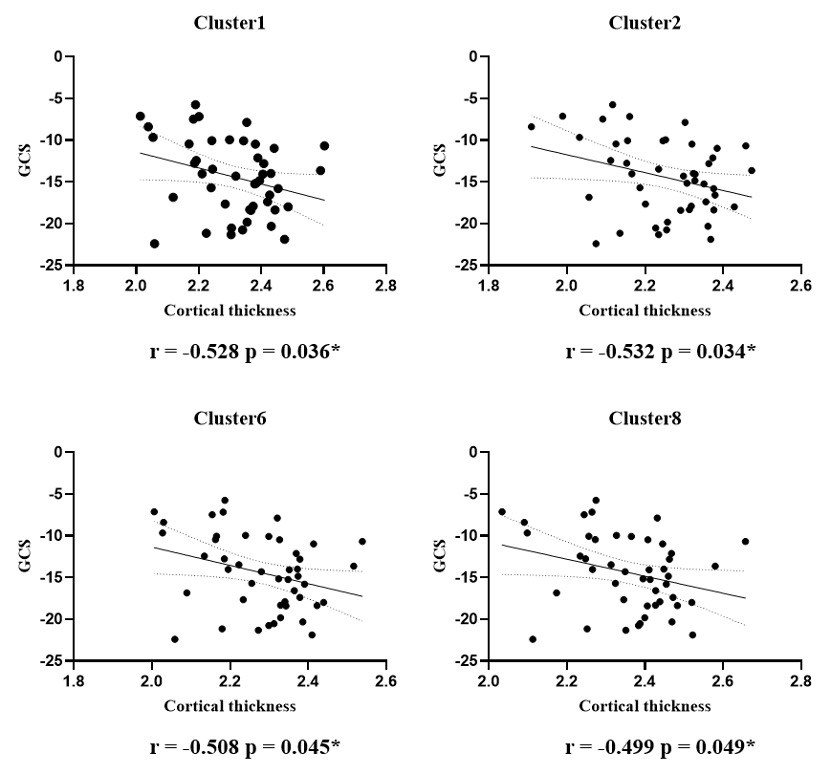
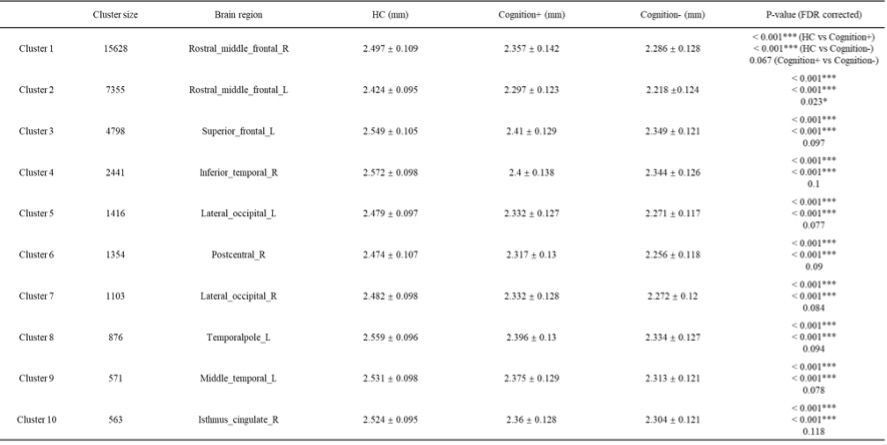
Overall, a decrease of cortical thickness in patient group was observed in various brain regions. Significant difference was found in 10 clusters by vertex-level two sample t-test (Fig 2). Detailed information of every cluster was listed in Table 1. Compared to whole patients group, cortical thickness was much higher in all 10 clusters in healthy control group. Cluster 2 also showed a significant decrease of cortical thickness in Cognition- group compared with Cognition+ group. Significant negative correlation was found between global circumferential strain (GCS) and cortical thickness in cluster 1, 2, 6, 8 in patient group (Fig 3).Conclusion
Patients with HF exhibit widespread cortical thickness reductions primarily focused on cognitively related brain regions. Decreased cortical thickness correlates with CI and reduced left ventricular myocardial strain. And decreased cortical thickness in HF patients may play a mediating role between cardiac dysfunction and CI.Acknowledgements
No acknowledgement found.References
No reference found.Figures