1784
Using sodium (23Na) MRI to measure sodium concentration in the interventricular septum of patients on hemodialysis1Medical Biophysics, Western University, London, ON, Canada, 2Robarts Research Institute, London, ON, Canada, 3Lawson Health Research Institute, London, ON, Canada, 4London Health Sciences Centre, London, ON, Canada, 5Division of Medical Physics in Radiology, German Cancer Research Centre (DKFZ), Heidelberg, Germany, 6Institute of Radiology, University Hospital Erlangen, Friedrich-Alexander-Universität Erlangen-Nürnberg (FAU), Heidelberg, Germany
Synopsis
Keywords: Myocardium, Non-Proton, sodium, X-nuclei, chronic kidney disease, hemodialysis, cardiomyopathy
Motivation: Cardiovascular risk is elevated in chronic kidney disease (CKD) patients on hemodialysis (HD) and may be associated with tissue sodium accumulation in the heart.
Goal(s): To compare tissue sodium concentration (TSC) in the interventricular septum of HD patients and healthy controls using sodium (23Na) MRI.
Approach: 23Na MRI was performed on 3 HD patients and 6 controls to quantify TSC in the interventricular septum.
Results: TSC in the septum was higher in HD patients compared to controls but was not statistically significant. These results may be limited by sample size and age and sex effects, which will be explored in a larger cohort.
Impact: For the first time, 23Na MRI was used to directly measure TSC in the heart of CKD patients on HD. These findings may provide insight on the cardiovascular risk associated with sodium accumulation in this group.
Introduction
There is a well-established but unexplained prevalence of cardiovascular morbidity and mortality in patients with chronic kidney disease (CKD) receiving hemodialysis (HD)1, necessitating the further study of pathophysiological mechanisms driving the cardiomyopathy in this population. One such mechanism may involve the accumulation of sodium in the body, a consequence of impaired kidney function. Preclinical studies have shown that high sodium intake (and inadequate excretion) promotes left ventricular hypotrophy and fibrosis2,3. More recent work has employed sodium (23Na) MRI to non-invasively measure increasing tissue sodium concentration (TSC) in the skin and calf muscle with progressing CKD4,5. However, there have not yet been direct TSC measurements within the heart of HD patients using 23Na MRI. Here, we present technical developments of 23Na MRI to measure TSC in the interventricular septum of patients on HD and healthy controls. This work lays the foundation for future investigations using 23Na MRI to explore the role of sodium accumulation in elevating cardiovascular risk in CKD.Methods
Imaging ExperimentsCardiac imaging of 3 patients on HD (age=42.7±26.5 years, female=2) and 6 healthy controls (age=41.5±9.5 years, female=4) was performed using a 3 Tesla PET/MRI scanner (Siemens Biograph mMR). The radiofrequency system consisted of a rigid transmit/receive anterior surface coil built in-house for 23Na MRI (diameter=18 cm, tuning=32.6 MHz) and a commercial receive anterior body array for 1H MRI.
1H MRI included a cine image acquired in the middle short-axis plane using a conventional steady-state free precession sequence (slice thickness=8mm, gap=0%, 25 frames). For 23Na MRI, three sodium vials (50, 75, 100 mM) served as external reference standards for quantifying TSC. 23Na images were acquired straight axial to the patient using a 3D density-adapted radial projection sequence6 (TR=50 ms; TE=0.5 ms; nominal isotropic resolution=5 mm; FOV=36×36×10 cm3; number of projections=11310, samples per projection=2500; total scan time=28 min). To assess the effects of B1 inhomogeneity, 23Na MRI was also performed on a 50 mM sodium ‘sensitivity map’ phantom.
Blood biochemistry was acquired in all 3 of the HD patients and 3 of the healthy controls the same day as imaging.
Image Processing and Analysis
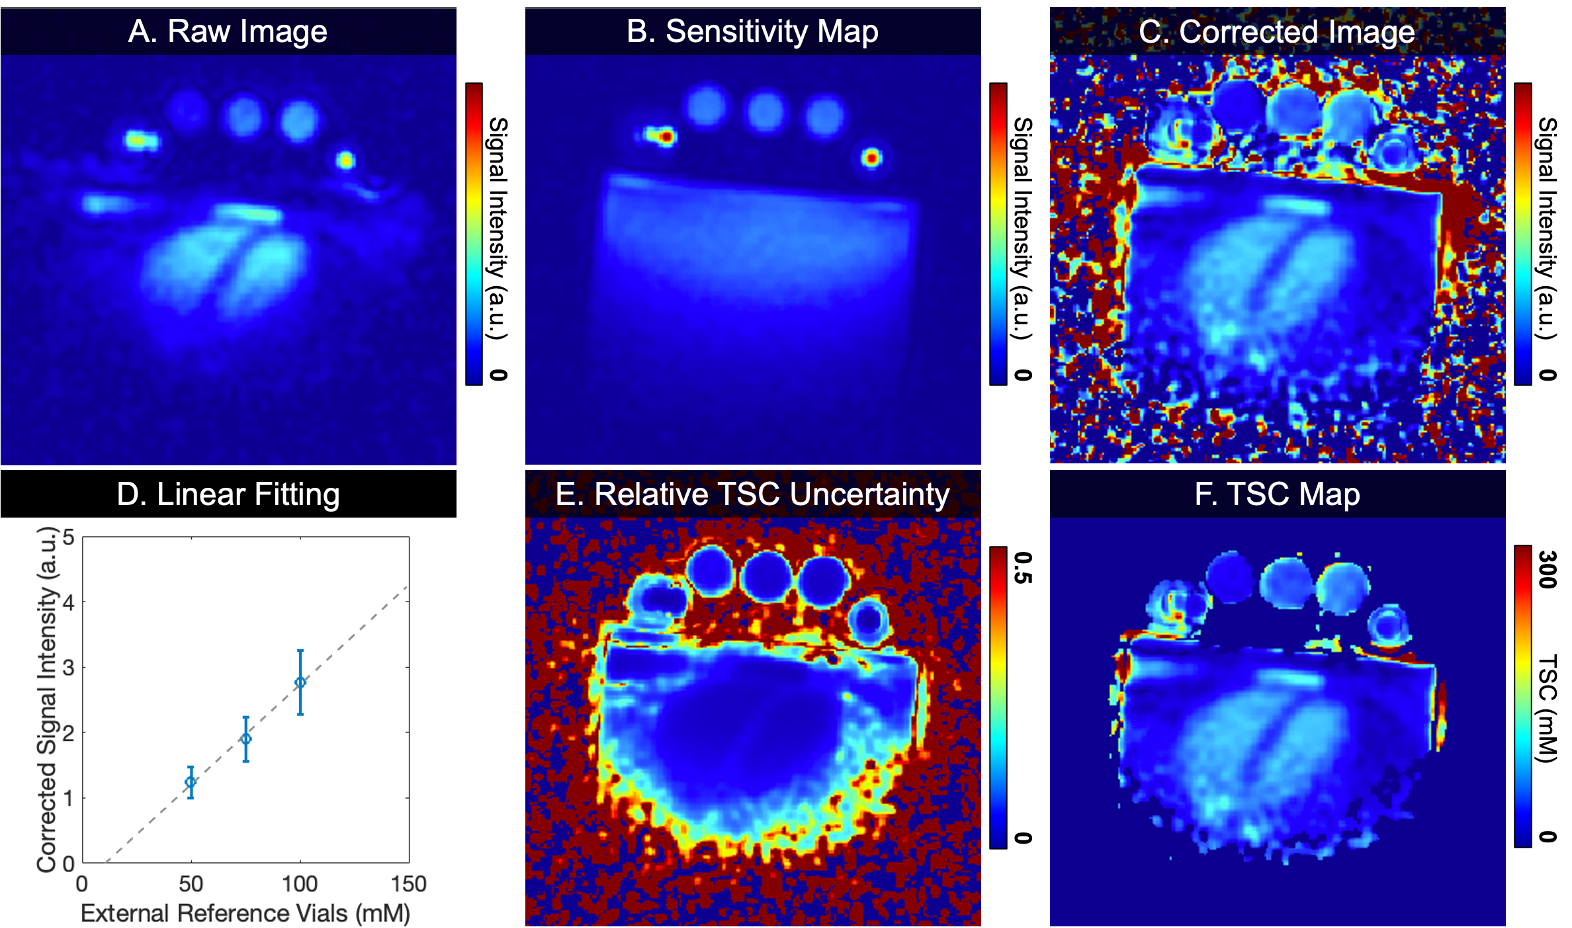
Sodium images were reconstructed offline using the Michigan Image Reconstruction Toolbox (Fessler JA, www.web.eecs.umich.edu/~fessler/code) in MATLAB. B1 inhomogeneities were corrected by dividing the images by the sensitivity phantom7. TSC maps were calculated based on the three external reference vials and masked where their relative uncertainty (ETSC/TSC) was less than 0.308. The mean TSC was then quantified in the left ventricle (LV), right ventricle (RV), and the interventricular septum. The mean TSC in the LV and RV was compared to whole blood TSC, which was estimated from the hematocrit and sodium concentration in blood serum samples9. An unpaired two-tailed t-test was performed to evaluate septum TSC differences between healthy controls and HD patients. All statistical tests were completed using GraphPad Prism 10 for macOS (www.graphpad.com).
Results and Discussion
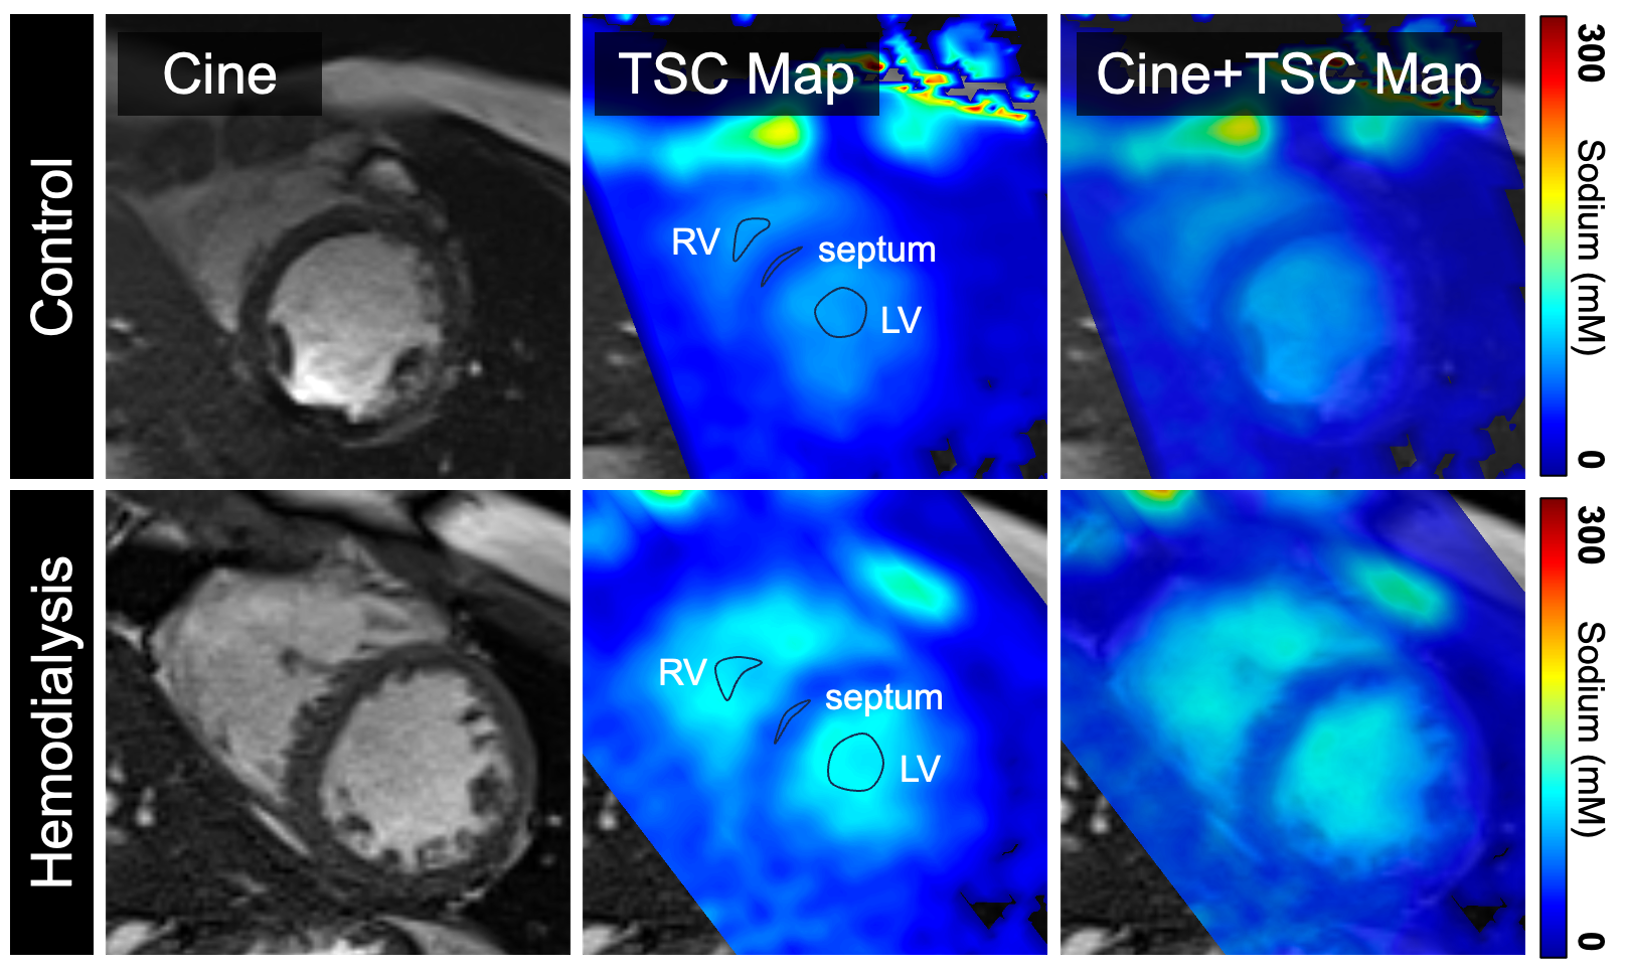
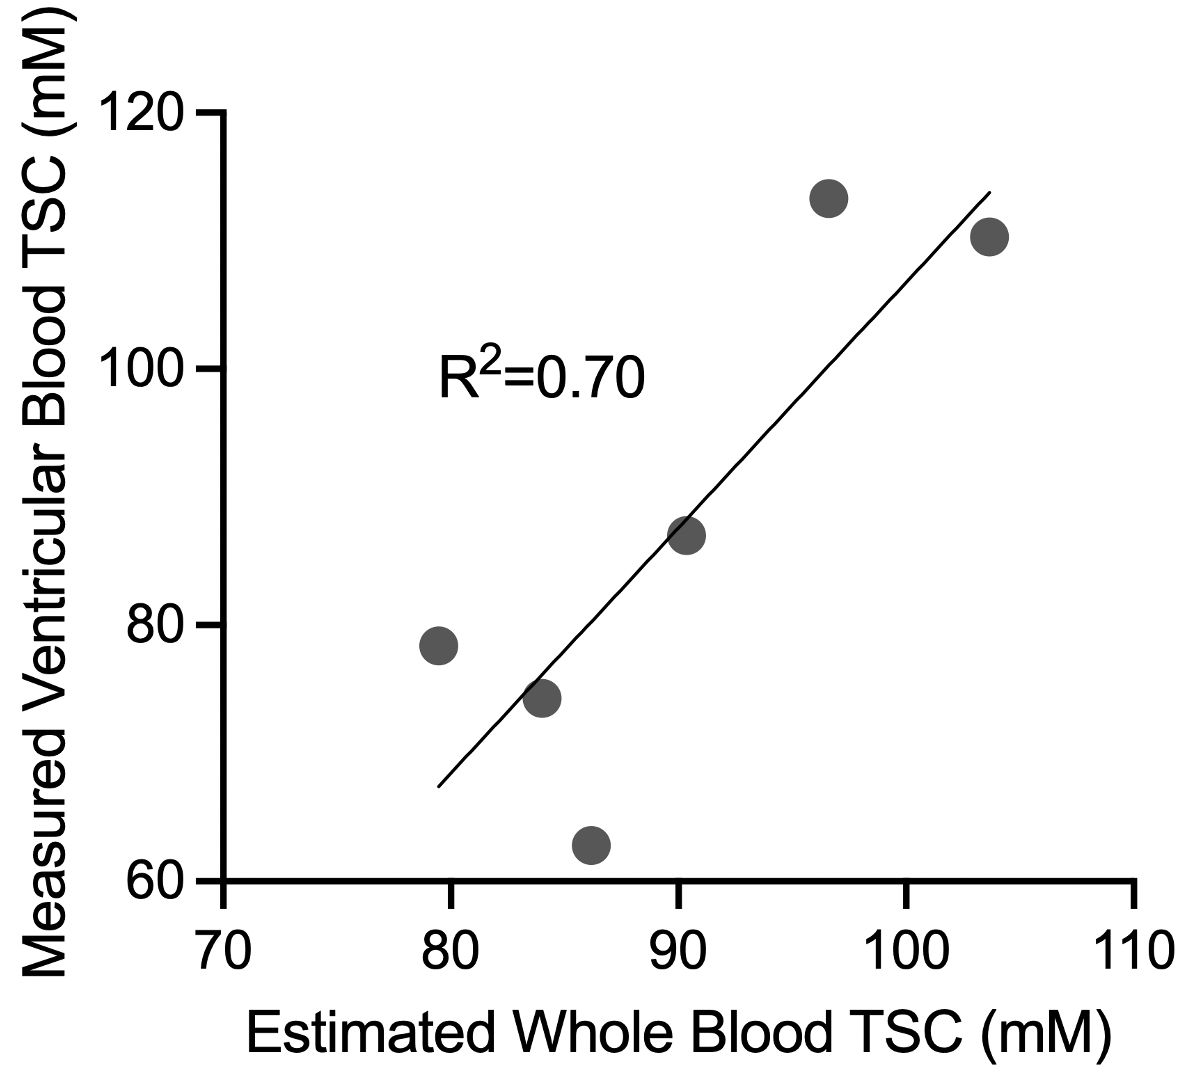
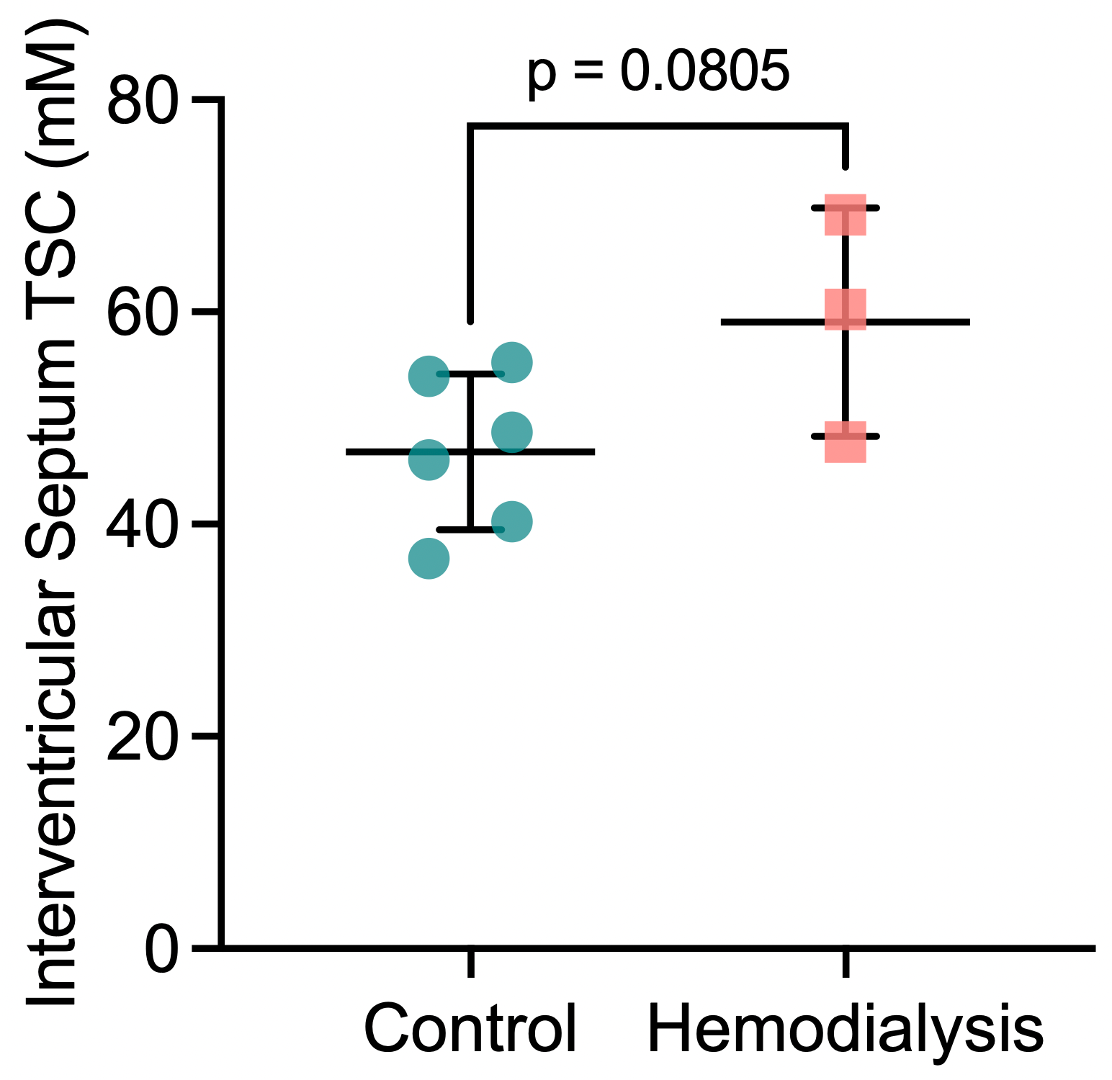
The image processing pipeline is outlined in Figure 1. B1 inhomogeneities were corrected by the sensitivity map, resulting in a more uniform signal throughout the heart and signal linearity across the external reference vials. Figure 2 shows the TSC maps in the short-axis plane for a representative healthy control and HD patient, where TSC in the two ventricular blood pools were distinct from that in the septum. The mean LV and RV TSC was positively correlated to the estimated whole blood TSC (R2=0.70; Figure 3), which validates the quantification of TSC in ventricular blood pools using our image processing pipeline. In the septum, TSC was higher in HD patients than in controls, although this difference was not statistically significant (59.05±10.80 vs. 46.82±7.40; p=0.08; Figure 4). However, it is important to note that TSC is correlated with increasing age and male sex10. Our current sample size does not account for these factors which may influence the statistically non-significant findings in septum TSC between the two groups. Future work will explore these age and sex effects in a larger cohort.Conclusion
In this abstract, we used 23Na MRI to measure TSC in the interventricular septum of patients on HD and healthy controls. While septum TSC was higher in HD patients than in controls, there was no statistically significant difference between the two groups. Future work will explore the age and sex effects in a larger sample size to establish whether sodium accumulates in the heart tissue of patients on HD.Acknowledgements
The authors would like to thank MR technologists Heather Biernaski and Yvonne Huston, and research coordinators Justin Dorie and Tanya Tamasi.References
1. Garikapati K, Goh D, Khanna S, Echampati K. Uraemic Cardiomyopathy: A Review of Current Literature. Clin Med Insights Cardiol. 2021;15. doi:10.1177/11795468219983472. Yu HCM, Burrell LM, Black MJ, et al. Salt induces myocardial and renal fibrosis in normotensive and hypertensive rats. Circulation. 1998;98(23):2621-2628. doi:10.1161/01.CIR.98.23.2621
3. Frohlich ED, Chien Y, Sesoko S, Pegram BL. Relationship between Dietary Sodium Intake, Hemodynamics, and Cardiac Mass in SHR and WKY Rats.
4. Dahlmann A, Dörfelt K, Eicher F, et al. Magnetic resonance-determined sodium removal from tissue stores in hemodialysis patients. Kidney Int. 2015;87(2):434-441. doi:10.1038/ki.2014.269
5. Qirjazi E, Salerno FR, Akbari A, et al. Tissue sodium concentrations in chronic kidney disease and dialysis patients by lower leg sodium-23 magnetic resonance imaging. Nephrology Dialysis Transplantation. 2021;36(7):1234-1243. doi:10.1093/ndt/gfaa036
6. Nagel AM, Laun FB, Weber MA, Matthies C, Semmler W, Schad LR. Sodium MRI using a density-adapted 3D radial acquisition technique. Magn Reson Med. 2009;62(6):1565-1573. doi:10.1002/mrm.22157
7. Axel L, Costantini J, Listerud J. Intensity correction in surface-coil MR imaging. American Journal of Roentgenology. 1987;148(2):418-420. doi:10.2214/ajr.148.2.418
8. Farag A, Peterson JC, Szekeres T, et al. Unshielded asymmetric transmit-only and endorectal receive-only radiofrequency coil for 23Na MRI of the prostate at 3 tesla. Journal of Magnetic Resonance Imaging. 2015;42(2):436-445. doi:10.1002/jmri.24798
9. Lott J, Platt T, Niesporek SC, et al. Corrections of myocardial tissue sodium concentration measurements in human cardiac 23Na MRI at 7 Tesla. Magn Reson Med. 2019;82(1):159-173. doi:10.1002/mrm.27703
10. Martin K, Tan SJ, Toussaint ND. Magnetic resonance imaging determination of tissue sodium in patients with chronic kidney disease. Nephrology. 2022;27(2):117-125. doi:10.1111/nep.13975
Figures