1779
Free-running, Ferumoxytol-Enhanced Cardiac High-Dynamic-Range QSM (HDR-QSM) for Motion-resolved Myocardial Blood Volume Quantification1krannert cardiovascular research center, Indiana University School of Medicine, Indianapolis, IN, United States, 2Bioengineering, UCLA, LA, CA, United States, 3Biomedical Imaging Research Institute, Cedars-Sinai Medical Center, LA, CA, United States, 4Department of Radiological Sciences, David Geffen School of Medicine at UCLA, LA, CA, United States, 5Radiology, Weill Cornell Medicine, New York, NY, United States
Synopsis
Keywords: Myocardium, Cardiovascular, Quantitative Susceptibility Mapping (QSM); Myocardial Blood Volume(MBV)
Motivation: Myocardial Blood Volume (MBV) is an important factor in the progression of cardiac pathologies.
Goal(s): We proposed to combine a motion-resolved cardiac high-dynamic-range quantitative susceptibility mapping (HDR-QSM) approach with ferumoxytol (an iron-based intravascular contrast agent) to accurately measure myocardial blood volume (MBV).
Approach: HDR-QSM was prescribed in pigs with and without AMI after ferumoxytol administration to investigate the cyclic MBV changes and infarct-induced MBV redistribution in AMI.
Results: Significant MBV difference was observed between systolic and diastolic phases between healthy and infarcted hearts.
Impact: Ferumoxytol-enhanced cardiac QSM has the potential to accurately quantify motion resolved MBV in healthy and diseased hearts.
Introduction
Ferumoxytol, an FDA-approved iron-oxide treatment for iron deficiency in CKD patients1,2, has recently gained significant attention as an MRI contrast agent. Its T1 shortening effect and long intravascular half-life make it effective for imaging large and small vessels throughout the body3. Additionally, due to its high iron content, ferumoxytol can be used as a contrast agent for susceptibility-sensitive imaging such as T2* and QSM4,5. Previous literature5 has demonstrated Ferumoxytol-enhanced QSM’s capability in quantifying cerebral blood volume (CBV). However, ferumoxytol-enhanced QSM in the heart has been limited by cardiac and respiratory motion artifacts, off-resonance near the heart-lung interface, and susceptibility-related streaking. Our recently developed High-dynamic Range QSM (HDR-QSM) can depict changes in the local tissue’s magnetic susceptibility without the aforementioned imaging artifacts. Here, we explore whether HDR-QSM6 enables the inference of variations in myocardial susceptibility before and after ferumoxytol administration and whether it can be used to quantify myocardial blood volume (MBV).Methods
Under institutional approval, pig models with (n = 2) and without (n = 2) acute myocardial infarction were studied. Animals were scanned in a 3T system (Biograph mMR, Siemens, Germany). Pigs were imaged following ferumoxytol administration (Ferehem, 1.5 – 5 mg Fe/kg, AMAG Pharmaceuticals, USA). Before and right after the injection, a 3D, non-ECG gated, free-breathing 8-echo GRE (mGRE, TE1/ΔTE = 1.42/ 1.22ms, number of partitions = 12, voxel size 1.6×1.6×6mm3) sequence was prescribed to cover the whole LV. Cardiac motion-resolved mGRE data was reconstructed using the CMR multitasking framework6. Pre/post-QSM images were reconstructed using previously developed HDR-QSM pipeline7. MBV was calculated from the ratio of the change in the myocardium and LV blood pool susceptibility: $$$MBV= (\chi _{post} – \chi _{pre}) _{Myocardium}/(\chi_{post} – \chi_{pre})_{BloodPool}$$$5. Gd-based imaging was performed two days before the ferumoxytol scans for validation purposes and to avoid contrast crosstalk. 2D T1 MOLLI (TR = 483.48ms, TE = 1.22ms, TI = 187-347.5ms, voxel size = 1.2×1.2×6mm3) was prescribed after gadolinium (Magnevist, Bayer Healthcare, Germany ) administration to obtain EGE (Early Gadolinium Enhancement) images (5 minutes) and post-contrast T1 maps (2 minutes) to investigate the hypoperfusion territories in the AMI subject. Comparison between healthy and infarcted MI was compared using an independent t-test, with statistical significance set at p < 0.05.Results
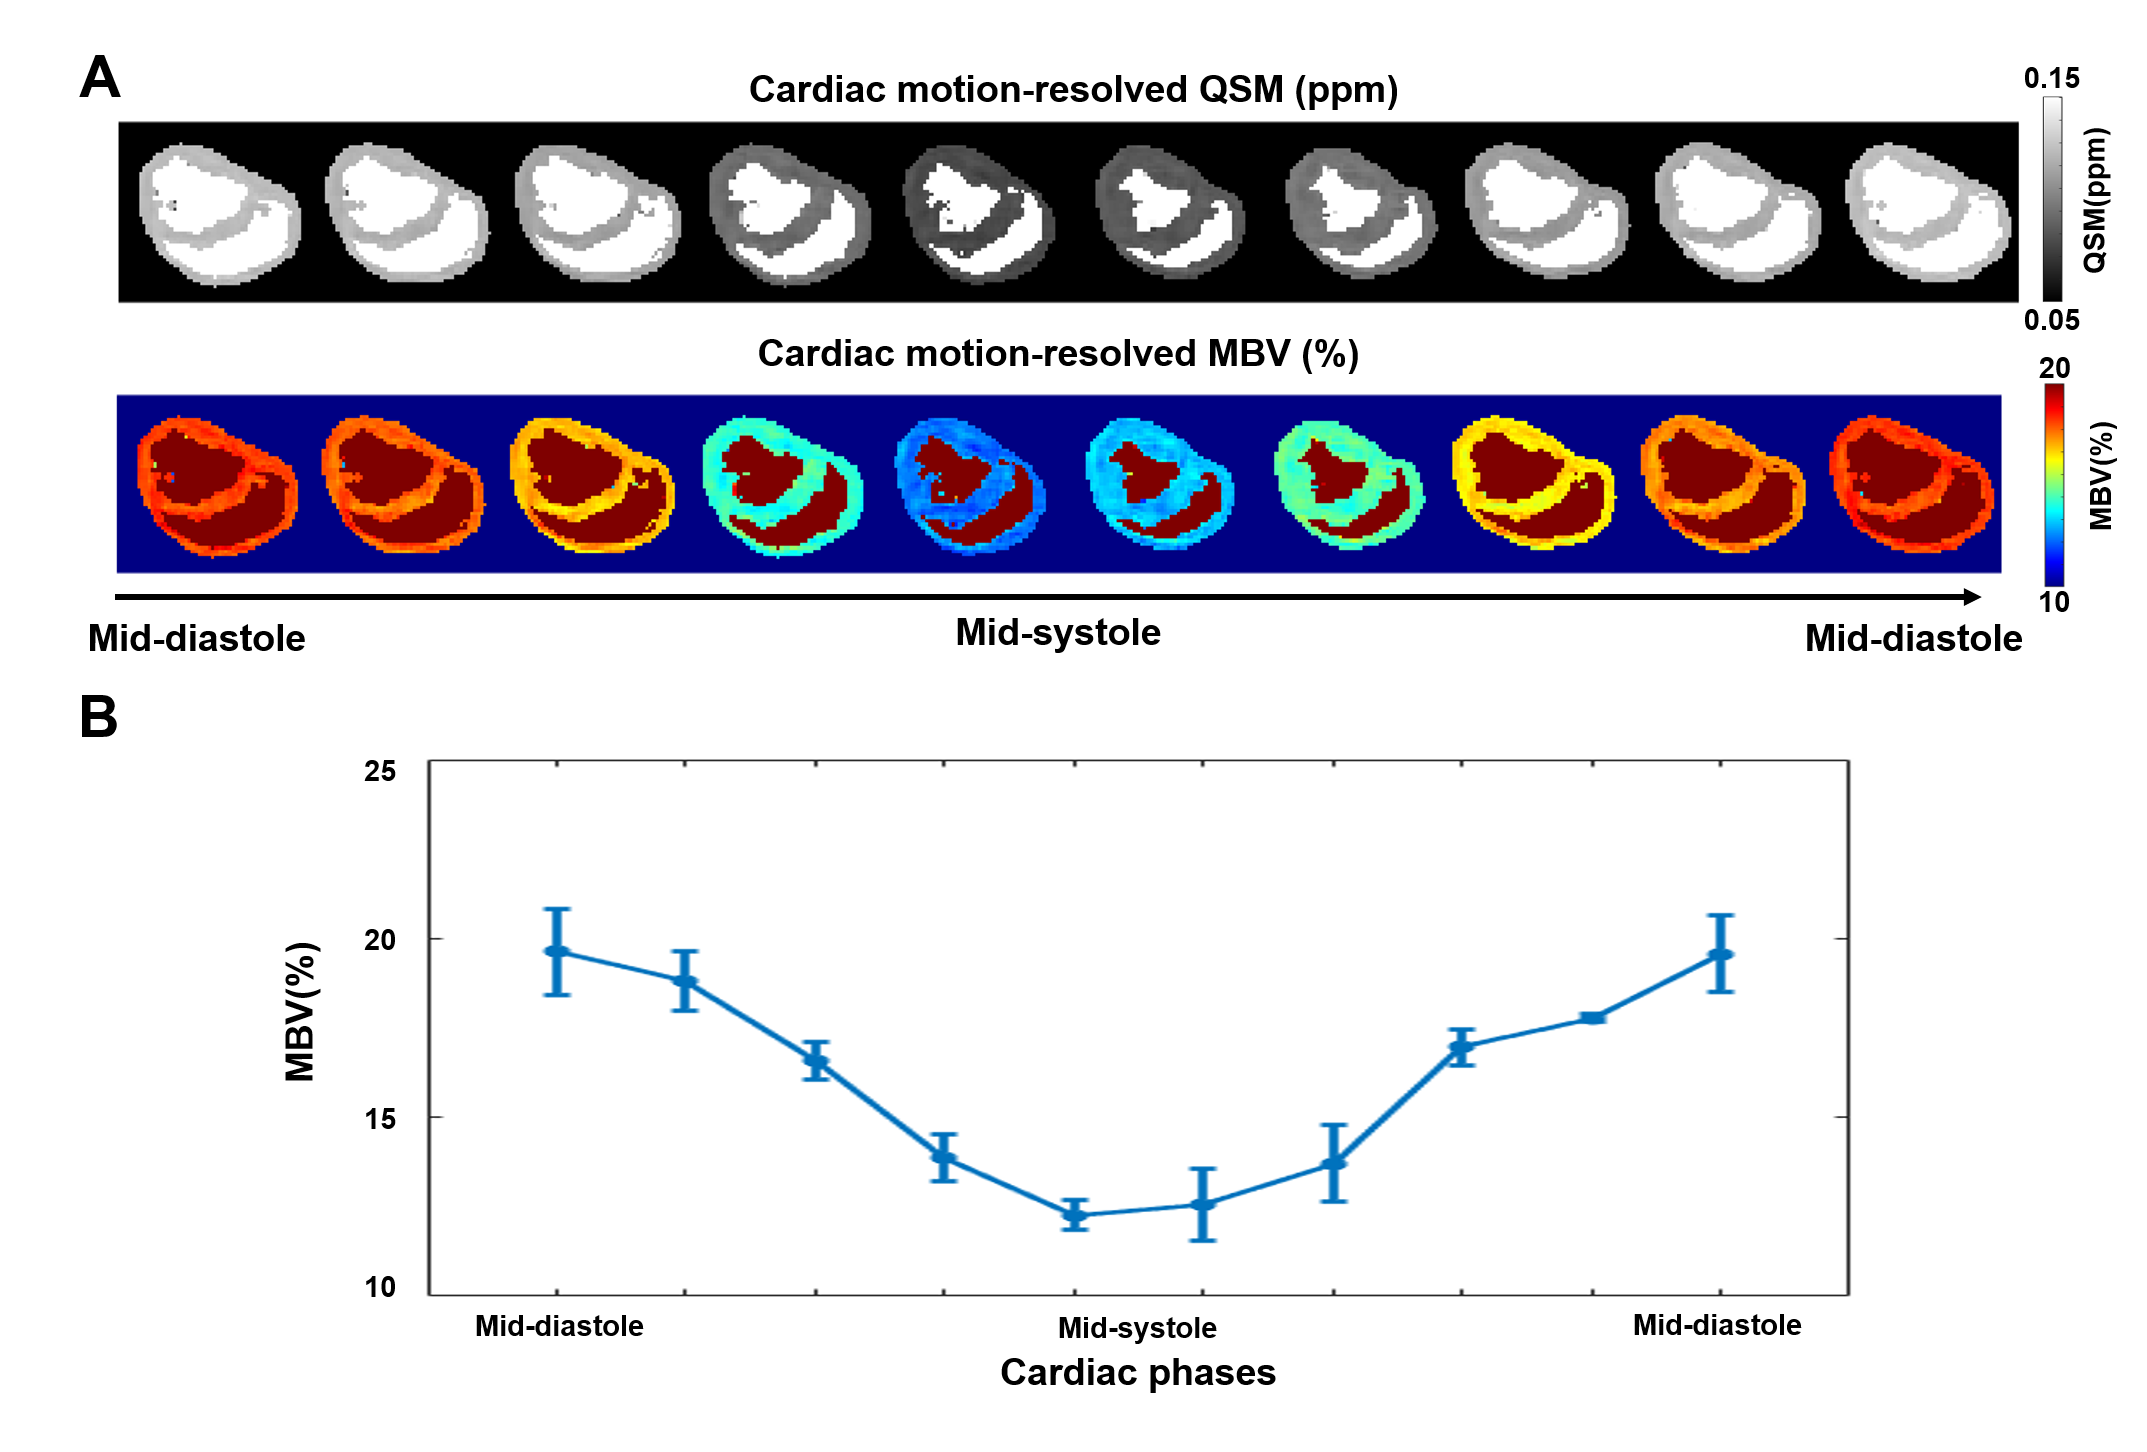
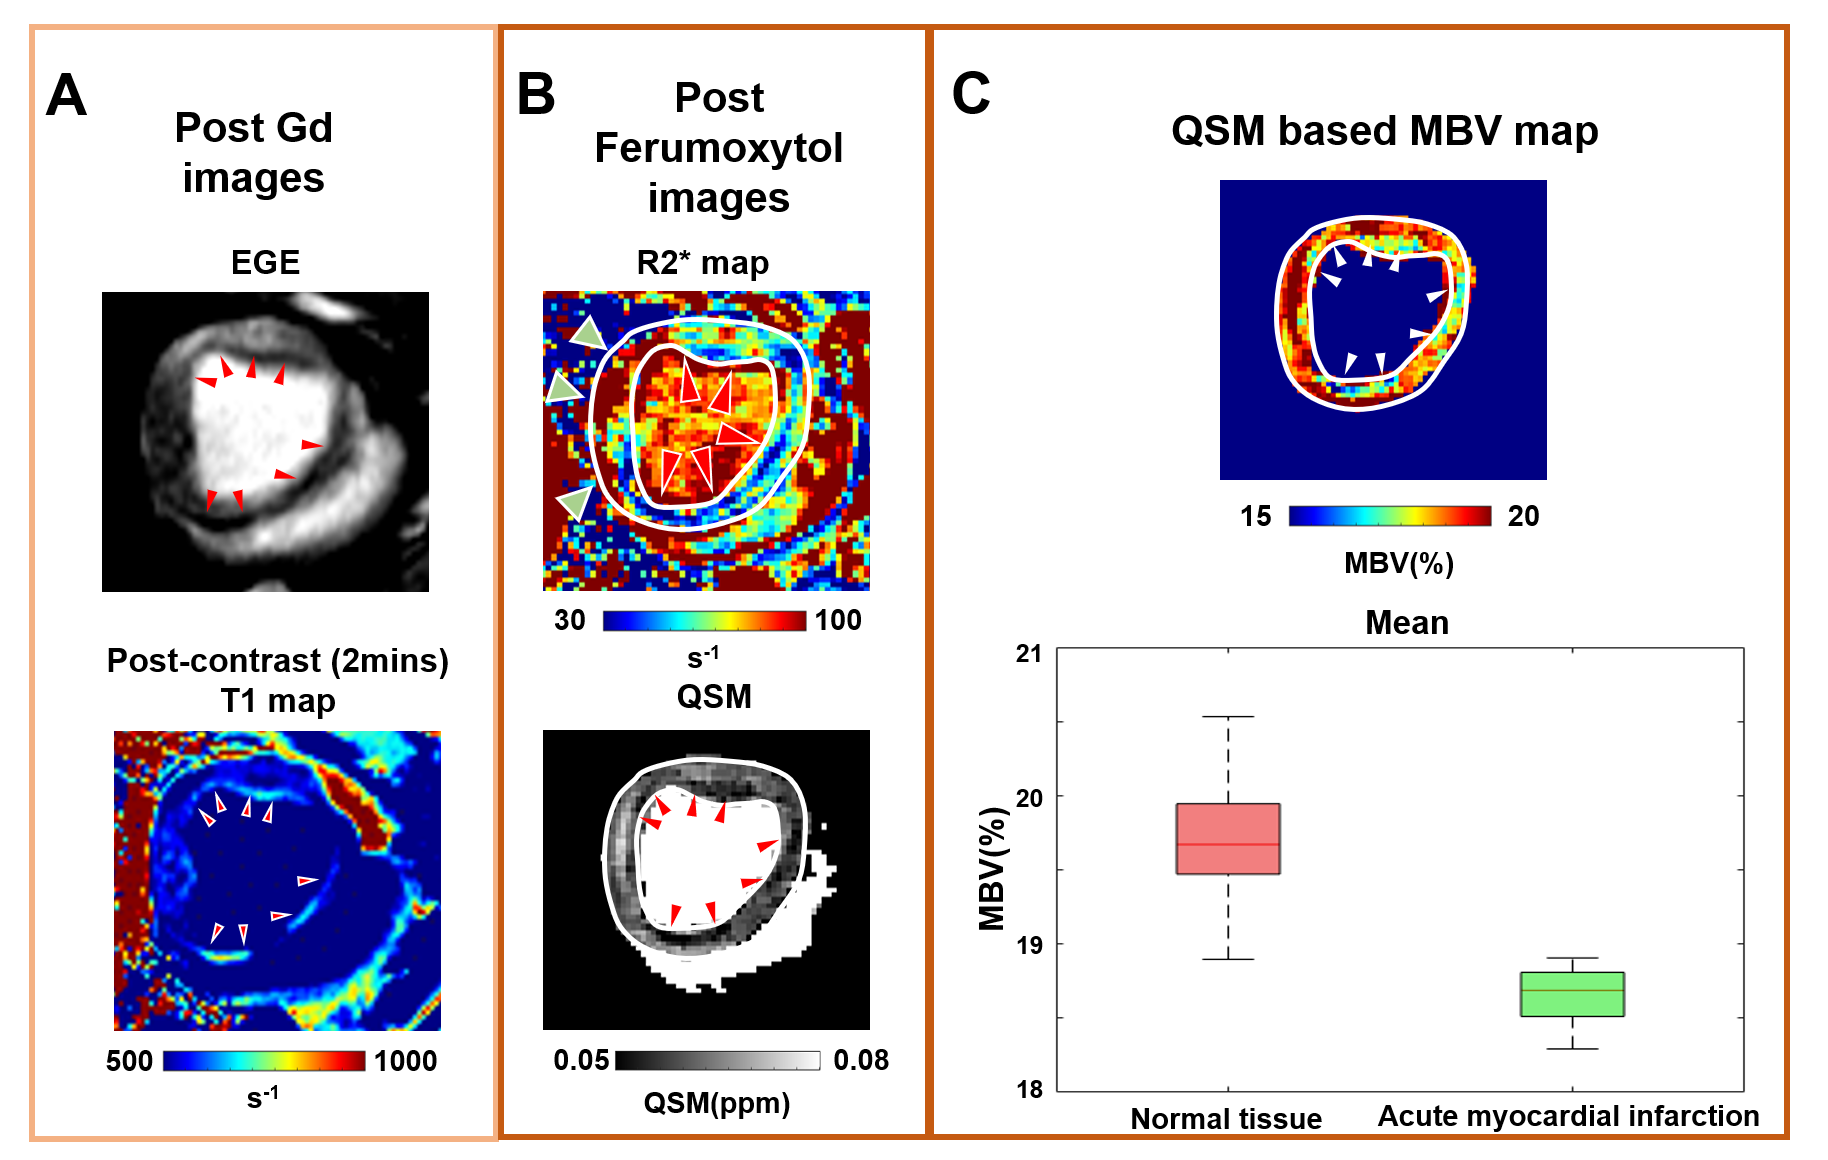
Results from the healthy subjects are shown in Fig.1. Panel A shows representative cardiac-motion resolved QSM-derived MBV images, demonstrating a homogenous MBV distribution without artifacts in the myocardium across all cardiac phases. Panel B presents quantified MBV values within the entire myocardium at each cardiac phase for two healthy subjects. The systolic MBV exceeds diastolic MBV, consistent with previous findings8. Fig. 2 shows representative images from the acute-MI (AMI) case. Panel A shows the reference images (EGE and post-Gd T1 maps). Infarcted (hypo-perfused) areas manifest in the subendocardial region are characterized by hypo-intensity in the EGE images (red arrows) and hyper-intensity in the post-contrast T1 maps (red arrows). Panel B reveals a similar pattern in the post-ferumoxytol R2* and QSM maps. Notably, the R2* maps are confounded by strong off-resonance artifacts at the heart-lung interfaces (green arrows) and additional signal variation in the LV. In contrast, hypo-intensity in the more homogeneous QSM maps indicates the MBV (red) reduction in the AMI zone. Panel C presents a representative MBV map and the corresponding quantitative comparison of segmental mid-diastolic MBV values in healthy and diseased subjects. The analysis reveals a significant reduction (p-value < 0.05) in the mean MBV values in segments affected by infarction (18.655±0.294%) compared to those in healthy segments (Mean: 19.837±0.843%).Discussion
In this study, we investigated an approach capable of providing a motion-resolved assessment of MBV using Ferumoxytol-enhanced HDR-QSM. It can quantify MBV variation throughout the cardiac cycle in AMI. Given the inherent challenges experienced by cardiac patients, such as compromised breath-holding capacity and irregular cardiac motion, implementing a non-ECG gated, free-breathing imaging technique has significantly increased the likelihood of acquiring dependable images suitable for MBV assessment. Further, our approach overcomes the disruptive off-resonance artifacts at 3T and the streaking artifacts from ferumoxytol-induced strong susceptibility change. In doing so, our proposed method has demonstrated its ability to quantify changes in MBV across the cardiac cycle and identify areas of hypo-perfusion within myocardial infarcted territories. The next step is to test the approach in larger cohorts of animal models and patients to establish its efficacy and clinical applicability.Conclusions
We have developed a new approach for assessing MBV using HDR-QSM and ferumoxytol-enhanced MRI. It enables quantification of MBV within the cardiac region and may help further characterization of myocardial tissue in the setting of AMI.Acknowledgements
This work is supported by grants: 1R01HL136578; 1R01HL165211; 1R01HL148788;1R01HL156818;References
1. Finn JP, Nguyen KL, Hu P. Ferumoxytol vs. Gadolinium agents for contrast-enhanced MRI: Thoughts on evolving indications, risks, and benefits. J Magn Reson Imaging. 2017;46:919-923. doi: 10.1002/jmri.25580
2. Bashir MR, Bhatti L, Marin D, Nelson RC. Emerging applications for ferumoxytol as a contrast agent in MRI. J Magn Reson Imaging. 2015;41:884-898. doi: 10.1002/jmri.24691
3. Colbert CM, Le AH, Shao J, Currier JW, Ajijola OA, Hu P, Nguyen KL. Ferumoxytol-enhanced magnetic resonance T1 reactivity for depiction of myocardial hypoperfusion. NMR Biomed. 2021;34:e4518. doi: 10.1002/nbm.4518
4. Rivera-Rivera LA, Johnson KM, Turski PA, Wieben O, Schubert T. Measurement of microvascular cerebral blood volume changes over the cardiac cycle with ferumoxytol-enhanced T(2)(*) MRI. Magn Reson Med. 2019;81:3588-3598. doi: 10.1002/mrm.27670
5. Rivera-Rivera LA, Schubert T, Johnson KM. Measurements of cerebral blood volume using quantitative susceptibility mapping, R(2) * relaxometry, and ferumoxytol-enhanced MRI. NMR Biomed. 2019;32:e4175. doi: 10.1002/nbm.4175
6. Huang Y, Guan X, Zhang X, Tang LR, Bi X, Han F, Lee H, Christodoulou AG, Li D, Dharmakumar R, et al. Free-breathing, Whole-heart, High-dynamic-range Quantitative Susceptibility Mapping (HDR-QSM) for Imaging Hemorrhagic Infarctions. Paper/Poster presented at: ISMRM & ISMRT Annual Meeting & Exhibition; 2023;
7. Guan X, Yang H-J, Hu Z, Zhang X, Wang N, Han H, Tang R, Sharif B, Christodoulou AG, Li D, et al. Non-ECG-Gated, Free-Breathing, Off-Resonance Reduced, High-Resolution, Whole-Heart Myocardial T2* Mapping at 3T within 5 Minutes (in press). Magn Reson Med. 2023.
8. Ashikaga H, Coppola BA, Yamazaki KG, Villarreal FJ, Omens JH, Covell JW. Changes in regional myocardial volume during the cardiac cycle: implications for transmural blood flow and cardiac structure. Am J Physiol Heart Circ Physiol. 2008;295:H610-618. doi: 10.1152/ajpheart.00107.2008
Figures