1772
Quantitative MRI with Automated Histogram Analysis Based on Self-Supervised Learning of Organ Segmentation: Demonstration for Liver T1 Mapping1Bernard and Irene Schwartz Center for Biomedical Imaging, Department of Radiology, New York University Grossman School of Medicine, New York, NY, United States, 2Center for Advanced Imaging Innovation and Research (CAI2R), Department of Radiology, New York University Grossman School of Medicine, New York, NY, United States, 3Department of Electrical and Computer Engineering, NYU Tandon School of Engineering, New York, NY, United States
Synopsis
Keywords: Analysis/Processing, Liver, Machine learning, quantitative imaging
Motivation: Extensive recent work has been devoted to quantitative MRI, but practical implementation of quantitative parameter mapping is hindered by the lack of tools for easy visualization and automated analysis.
Goal(s): We demonstrate the applicability of a self-supervised contrastive pretraining framework for organ segmentation in automated analysis of free-breathing 3D liver T1 mapping.
Approach: A DL model is pretrained to learn T1 contrast information from multi-contrast images acquired for T1 parameter mapping.
Results: With few labeled examples, an organ segmentation framework was developed, and its utility in interpreting parameter maps was demonstrated.
Impact: Multi-contrast information from images typically acquired for parameter estimation in quantitative MRI can be leveraged to pretrain organ segmentation models with self-supervision, enabling automated analysis of quantitative parameter maps.
Introduction
There has been remarkable progress in the development of various quantitative MRI techniques in the past decades. While most research efforts have concentrated on new data acquisition, image reconstruction, and parameter estimation, comparatively less attention has been given to the analysis of quantitative maps. The practical use of these maps in clinical settings, beyond directional visualization as in traditional weighted images, remains a question. In this study, we propose a simple approach that could help interpret quantitative MR maps. The method is built on a novel self-supervised deep learning approach designed to segment the organs of interest, enabling automated analysis of quantitative parameters within the delineated regions. The proposed approach has been demonstrated for analyzing free-breathing 3D liver T1 mapping.Methods
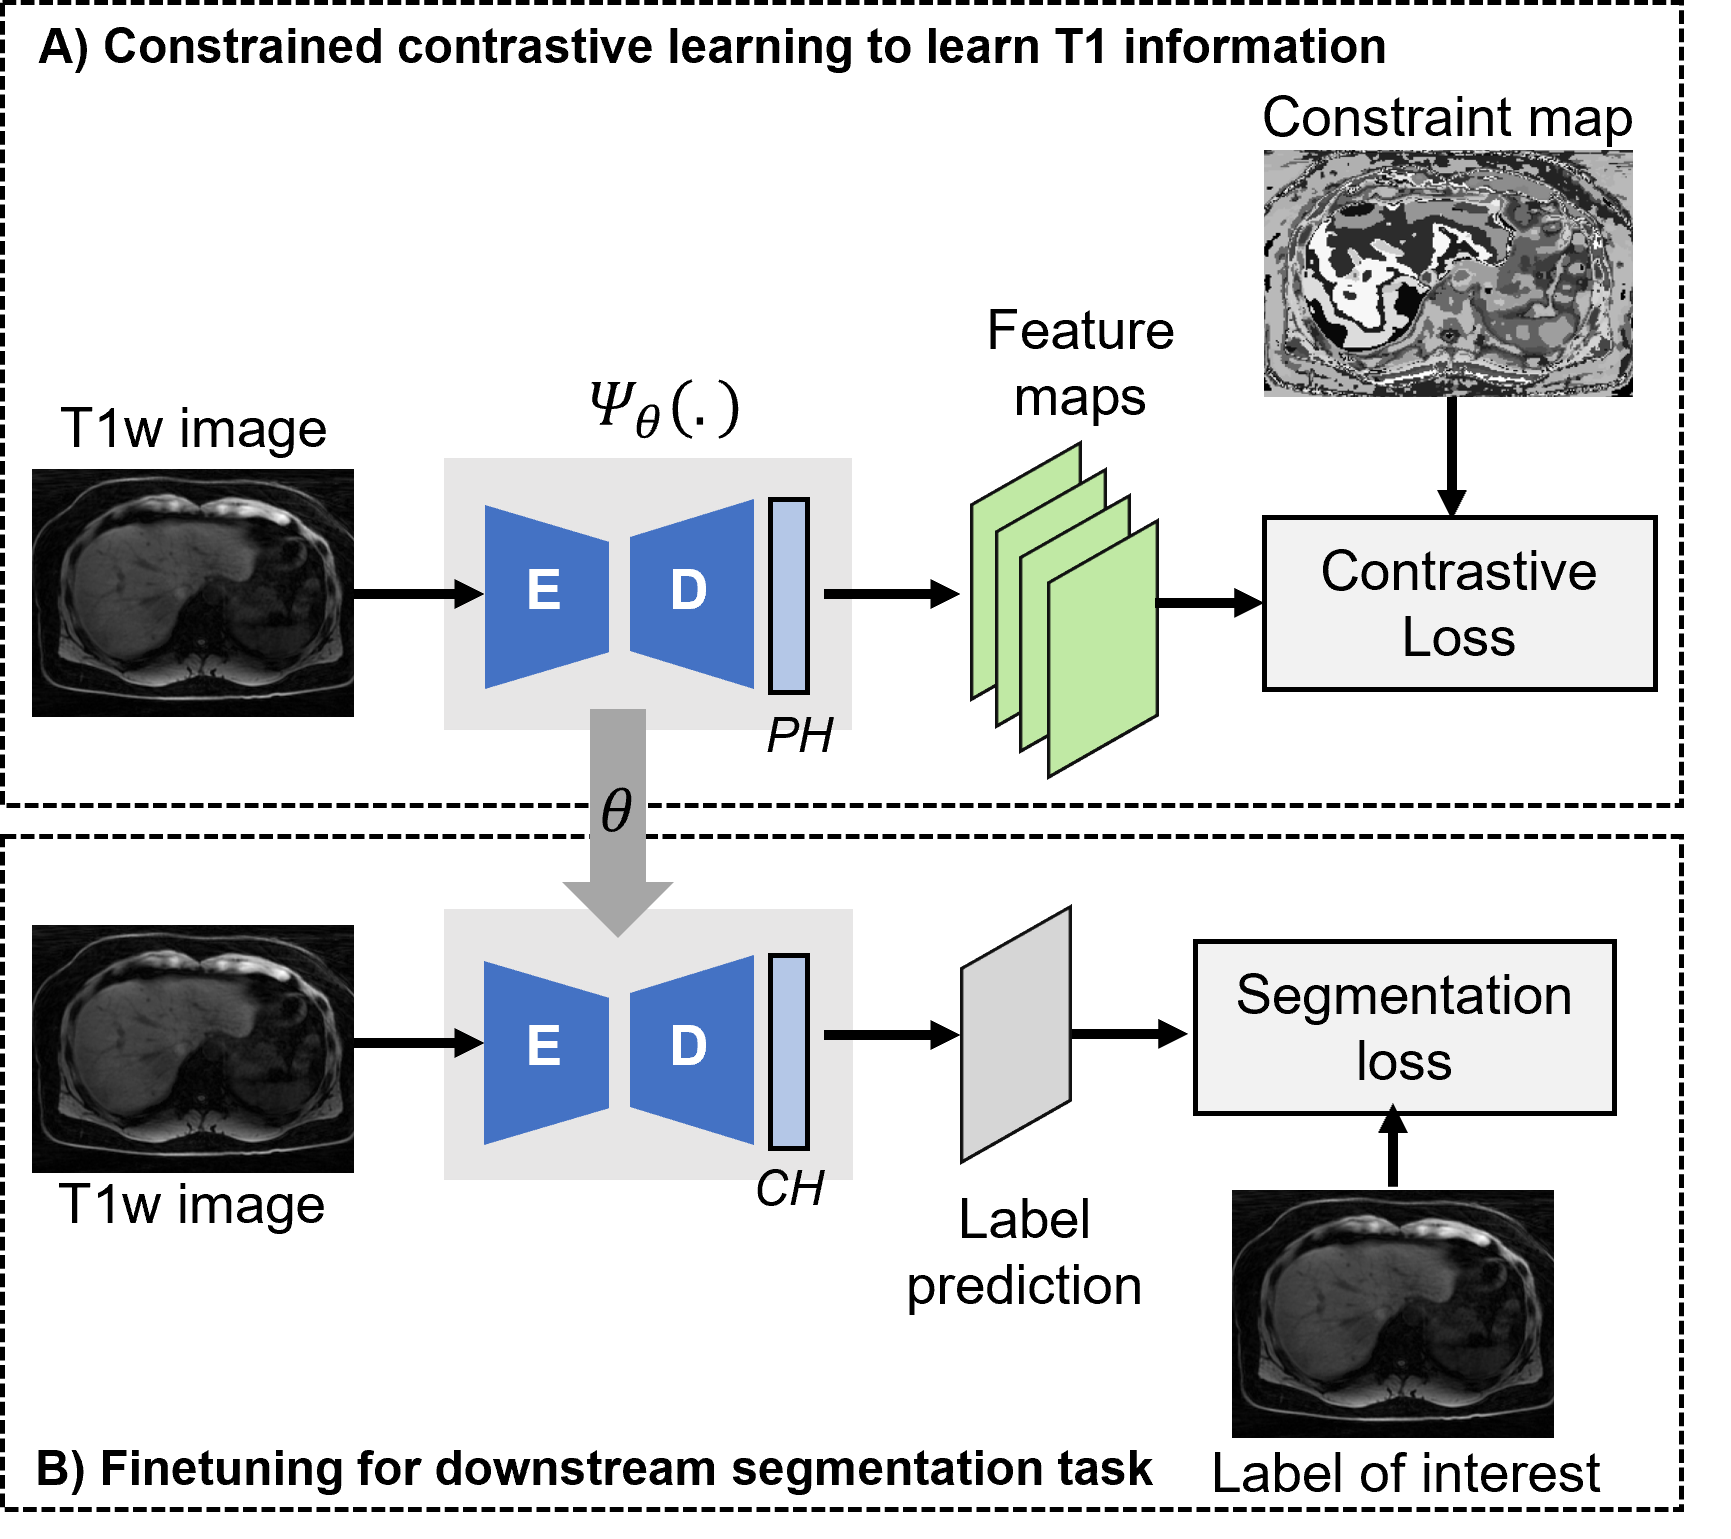
BackgroundRecently, a self-supervised constrained contrastive learning (CCL) based pretraining approach was proposed [1,2] for MR image segmentation tasks that uses MR contrast information, from a set of related multi-contrast data, to guide the contrastive learning algorithm towards embedding tissue-specific information (e.g., T1, T2, Diffusion, etc.). The work is based on the hypothesis that local regions that belong to similar tissue types should generate representations similar to one another. In this work, we utilize this CCL framework to train a DL model to learn tissue T1 information in T1-weighted abdominal images. We then use the DL model embedded with T1 information to learn segmentation on T1-weighted images for organs of interest.
Learning to embed T1 information:
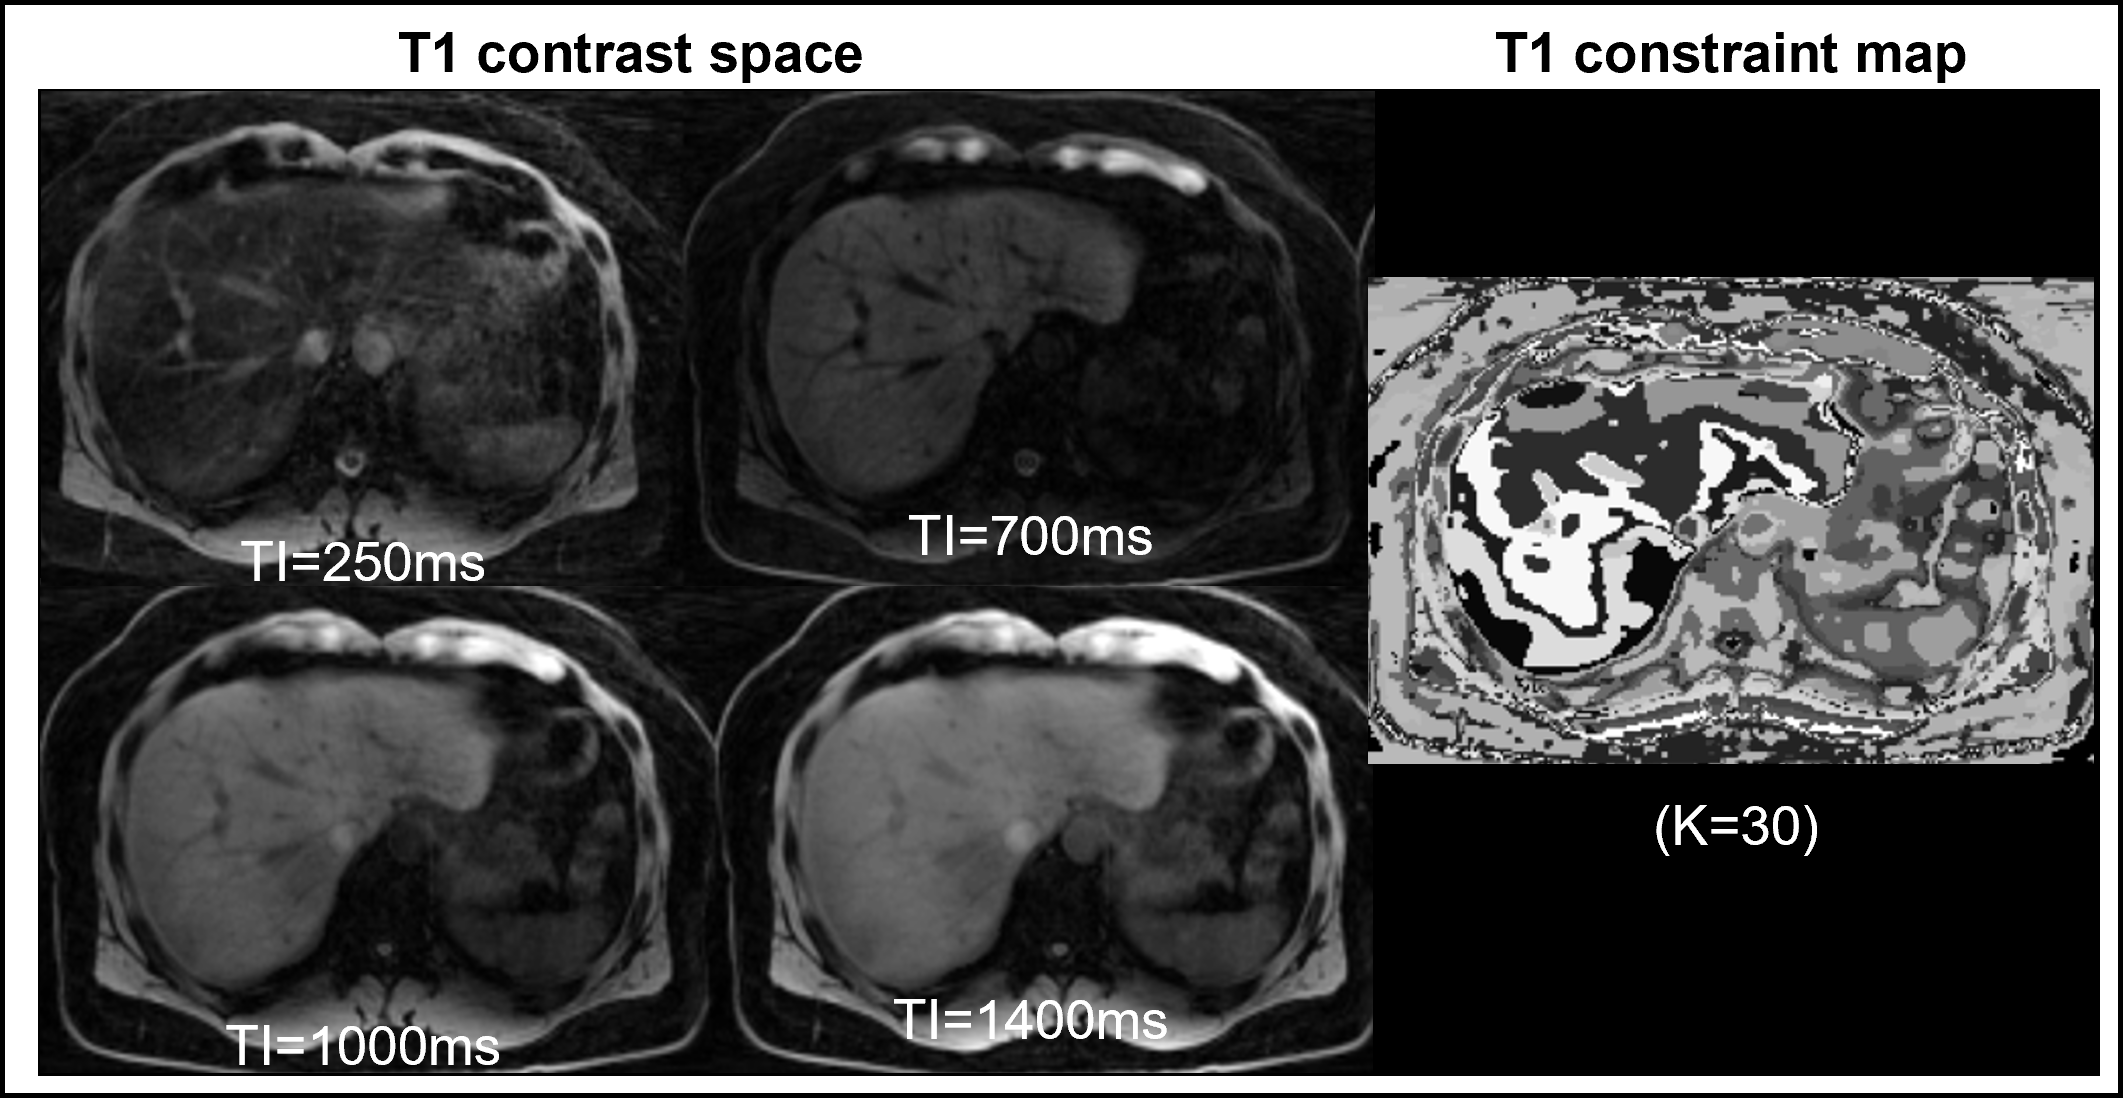
Figure 1 shows a set of T1-weighted images acquired at different inversion times (TI) that form a T1 contrast space for the slice of interest. The tissue T1 information varying across this contrast space is used to characterize the underlying tissues. Following the steps outlined in the CCL approach [3], a T1 constraint map is generated by applying an unsupervised k-means clustering (K=30) along the contrast dimension. This constraint map, a surrogate for tissue information, is used to identify local regions that should produce similar representations based on underlying tissue T1. A 2D encoder-decoder architecture (Figure 2A) is pretrained with pairs of T1-weighted images and their corresponding maps. The pretraining stage is followed by fine-tuning (Figure 2B), where the DL model is fine-tuned to segment labels of interest with a small number of examples.
Data
The DL segmentation model was trained/evaluated in 57 3D T1 mapping datasets acquired with an inversion recovery-prepared golden-angle radial multi-echo sequence. Images were first reconstructed using a previously developed algorithm [3], from which fat/water separation was performed to generate water specific T1 maps. All of the data was used for pretraining after a preprocessing step for signal inhomogeneity correction. Ground truth labels for liver were manually annotated on 23 subjects, and the data was split into training (n=12), validation (n=3), and test (n=8) sets. To demonstrate generalizability on an independent T1-weighted dataset, we used in-phase images from the public CHAOS abdomen segmentation challenge dataset [6]. The training dataset of CHAOS was used for multi-organ segmentation tasks (liver, kidneys, and spleen), with a training/validation/test split of 9/1/10 subjects, respectively.
Results
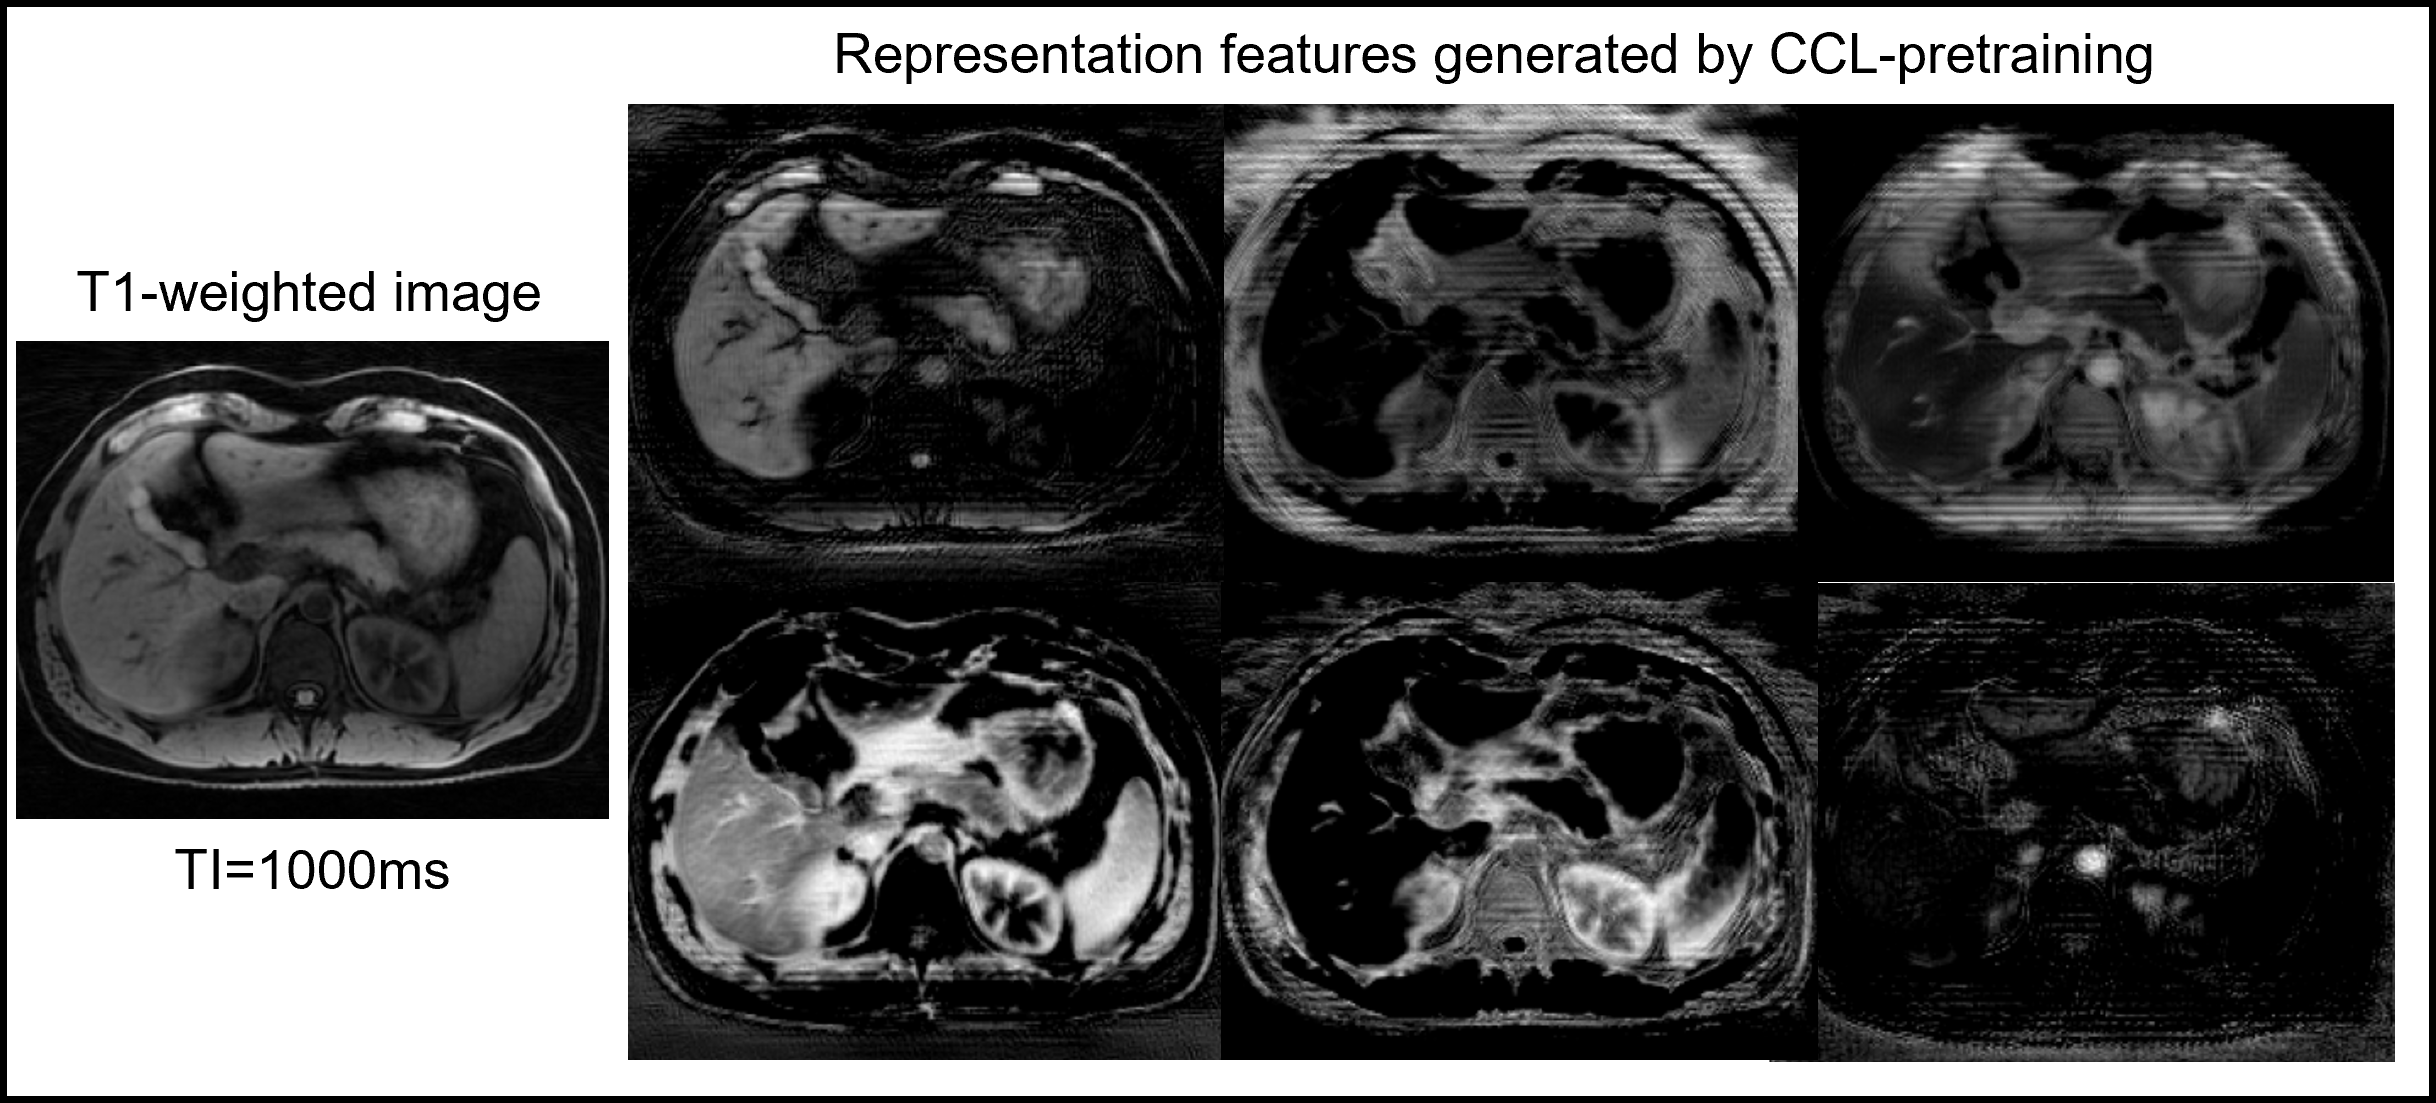
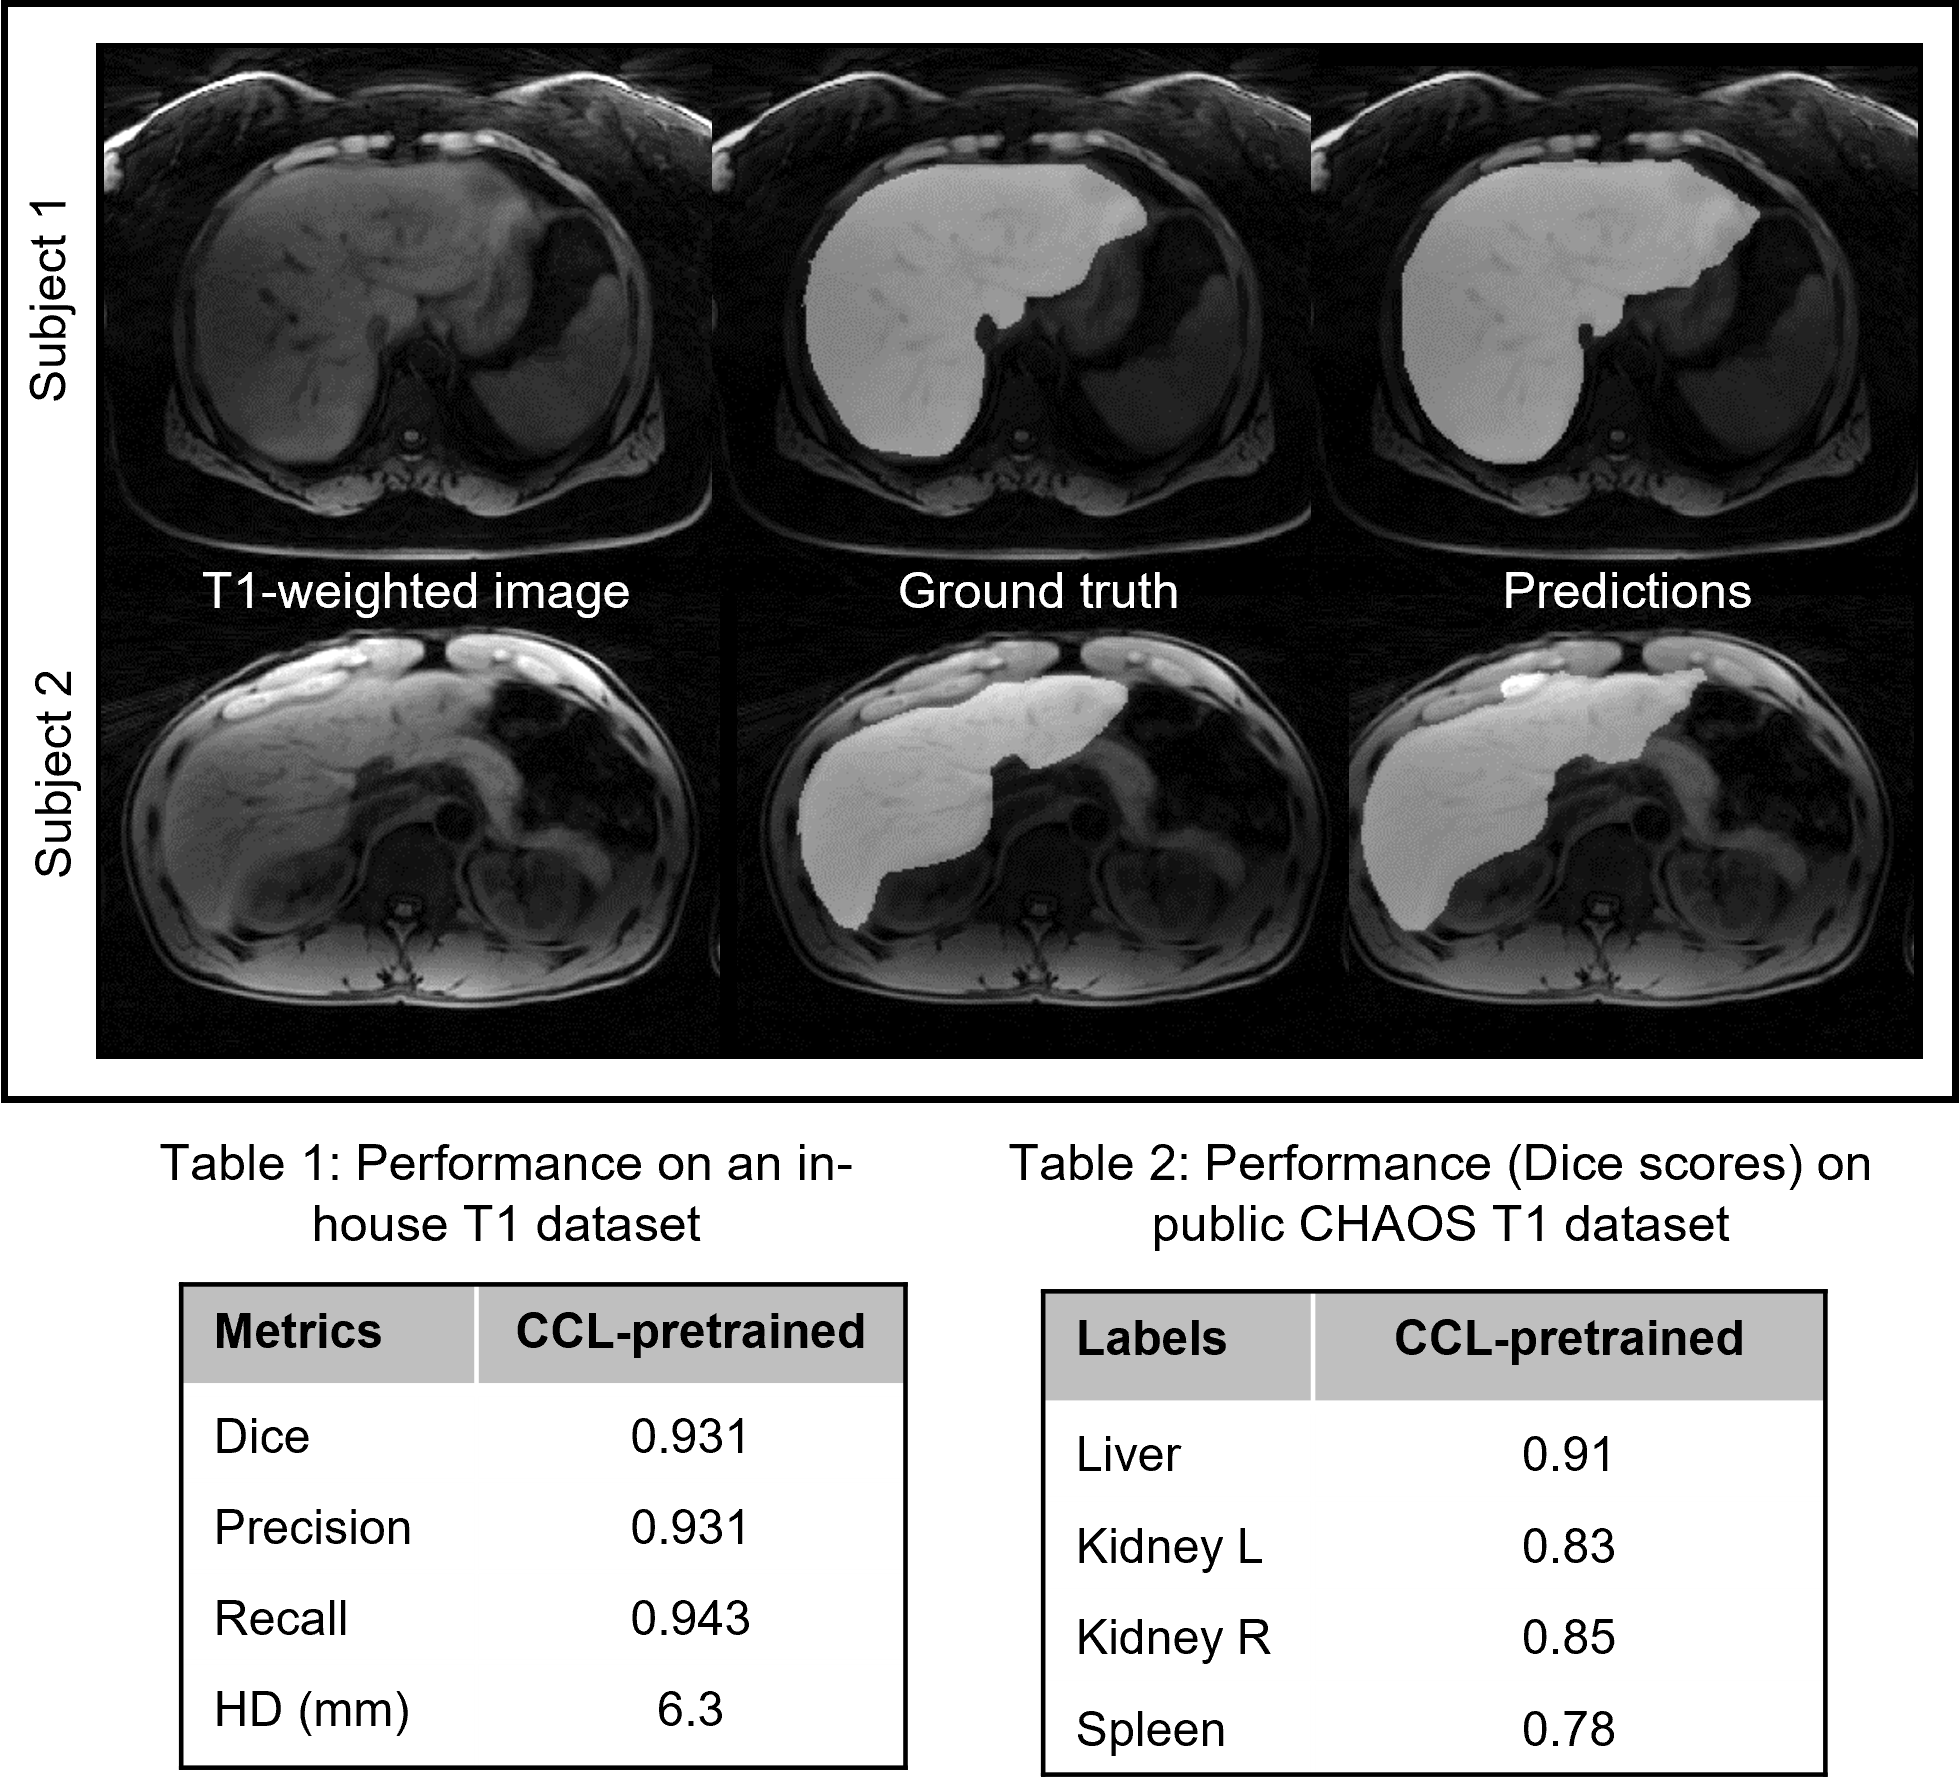
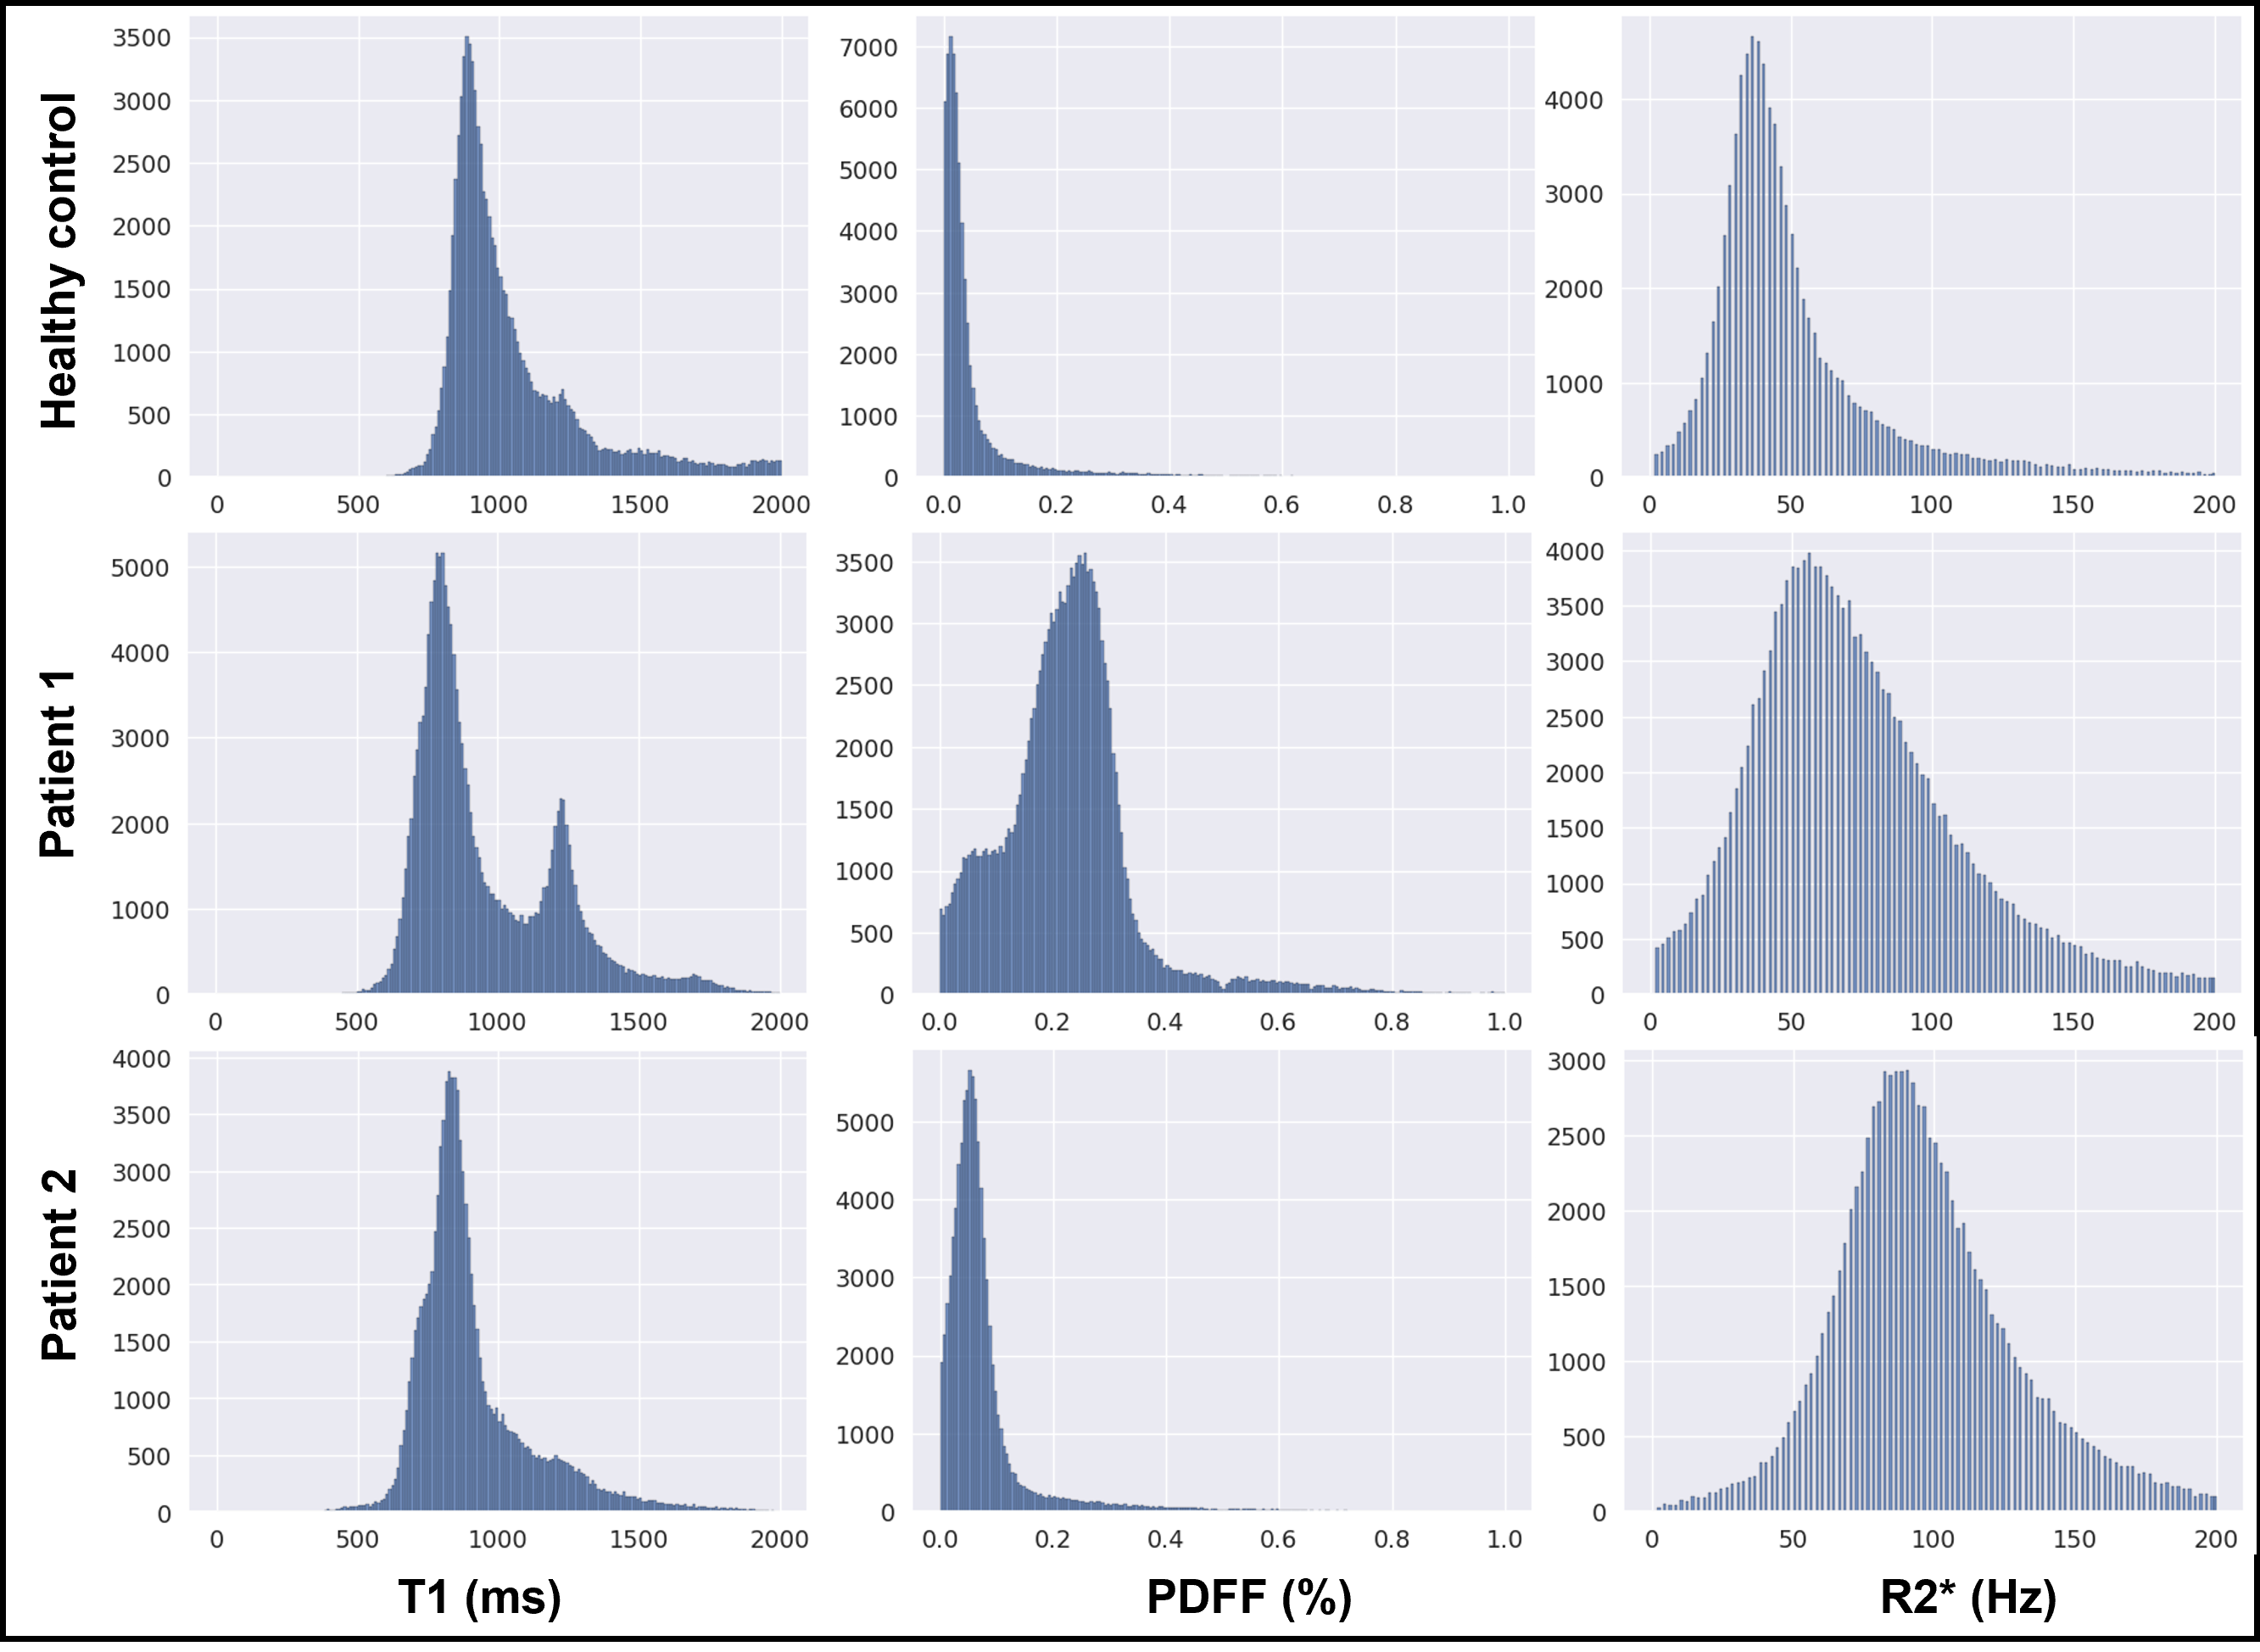
Figure 3 shows the representative feature maps generated from the CCL-pretrained DL model for an input T1-weighted image (left). Different feature maps highlight different anatomical structures, demonstrating the ability of the model to separate different tissue types in the representational space. It is easy to observe that initializing a DL model from such representations can be beneficial for subsequent multi-organ segmentation tasks in T1-weighted images. Figure 4 provides a qualitative and quantitative comparison of the segmentation performance of the model on the in-house T1 dataset, and the public CHAOS in-phase T1 images. Even with limited labeled data (n=12), the model performed very well on the segmentation task. The trained model was employed to generate liver masks for conducting histogram analysis on water-specific T1 maps, proton-density fat fraction (PDFF), and R2* values obtained from one healthy control, one patient exhibiting elevated PDFF and R2*, and another patient displaying elevated R2* alone (Figure 5). The disparities in MR parameter distributions among different subjects are readily visible in the histogram plots.Discussion and Conclusion
This work proposes a novel self-supervised deep learning training technique for automated organ segmentation. In quantitative MRI, training can be performed using images employed for parameter estimation, which typically provide varying image contrasts that can improve segmentation accuracy. Leveraging this automated segmentation framework, we have demonstrated analysis of quantitative MR maps using simple histogram plots for interpreting these maps. Our method can be further improved with more advanced analysis algorithms, and it can also be integrated with other quantitative methods.Acknowledgements
This work was performed under the rubric of the Center for Advanced Imaging Innovation and Research (CAI2R, www.cai2r.net), an NIBIB National Center for Biomedical Imaging and Bioengineering (NIH P41 EB017183).References
[1] Umapathy L, Brown T, Mushtaq R, et al. Reducing annotation burden in MR: A novel MR-contrast guided contrastive learning approach for image segmentation. Med Phys. 2023;1-14. https://doi.org/10.1002/mp.16820
[2] Umapathy L, Brown T, et al. Reducing annotation burden in MR segmentation: A novel contrastive learning loss with multi-contrast constraints on local representations. Proc. ISMRM. 2023
[3] Benkert T, Feng L, Sodickson, DK, Chandarana, H, and Block, KT. Free-breathing volumetric fat/water separation by combining radial sampling, compressed sensing, and parallel imaging. Magn. Reson. Med. 2017, 78: 565-576. https://doi.org/10.1002/mrm.26392
Figures