1770
Enhancing Low-Count PET Image Quality via Unsupervised Deep Learning using Novel Cost Function – A PET/MRI study1Radiology and Imaging Science, Emory University School of Medicine, Atlanta, GA, United States, 2Biomedical Engineering, Stony Brook University, Stony Brook, NY, United States, 3Biomedical Engineering, Georgia Institute of Technology, Atalnta, GA, United States
Synopsis
Keywords: AI/ML Image Reconstruction, Machine Learning/Artificial Intelligence, PET/MR, unsupervised learning
Motivation: PET/MRI enables MR-assisted PET denoising for low-count PET. Recent work has demonstrated the potential of unsupervised deep learning (uDL) denoising method with the advantage of not requiring large amount of training data. We believe the performance of uDL denoising with MR guidance can be further improved.
Goal(s): To demonstrate the efficacy of a novel cost function in enhancing the quality of denoised low-count PET images using uDL techniques.
Approach: We utilized dNet with MRI as input and low-count PET as target, along with a novel cost function consisting of Bowsher prior and mean square error.
Results: Our method outperformed all other denoising methods.
Impact: The impact of the study is the potential for significant improvements in low-count PET image quality through advanced denoising techniques, which could enhance diagnostic accuracy while reducing radiation exposure for patients.
Introduction
Low-count PET scans offer the advantage of reduced radiation exposure and/or shorter scan times. However, the image quality of low-count PET scans reconstructed through conventional methods falls short of meeting the requirements for clinical or research purposes. Deep learning denoising has been shown to be capable of recovering the signal, particularly that unsupervised learning can denoise PET images without the need of large amount of training data1. This has been demonstrated by recent works1,2. These works demonstrated the network architecture is capable of denoising images without training data, and the incorporation of MRI as input can further improve the performance. We expect further improvement to be achieved by using a more advanced cost function. In this study, we propose a novel cost function in this unsupervised denoising task and demonstrate its performance in brain PET/MRI studies in comparison to other cost functions and more traditional denoising approaches, including Gaussian denoising and non-local mean (NLM).Methods
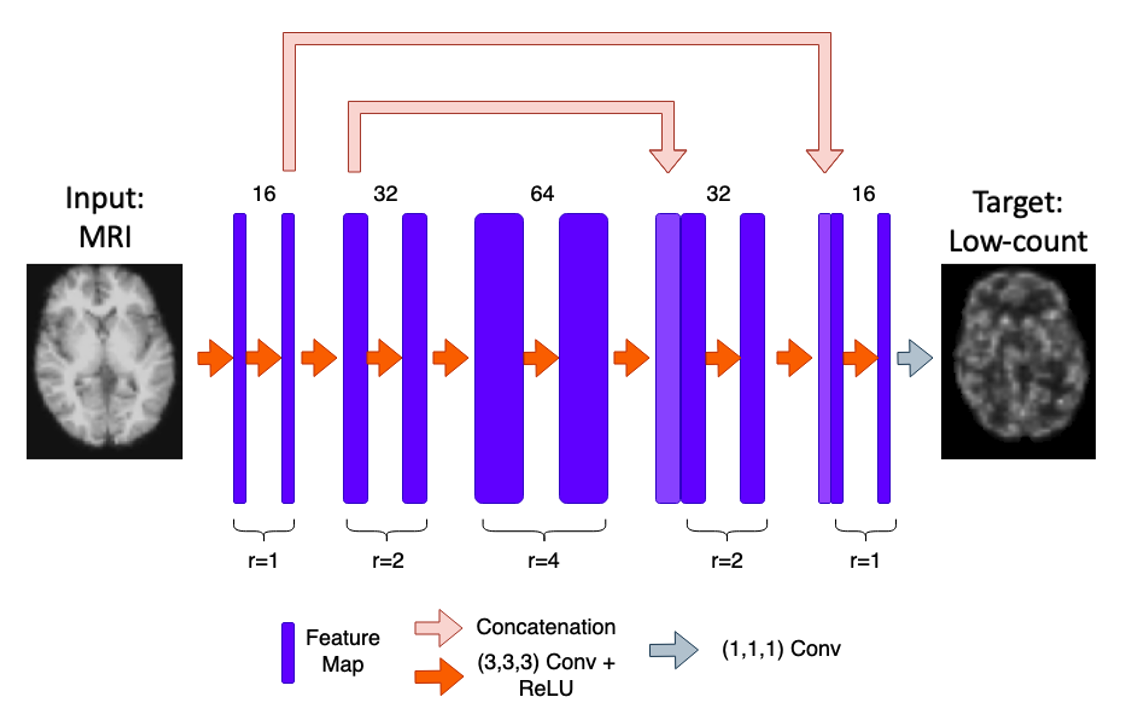
Twenty-eight 18F-FDG brain PET/MRI studies were gathered from our previously acquired research studies. None of these patients had brain tumors or neurological diseases. All data sets used listmode acquisition with a 20-channel PET-compatible MRI head coil on a Siemens Biograph mMR PET/MRI scanner. T1-weight MRI images were acquired using MPRAGE sequence (TE/TR/TI = 3.24/2300/900 ms, flip angle = 9 degree, voxel size = 0.87×0.87×0.87mm3). Attenuation maps were generated using a well-established MPRAGE-based algorithm3,4. Static PET images were reconstructed from 10-minute emission data 50-60 minutes after injection, using Siemens' E7tools with ordered subset expectation maximization (OSEM). Low-count PET data, representing 10% of the counts, were created through Poisson thinning of the listmode data and reconstructed using the aforementioned method.For our approach, we utilized a dNet architecture with dilated convolution5, as shown in Figure 1. This network has been shown to outperform traditional uNet, particularly with the recovery of fine structure. Freesurfer-normalized anatomical MPRAGE images served as input for the network, while low-count PET images were the network’s target output. We introduced a novel cost function, which uses the Bowsher prior (BP)6,7 between the recovered PET images and anatomical MRI, as well as the mean square error (MSE) between the recovered PET images and the low-count PET images.
To assess the performance of the network, we compared its results to full-count data using the following commonly used quantitative metrics: 1) Peak Signal-to-Noise Ratio (PSNR), 2) Structure Similarity Index Measures (SSIM), and 3) Root Mean Square Error (RMSE), all calculated in reference to the full-count image. The fine-tuning of the network, including hyperparameter selection and the weighting of the Bowsher prior and MSE in the loss function, was conducted using one random subject. Subsequently, these same hyperparameters and weighting were applied to the rest of the dataset.
Gaussian denoising and NLM algorithms were also performed for comparison purposes. Furthermore, apart from the BP, we explored the use of other functions capable of extracting information from MRI in the stopping criterion, including mutual information (MI) and SSIM. We also evaluated MSE as a baseline. All these methods were fine-tuned using the same subject that was employed for tuning our model. All models stop when the loss’s improvement is less than 0.05 for 600 epochs.
Results
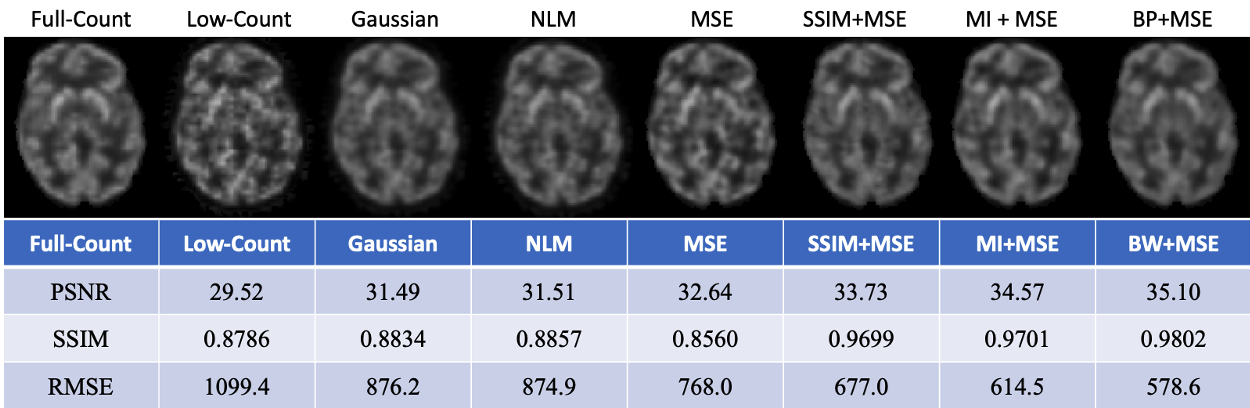
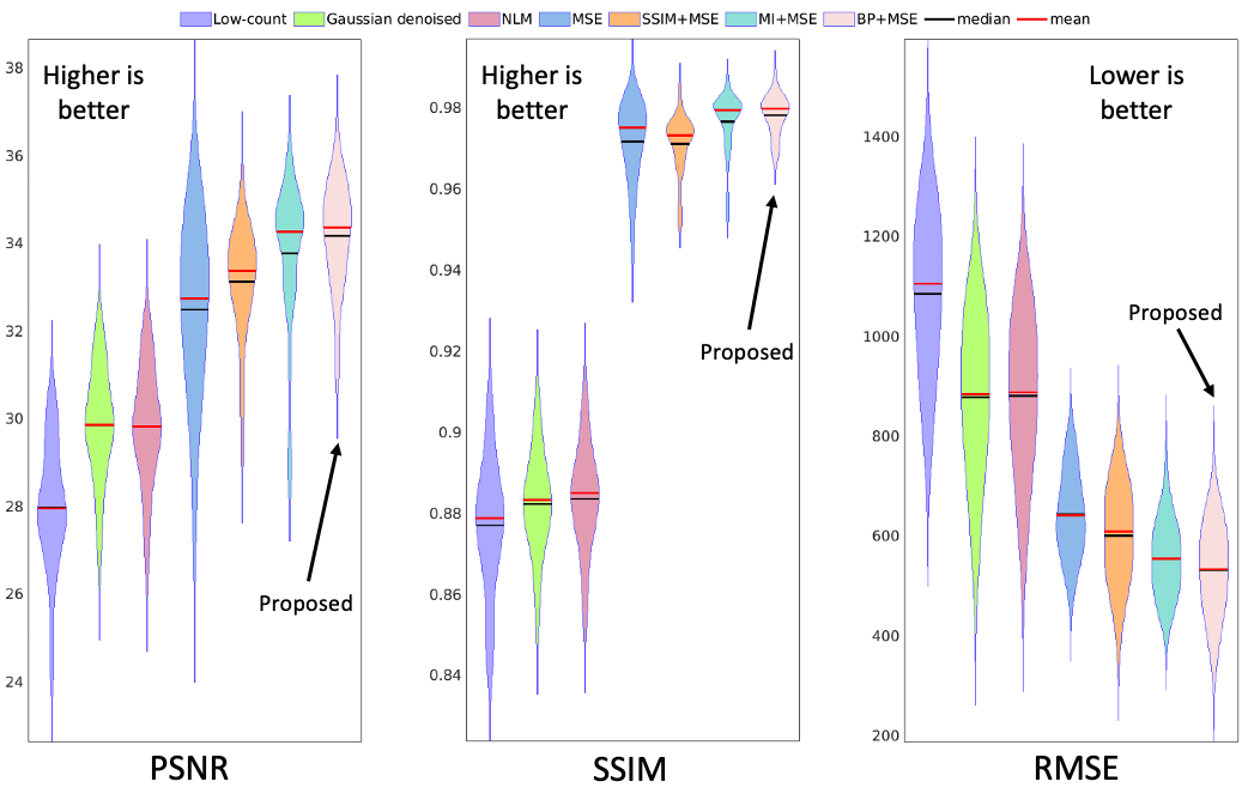
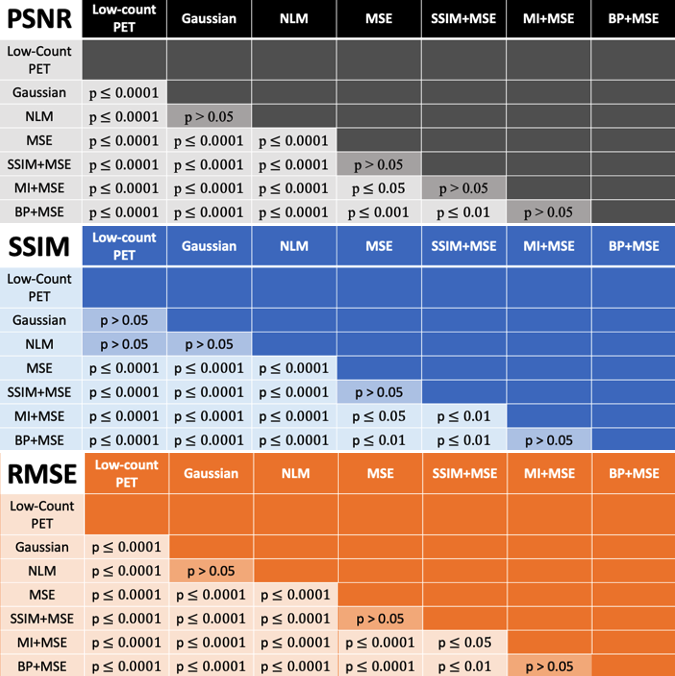
An example of network output is shown in Figure 2 from a representative subject, along with the PSNR, SSIM, and RMSE of that subject for each method. The quantitative metrics for each method are shown in Figure 3. The p-values of the paired student t-test between each group for PSNR, SSIM, and RMSE are shown in Figure 4.Discussion
All denoising methods showed improvement compared to low-count PET. Gaussian denoising and NLM achieved similar performance in terms of PSNR, SSIM, and RMSE. All unsupervised denoising approaches with various cost functions performed better than Gaussian denoising and NLM. The unsupervised denoising using the proposed cost function of BP combined with MSE performed the best, with the cost function combining MI and MSE achieving similar performance.Conclusion
Our result showed that our unsupervised dNet denoising with novel cost function outperformed conventional Gaussian denoising, NLM in all global image similarity metrics, as well as the same network architecture using other more conventional cost functions.Acknowledgements
The data used in this work was collected with support from NIH/NIMH R01MH104512. This work was in part supported by the Parkinson Foundation.References
1. Cui J, Gong K, Guo N, et al. PET image denoising using unsupervised deep learning. Eur J Nucl Med Mol Imaging. 2019;46(13):2780-2789. doi:10.1007/s00259-019-04468-4
2. Zhao T, Hagan T, DeLorenzo C, Huang C. Deep Learning-based Low-Count PET Image Recovery without the Need for Training Data – A PET/MR Study. Journal of Nuclear Medicine. 2023;64(supplement 1):P817-P817.
3. Poynton CB, Chen KT, Chonde DB, et al. Probabilistic atlas-based segmentation of combined T1-weighted and DUTE MRI for calculation of head attenuation maps in integrated PET/MRI scanners. Am J Nucl Med Mol Imaging. 2014;4(2):160-171.
4. Chen KT, Izquierdo-Garcia D, Poynton CB, Chonde DB, Catana C. On the Accuracy and Reproducibility of a Novel Probabilistic Atlas-based Generation for Calculation of Head Attenuation Maps in Integrated PET/MR Scanners. Eur J Nucl Med Mol Imaging. 2017;44(3):398-407. doi:10.1007/s00259-016-3489-z
5. Spuhler K, Serrano-Sosa M, Cattell R, DeLorenzo C, Huang C. Full-count PET recovery from low-count image using a dilated convolutional neural network. Medical Physics. 2020;47(10):4928-4938. doi:10.1002/mp.14402
6. Bowsher JE, Yuan H, Hedlund LW, et al. Utilizing MRI information to estimate F18-FDG distributions in rat flank tumors. In: IEEE Symposium Conference Record Nuclear Science 2004. Vol 4. ; 2004:2488-2492 Vol. 4. doi:10.1109/NSSMIC.2004.1462760
7. Schramm G, Holler M, Rezaei A, et al. Evaluation of Parallel Level Sets and Bowsher’s Method as Segmentation-Free Anatomical Priors for Time-of-Flight PET Reconstruction. IEEE Transactions on Medical Imaging. 2018;37(2):590-603. doi:10.1109/TMI.2017.2767940
Figures