1757
Accelerating Chemical Exchange Saturation TransferImaging using a Diffusion Model1Shenzhen Institute of Advanced Technology,Chinese Academy of Sciences, Shenzhen, China, 2Medical AI Lab,School of Biomedical Engineering, Shenzhen University Medical School,, Shenzhen University, Shenzhen, China, 3Guangdong Key Laboratory of Biomedical Measurements and Ultrasound Imaging,School of Biomedical Engineering, Shenzhen University Medical School, Shenzhen University, Shenzhen, China
Synopsis
Keywords: AI/ML Image Reconstruction, CEST & MT
Motivation: Chemical exchange saturation transfer (CEST) magnetic resonance (MR) imaging is slow, and rapid radial undersampling significantly compromises the image quality of CEST data.
Goal(s): Our goal is to enhance the image performance of CEST reconstruction under higher radial undersampling.
Approach: A diffusion model is introduced to obtain prior information from MRI data, and its performance is evaluated on CEST data under radial sampling.
Results: The proposed method generated high-quality CEST source images in healthy human data, outperforming iGRASP.
Impact: The proposed method has achieved rapid imaging of CEST data, providing high-quality CEST source images .
Introduction
Chemical Exchange Saturation Transfer (CEST) imaging is a magnetic resonance imaging technique widely used for detecting and visualizing the distribution and concentration of biomolecules in tissues in various diseases1. However, it requires acquiring a series of image frames with different saturation frequency offsetss2, leading to long scan times, which limits its applicability. Traditional acceleration methods based on compressed sensing 3 are used to accelerate CEST imaging, but they are limited in terms of acceleration factors.In recent years, the diffusion model 4 has been proposed, which can accurately estimate the data distribution $$$p(x)$$$ and generate fine details. However, this approach inevitably introduces various degrees of detail errors. Therefore, a CEST acceleration method based on the diffusion model is proposed to learn the data distribution of MRI, generate fine details, and ensure data fidelity through data consistency constraints. This approach allows for the avoidance of detail errors and the achievement of accelerated CEST imaging.Method
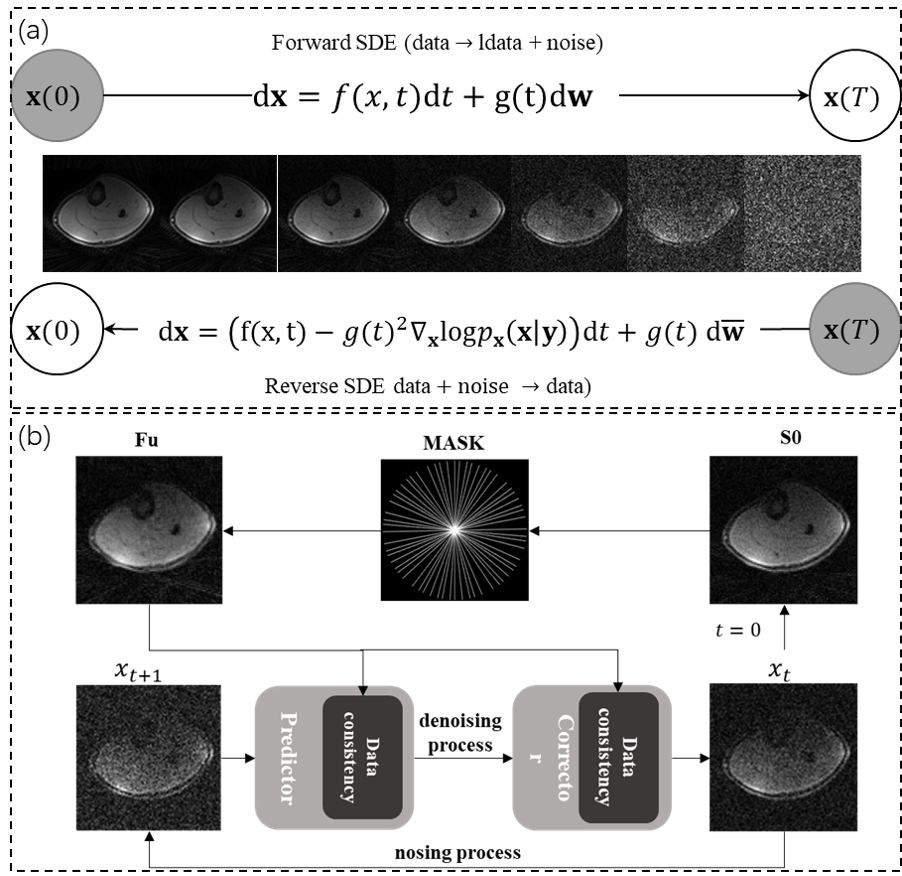
This section describes our application method, and Figure 1 illustrates the overall framework of the reconstruction process.The imaging model of MR reconstruction can be formulated as:$$\mathbf{x}^* = \underset{\mathbf{x}}{\arg \min} \frac{1}{2} \|\mathbf{Ax}-\mathbf{y}\|_2^2 + \mathcal{R}(\mathbf{x}), \tag{1}$$,where $$$\mathbf{y}$$$ is the undersampled measurements in the frequency domain (i.e., $$$k$$$-space), $$$\mathbf{x}$$$ is the image to be reconstructed, $$$\mathbf{A}$$$ denotes the encoding matrix, $$$\mathbf{A} = \mathbf{F} \cdot \text{csm}$$$, $$$\mathbf{F}$$$ denotes the non-uniform Fourier operator, $$$\text{csm}$$$ denotes the coil sensitivity, and $$$\boldsymbol{\epsilon} \sim \mathcal{N}(0, \sigma^2_\epsilon)$$$. For 2D image, $$$\mathbf{x} \in \mathbb{C}^n$$$, $$$\mathbf{y} \in \mathbb{C}^m$$$, and $$$\mathbf{A} \in \mathbb{C}^{m\times n}$$$. $$$\mathcal{R}(\mathbf{x})$$$ is the prior constraint of the MR image.
The diffusion model is a class of generative models that treats the generation process as the reverse of a data-noising process, where the diffusion process is continuous over time $t$. In the forward SDE process: $$\begin{equation} \mathrm{d}\mathbf{x} = \mathbf{f}(\mathbf{x}, t)\mathrm{d}t + g(t)\mathrm{d}\mathbf{w},\end{equation}$$ where the function $$$\mathbf{f}$$$ is the drift function of $$$\mathbf{x}(t)$$$ and $$$g$$$ is called the diffusion coefficient. $$$\mathbf{w}$$$ is the standard Wiener process.
In the reverse SDE:
$$\begin{equation} \mathrm{d}\mathbf{x} = \left[\mathbf{f}(\mathbf{x}, t) - g(t)^{2}\nabla_{\mathbf{x}}\log p_{t}(\mathbf{x})\right]\mathrm{d}t + g(t)\mathrm{d}\mathbf{\bar{w}},\end{equation}$$ where $$$\nabla_{\mathbf{x}}\log p_{t}(\mathbf{x})$$$ is known as the score function (trained by a network), and $$$\mathbf{\bar{w}}$$$ is the standard Wiener process when time goes back to $$$0$$$ from $$$T$$$.
Given the undersampled measurement y, the score function can be updated according to Eq(1) and Bayes' theorem:$$\begin{align} \nabla_{\mathbf{x}} \log p_{t}(\mathbf{x}(t) \mid \mathbf{y}) & \approx \mathbf{s}_{{\boldsymbol{\theta}}^*}(\mathbf{x}(t), t) + \frac{\mathbf{A}^H(\mathbf{y}-\mathbf{A} \mathbf{x}(t))}{\sigma^2_\epsilon}. \tag{2}\end{align}$$
Therefore, the undersampled data $$$y$$$ is incorporated into the diffusion process as a consistency constraint. The denoising process in Figure 1(b) demonstrates the way it is added.
Result
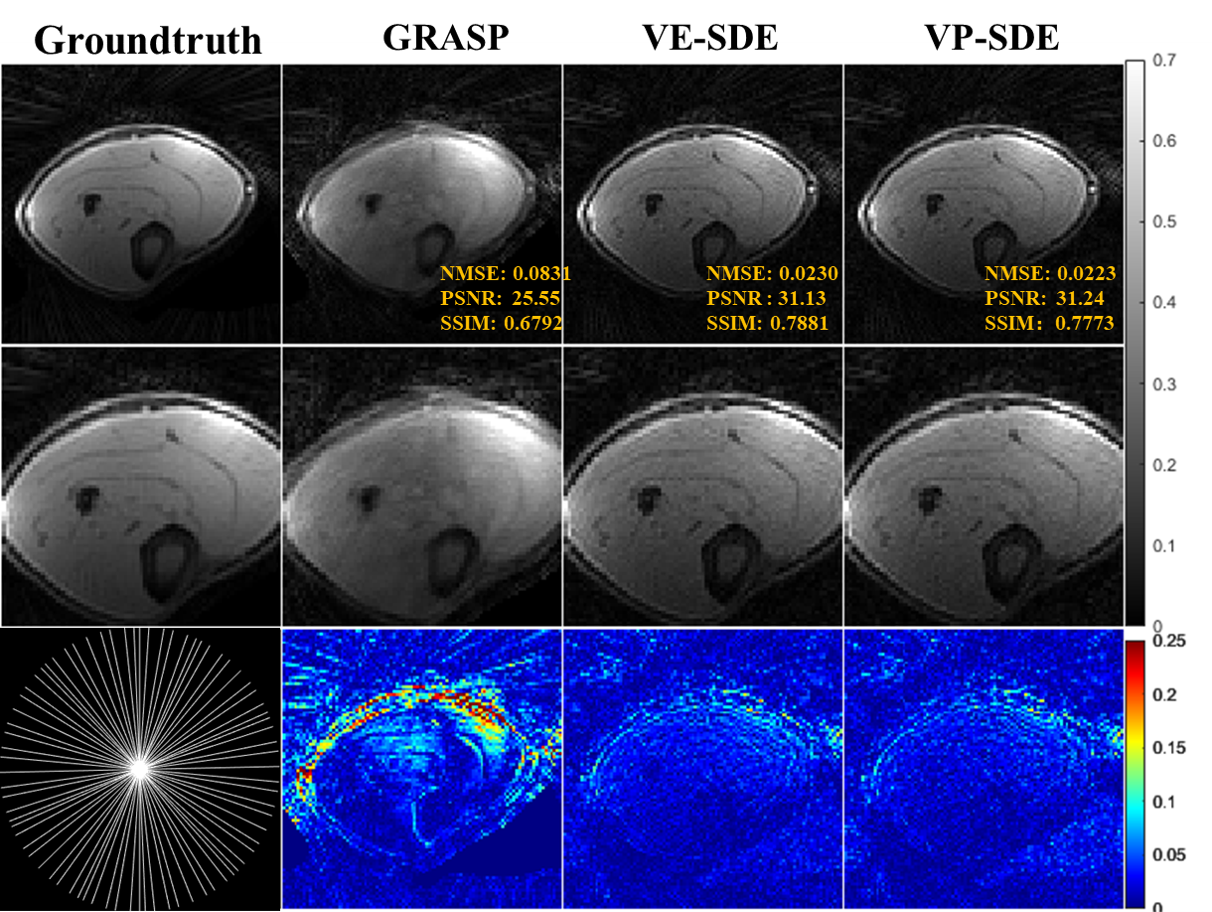
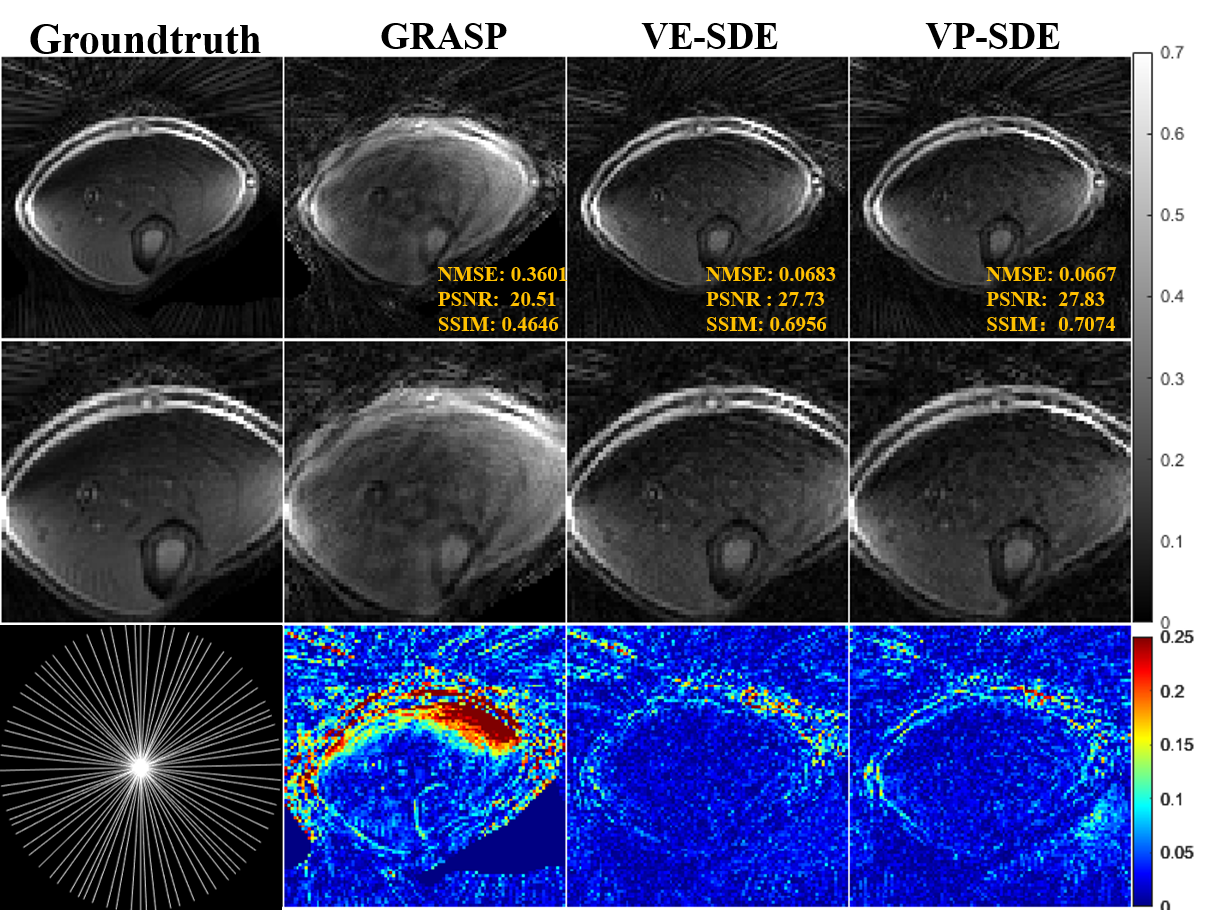
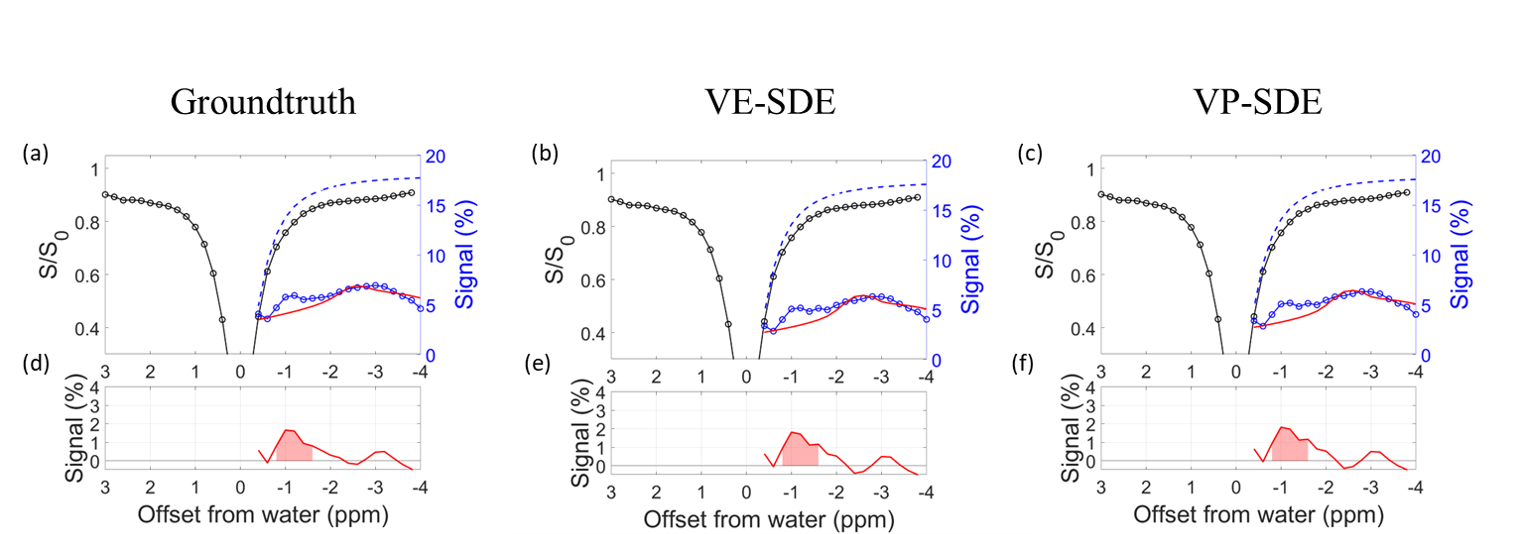
We used the publicly available fastMRI dataset 5,6 as the training set and CEST data as the test set. For the CEST dataset, we conducted scans of a healthy volunteer's lower leg using a United Imaging 5T MRI system with the following parameters: saturation duration = 750 ms, TR/TE = 4/1.79 ms, flip angle = 7°, number of spokes = 80, FOV = $$$160 \times 160 \times 200$$$ mm, pixel resolution = $$$1.67 \times 1.67 \times 10$$$ mm, and bandwidth = 400 Hz/pixel. The frequency offset ranged from $$$-4$$$ to $$$4$$$ ppm with a step size of $$$0.2$$$ ppm. A total of 42 CEST frames were acquired, including one unsaturated image and 41 saturated images. We generated sensitivity maps using ESPIRiT 7, which is implemented in the BART toolbox 8.For comparison, the results reconstructed using GRASP 9, VE-SDE, and VP-SDE were displayed, with NMSE, PSNR, and SSIM used as evaluation metrics.Figures 2 and 3 present the reconstruction results of the GRASP, VE-SDE, and VP-SDE models under radial undersampling with 38 spokes (acceleration factor of 8). Figure 2 displays the results on the unsaturated images, where GRASP exhibits noticeable artifacts and blurriness in the edge regions, leading to lower image quality. In contrast, VE-SDE and VP-SDE recover more realistic details with fewer artifacts. Among them, VE-SDE achieves the lowest NMSE and highest PSNR and SSIM, demonstrating superior performance. Figure 3 shows the saturated images at 0ppm, where GRASP appears highly blurry, while VE-SDE and VP-SDE maintain good details. In terms of performance, VP-SDE slightly outperforms VE-SDE across the metrics. Furthermore, Figure 4 illustrates the Z-spectrum and glycoNOE maps of the reference signal, VE-SDE reconstructed signal, and VP-SDE reconstructed signal. Both VE-SDE and VP-SDE exhibit no significant differences compared to the reference signal, indicating excellent performance.Conclusion
The prior distribution of MRI data was learned using a diffusion model, which was combined with data consistency priors to achieve rapid CEST imaging. Superior performance was demonstrated by both VE-SDE and VP-SDE, surpassing GRASP.Acknowledgements
This study was supported in part by the National Key R\&D Program of China nos. 2020YFA0712200, 2021YFF0501402, National Natural Science Foundation of China under grant nos. 81971611, 62125111, U1805261, 62106252, 12026603, the Guangdong Basic and Applied Basic Research Foundation no. 2021A1515110540, Shenzhen Science and Technology Program under grant no. RCYX20210609104444089.References
1. K. Ward, A. Aletras, and R. S. Balaban. A new class of contrast agents for mri based on protonchemical exchange dependent saturation transfer (cest). Journal of magnetic resonance, 143(1):79–87, 2000.
2. Y. Zhang, T. Zu, R. Liu, and J. Zhou. Acquisition sequences and reconstruction methods for fastchemical exchange saturation transfer imaging. NMR in Biomedicine, 36(6):e4699, 2023.3.
3. J. Kim, C. P. Johnson, D. Wang, and P. Z. Sun. Accelerated cest mri using parallel imaging acquisitionof golden-angle radial ordering scheme and compressed sensing reconstruction. In Proceedings ofthe 23rd Annual Scientific Meeting ISMRM. Toronto, Canada, page p3621, 2015.
4. Y. Song, J. Sohl-Dickstein, D. P. Kingma, A. Kumar, S. Ermon, and B. Poole. Score-based generativemodeling through stochastic differential equations. arXiv preprint arXiv:2011.13456, 2020
5. Zbontar, F. Knoll, A. Sriram, T. Murrell, Z. Huang, M. J. Muckley, A. Defazio, R. Stern, P. Johnson,M. Bruno, et al. fastmri: An open dataset and benchmarks for accelerated mri. arXiv preprintarXiv:1811.08839, 2018.
6. F. Knoll, J. Zbontar, A. Sriram, M. J. Muckley, M. Bruno, A. Defazio, M. Parente, K. J. Geras,J. Katsnelson, H. Chandarana, et al. fastmri: A publicly available raw k-space and dicom dataset ofknee images for accelerated mr image reconstruction using machine learning. Radiology. Artificialintelligence, 2(1), 2020.
7. M. Uecker, P. Lai, M. J. Murphy, P. Virtue, M. Elad, J. M. Pauly, S. S. Vasanawala, and M. Lustig. Es-pirit—an eigenvalue approach to autocalibrating parallel mri: where sense meets grappa. Magneticresonance in medicine, 71(3):990–1001, 2014.
8. M. Uecker, J. I. Tamir, F. Ong, and M. Lustig. The bart toolbox for computational magnetic resonanceimaging. In Proc Intl Soc Magn Reson Med, volume 24, page 1, 2016.
9. L. Feng, L. Axel, H. Chandarana, K. T. Block, D. K. Sodickson, and R. Otazo. Xd-grasp: golden-angle radial mri with reconstruction of extra motion-state dimensions using compressed sensing.Magnetic resonance in medicine, 75(2):775–788, 2016.
Figures