1754
Synthesis from PET to MR and CT modal images using the latent diffusion model1Shenzhen Institute of Advanced Technology,Chinese Academy of Sciences, Shenzhen, China, 2Peking Union Medical College Hospital, Beijing, China, 3Key Laboratory of Biomedical Imaging Science and System, Chinese Academy of Sciences, Shenzhen, China
Synopsis
Keywords: AI Diffusion Models, Image Reconstruction
Motivation: Medical images in different modalities (MR\PET\CT) can provide different information, which can help to fully understand a patient's condition and assist physicians in making accurate diagnoses and treatment plans.
Goal(s): Using the diffusion model to generate multiple modal images from a single modality.
Approach: We propose the conditional latent diffusion model (CLDM) guided by category information to address the challenge of completing the target modal image within the same body.
Results: Compared to images generated by GANs, our model produces higher quality images with enhanced capabilities, particularly in capturing intricate details.
Impact: Our study offers bright future for diffusion models in the complementary field of medical imaging modalities.
INTRODUCTION
Medical imaging techniques have become indispensable tools for medical diagnosis, treatment and research. Among these techniques, positron emission tomography (PET), computed tomography (CT) and magnetic resonance imaging (MRI) play pivotal roles as the main medical imaging modalities[1-3]. While the various medical imaging modalities make different contributions to clinical practice, they also differ in the information they provide. Clinical practice often requires the use of multimodal imaging for a comprehensive assessment of a patient's condition [4-5]. However, acquiring images of three different modalities of the same subject is often highly challenging considering factors such as complexity, cost and ethics of data alignment [6]. This work focuses on the use of diffusion modeling to generate missing modality images and to enable the generation of multiple modality images from a single modality.METHODS
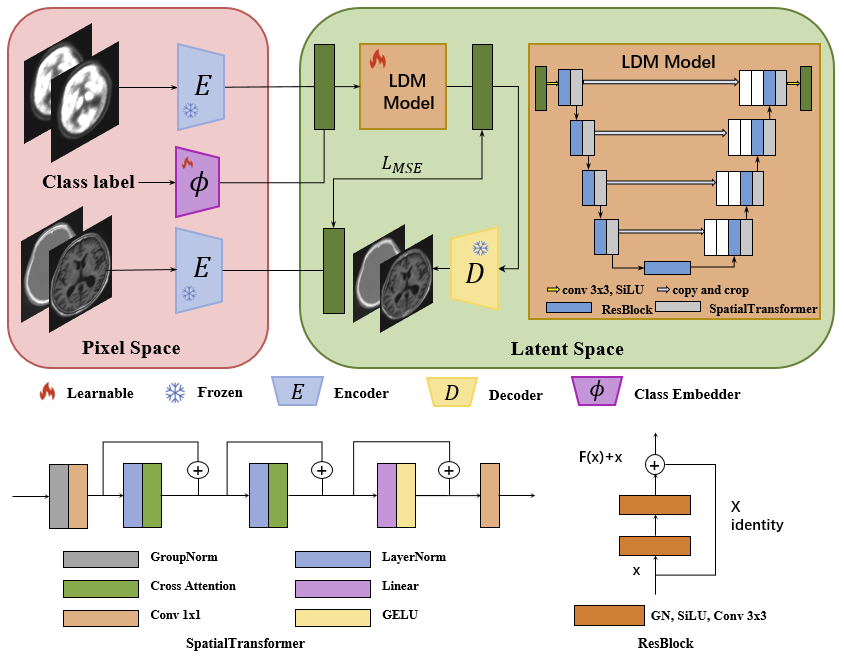
In this study, we utilize the brain imaging dataset from Peking Union Medical College Hospital to train the generative model. After careful selection, we chose 6785 pairs of PET/CT images and 2090 pairs of PET/MR images, where each PET image corresponds to CT and MR images of the same individual. A total of 8875 paired images from the same individual were used for training by assigning different codes to the CT and MR images. All images are preprocessed by min–max normalization before input to the model and then recovered by denormalization in the prediction stage. We propose the conditional latent diffusion model (CLDM) guided by category information to address the challenge of completing the target modal image within the same body. Figure 1 illustrates the overall structure of our approach. The encoder is designed to encode the source and target modal images to compress the input image. The input data are compressed into a low-dimensional latent representation with diffusion model generation modeling properties. The decoder can reconstruct the encoded latent representation into a natural image. The diffusion model [7, 8] converts Gaussian noise through an iterative denoising process to generate new data that follow the training data distribution. Given a natural image of the source modality, the diffusion process continuously adds Gaussian noise to the data, generating a latent representation through a Markov chain and generating new data. Guided by the category information, the LDM network is able to transform this latent representation into a latent representation of the target modal image. The reduction process is also modeled as Markov chain learning to recover the original input from noise, recover the new latent representation, and reduce the new latent representation to the target modal image. Our network training consists of two phases: first, training the self-encoder and then training the CLDM network. For the CLDM network, the training set consisted of 50 patient cases, and the remaining cases were used for validation. During the training process, PET as the source modality and CT and MR as the target modalities are used as inputs and labels, respectively. All experiments were performed on an A6000 GPU using the PyTorch neural network framework.RESULTS
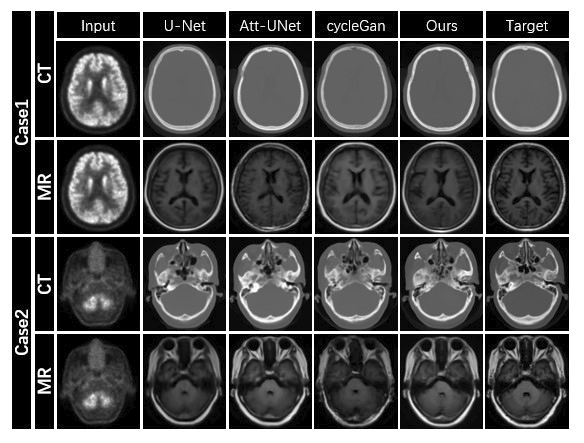
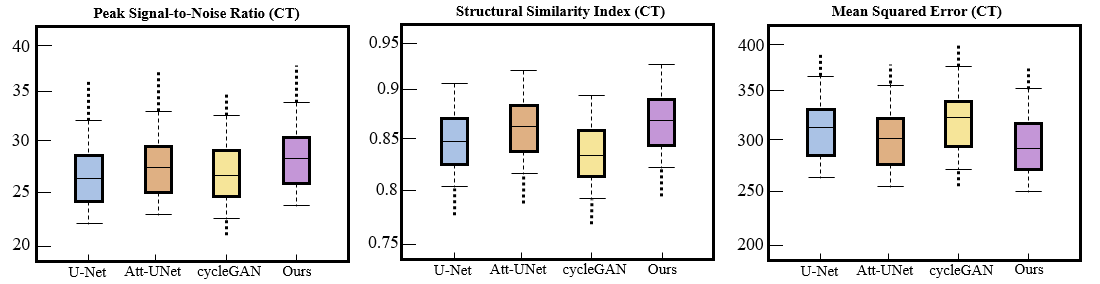
To evaluate the comprehensive performance of the models, we compare the images generated by different models, such as U-Net, Att-UNet, cycleGan and real images. All these methods are built on the architecture of convolutional neural networks and GANs. The obtained images are shown in Fig. 2, where Case 1 and Case 2 represent different slices of the same patient. It is clear that the images generated by our model are of higher quality and show greater capability, especially in capturing complex details, compared to the images generated by the GAN. In addition, we have quantitatively evaluated the results generated by different models. Fig. 3 shows the quantitative results of PSNR and SSIM for the generated images. Both qualitative and quantitative results show that our method performs well compared to other methods.CONCLUSION
In our study, we utilize a diffusion model to infer complementary modal images of the same person when provided with unimodal images. Compared to other GAN-based approaches, our model shows higher quality image generation and can skillfully integrate cross-modal information to accomplish overall inference. In addition, our model can dynamically generate images for the corresponding modality under the influence of switching codes. In our next work, we will improve the model by incorporating subtle details such as brain matter as conditioning factors for image generation. In conclusion, our study provides a bright future for diffusion modeling in the field of modality complementation for medical imaging.Acknowledgements
This work was supported by the National Natural Science Foundation of China (82372038 and 62101540), the Shenzhen Excellent Technological Innovation Talent Training Project of China (RCJC20200714114436080), the Key Laboratory for Magnetic Resonance and Multimodality Imaging of Guangdong Province (2023B1212060052) and the Shenzhen Science and Technology Program (JCYJ20220818101804009 and RCBS20210706092218043).References
[1] Drzezga A, Souvatzoglou M, Eiber M, et al. First clinical experience with integrated whole-body PET/MR: comparison to PET/CT in patients with oncologic diagnoses[J]. Journal of Nuclear Medicine, 2012, 53(6): 845-855.
[2] Sekine T, de Galiza Barbosa F, Sah B R, et al. PET/MR outperforms PET/CT in suspected occult tumors[J]. Clinical nuclear medicine, 2017, 42(2): e88-e95.
[3] Jadvar H, Parker J A. Clinical PET and PET/CT[M]. Springer Science & Business Media, 2005.
[4] PET and PET-CT in oncology[M]. Springer Science & Business Media, 2003.
[5] Jiang J, Tang X, Pu Y, et al. The Value of Multimodality PET/CT Imaging in Detecting Prostate Cancer Biochemical Recurrence[J]. Frontiers in Endocrinology, 2022, 13: 897513.
[6] Guo Z. The Principle and State-of-Art Facilities for PET[C]//Journal of Physics: Conference Series. IOP Publishing, 2022, 2386(1): 012062.
[7] Croitoru F A, Hondru V, Ionescu R T, et al. Diffusion models in vision: A survey[J]. IEEE Transactions on Pattern Analysis and Machine Intelligence, 2023.
[8] Kazerouni A, Aghdam E K, Heidari M, et al. Diffusion models for medical image analysis: A comprehensive survey[J]. arXiv preprint arXiv:2211.07804, 2022.
Figures