1740
A study of quantitative susceptibility mapping on cerebral oxygen metabolism in patients with insomnia1Department of Radiology, The Second Clinical Medical College of Nanchang University, Nanchang, China
Synopsis
Keywords: fMRI Analysis, Quantitative Susceptibility mapping
Motivation: Abnormalities in cerebral oxygen metabolism can occur in many brain disorders. Cerebral venous oxygen saturation (CSVO2) allows the assessment of cerebral oxygen metabolism in patients with insomnia and thus indirectly reflects brain function.
Goal(s): This study aimed to explore alterations in cerebral oxygen metabolism in patients with insomnia.
Approach: CSVO2 in patients with insomnia and healthy controls was measured by 3D-slicer on quantitative susceptibility mapping (QSM). Statistical analysis was conducted using SPSS.
Results: Cerebral oxygen metabolism was lower in insomnia patients than in healthy controls, which was associated with sleep efficiency, R-phase share, and total sleep time.
Impact: Our study shows the impact of insomnia on cerebral oxygen metabolism and the ability to assess cerebral function noninvasively by QSM, which is useful in prompting early clinical intervention.
Introduction
Insomnia disorder[1] (ID) is a sleep disorder characterized by frequent and persistent difficulties in falling asleep and/or maintaining sleep and resulting in an unsatisfactory sense of sleep.ID is the most common sleep disorder and the second most common neuropsychiatric disorder [2]. With the development of neurofunctional imaging, more and more imaging techniques are being used to explore the pathophysiology of insomnia. Quantitative susceptibility mapping (QSM) is an MRI technique developed in recent years to quantify the distribution of magnetization rate in biological tissues, which enables non-invasive and more accurate determination of blood oxygen metabolism in the brain [3]. In this study, we assessed the alteration of cerebral oxygen metabolism in insomnia patients by QSM technique, aiming to find the functional imaging basis for the neuropathological mechanism of insomnia.Methods and Materials
Study population24 patients with ID (8 men, 37.43±3.53years) and 21 healthy volunteers (8 men, 53.08± 2.23years) were enrolled in the study.
Cerebral magnetic resonance imaging protocols
QSM was performed at a 3T MRI scanner (SIGNA Architect; GE Healthcare, CA, USA) with 48-channel head phased array coil. The imaging parameters were TR/TE: 41.2/3.2 ms, FOV: 256mm×256 mm, slice thickness: 1.0mm, Bandwidth: 62.5, Flip angle:20.
Imaging analysis
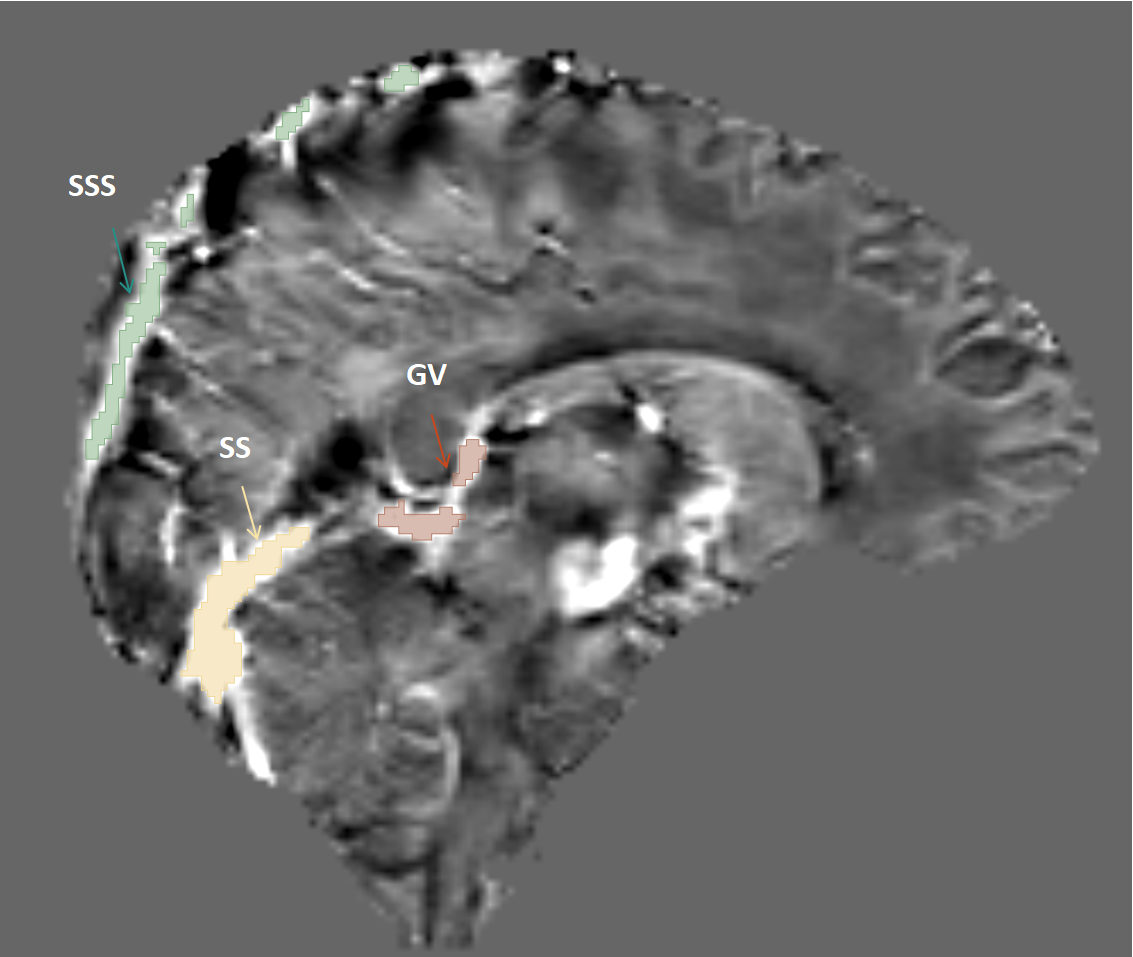
The images were post-processed by STI-Suite to obtain the magnitude and phase maps, and then the magnetization rate was measured by ROI outlining of the superior sagittal sinus, the straight sinus, the large cerebral veins and the surrounding brain tissues using 3D slicer software.(Figure 1)Finally, CSvO2 was calculated by the formula [4], where Hct is the hematocrit, χ is the difference in magnetization between blood and surrounding tissues, χoxy is the difference in magnetization between fully oxygenated blood and surrounding tissues, and χdo is the difference in magnetization between fully oxygenated blood and fully deoxygenated blood. difference. where χdo = 4π-0.27 ≈ 3.39 ppm and χOXY= 4π-(-0.03) ≈ - 0.38 ppm.
Statistical Analysis
Statistical analysis was performed using SPSS (version 26.0, Statistical Package for the Social Sciences, International Business Machines, Inc., Armonk, New York, USA).Normality and chi-square of data were tested by Shapro-Wilk and Levene .using age as a covariate, the indicators between the groups were compared by analysis of covariance.The correlation between CSv02 and Polysomnography(PSG) and Correlations between related indicators were analyzed using spearman analysis. P < 0.05 was considered statistically significant.
Result
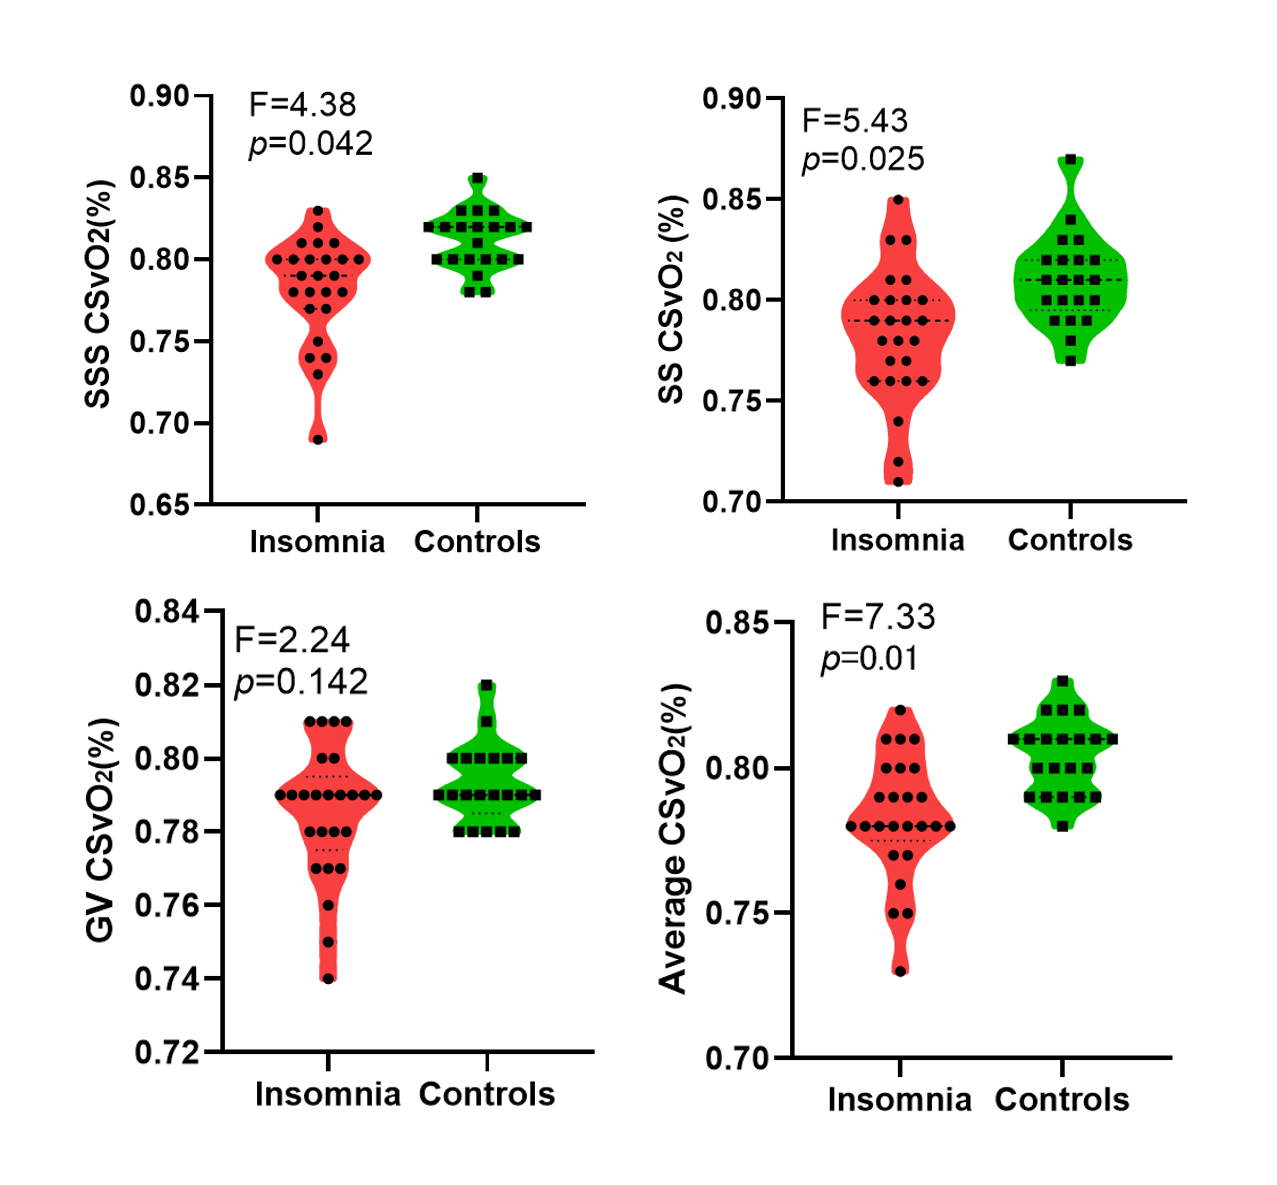
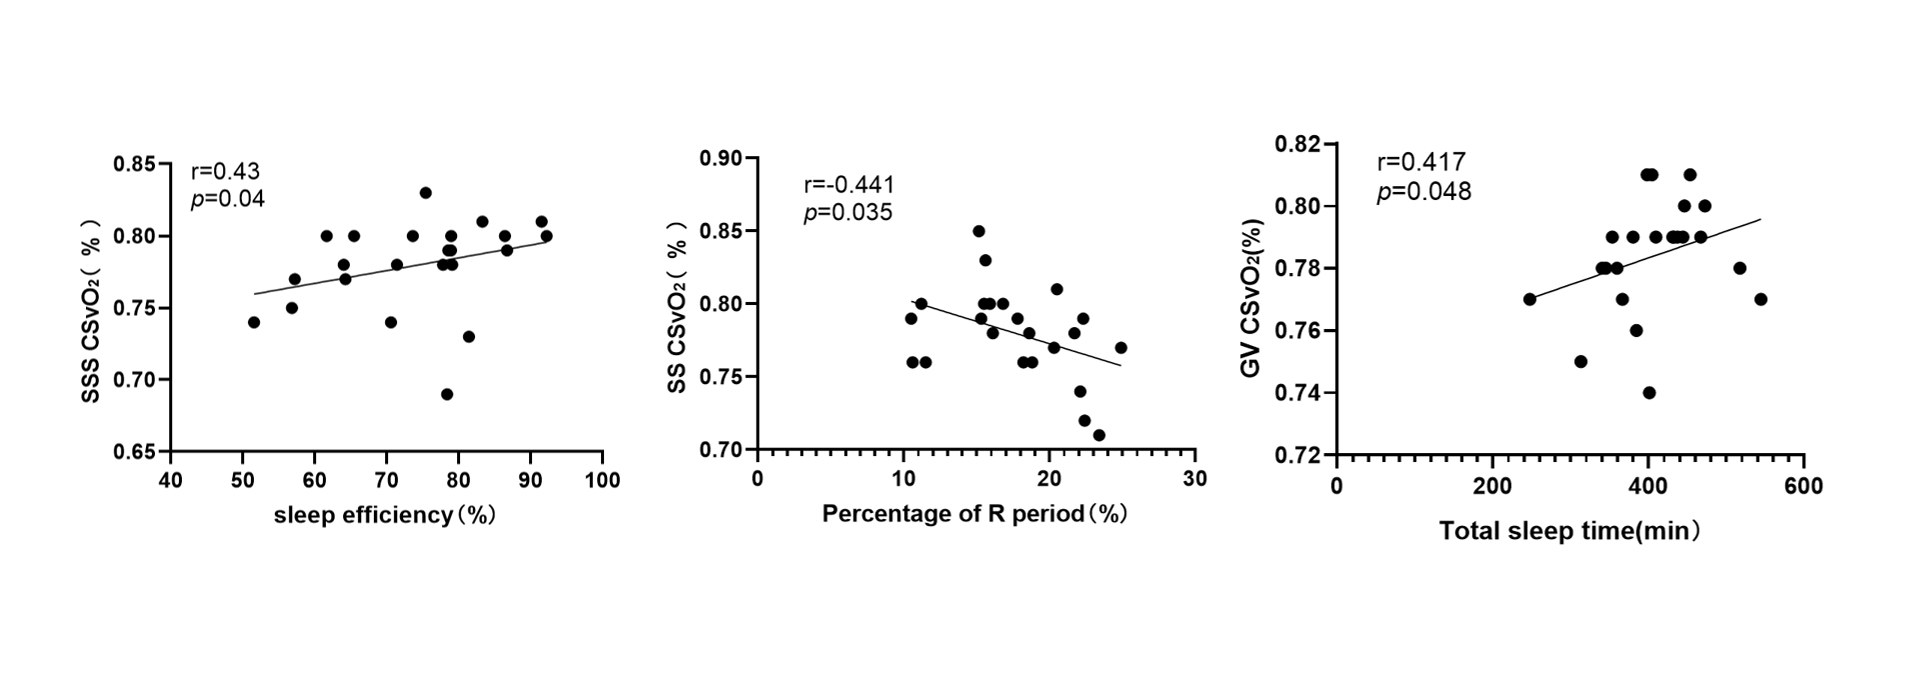
There were statistically significant differences in superior sagittal sinus CSvO2 (SSS CSvO2), straight sinus CSvO2 (SS CSvO2) and average CSvO2 between the insomnia group and healthy controls (p>0.05) (Figure 2).In insomnia patients, SSS CSvO2 was positively correlated with sleep efficiency (r=0.43, p=0.04), SS CSvO2 was negatively correlated with R-phase occupancy (r=-0.441, p=0.035), and cerebral great vein CSvO2 (GV CSvO2) was positively correlated with total sleep time (r=0.417, p=0.048); SSS CSvO2, SS CSvO2, GV CSvO2 and average CSvO2 were not statistically different from other indicators of PSG (p>0.05) (Figure 3).Discussion and Conclusions
In this study, the SSS CSvO2 value, the SS CSvO2 value and the average CSvO2 value of the insomnia group were reduced compared with the control group, indicating that cerebral oxygen metabolism in the cerebral cortex and deep structures of the insomnia patients was reduced, which was inferred to be possible that the function of certain brain areas was impaired and metabolism was reduced.This is consistent with the results of some previous PET studies[5, 6].In patients with insomnia, SSS CSvO2 was positively correlated with sleep efficiency, and GV CSvO2 was positively correlated with total sleep time, suggesting that the poorer the quality of sleep, the lower the cerebral oxygen metabolism , which may impair the function of certain brain regions. SS CSvO2 was negatively correlated with the percentage of R phase in the sleep cycle, and a decrease in the percentage of R phase increase the metabolism of some deep brain structures and make them function actively.In conclusion, insomnia patients have reduced cerebral oxygen metabolism due to low sleep efficiency, decreased R-phase occupancy and shortened total sleep time, which may be associated with damage to certain functional brain regions.Acknowledgements
No acknowledgement found.References
[1] International Classification of Sleep Disorders . 3rd ed. [J].American Academy of Sleep Medicine 2014.
[2] Van Someren E J W. Brain mechanisms of insomnia: new perspectives on causes and consequences [J]. Physiol Rev, 2021, 101(3): 995-1046.
[3] Vinayagamani S, Sheelakumari R, Sabarish S, et al. Quantitative Susceptibility Mapping: Technical Considerations and Clinical Applications in Neuroimaging [J]. J Magn Reson Imaging, 2021, 53(1): 23-37.
[4] Fothergill A, Birkl C, Kames C, et al. The Effects of Wearing a 3-Ply or KN95 Face Mask on Cerebral Blood Flow and Oxygenation [J]. J Magn Reson Imaging, 2023, 57(6): 1696-1701.
[5] Kay D B, Karim H T, Soehner A M, et al. Sleep-Wake Differences in Relative Regional Cerebral Metabolic Rate for Glucose among Patients with Insomnia Compared with Good Sleepers [J]. Sleep, 2016, 39(10): 1779-1794.
[6] Kay D B, Karim H T, Hasler B P, et al. Impact of acute sleep restriction on cerebral glucose metabolism during recovery non-rapid eye movement sleep among individuals with primary insomnia and good sleeper controls [J]. Sleep Med, 2019, 55(81-91).
Figures