1734
Correlation of cortical gray/white matter ratio and body mass index (BMI) in controls and major depression patients scanned with 7T MRI1Radiology, Icahn School of Medicine at Mount Sinai, New York, NY, United States, 2Biomedical Engineering & Imaging Institute, Icahn School of Medicine at Mount Sinai, New York, NY, United States
Synopsis
Keywords: Psychiatric Disorders, High-Field MRI, Major Depression, Body Mass Index, Gray/White Matter Ratio
Motivation: Better understand the relationship between depression, obesity and the brain.
Goal(s): Investigate the relationship between body mass index and brain gray and white matter volumes using high-resolution 7T MRI in a population of healthy controls and major depression patients.
Approach: T1-weighted MRI was obtained at 7T and segmented using FreeSurfer. 44 MDD patients and 47 healthy controls of comparable age and body mass index (BMI) were scanned.
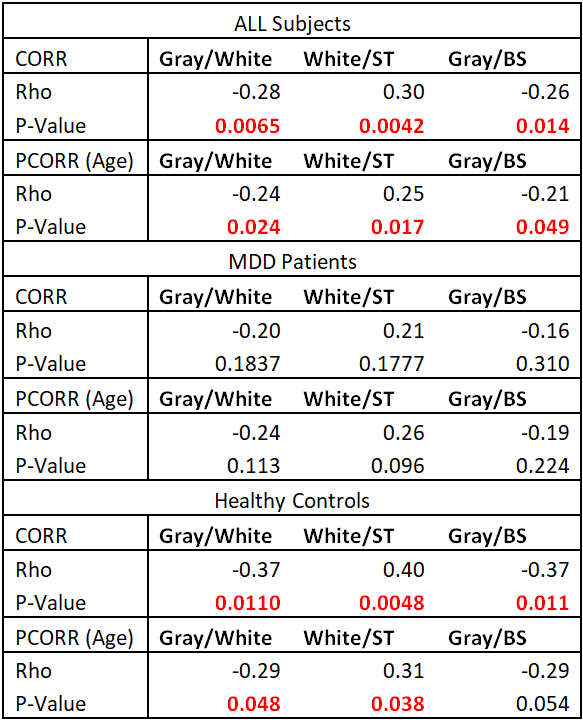
Results: BMI showed significant positive correlation with white matter volume and negative correlation between gray matter volume and gray/white ratios in healthy controls and combined cohorts. Similar, though non-significant trends were observed in MDD patients.
Impact: The presented study is the first to ultrahigh field MRI to detect significant correlations between BMI and gray/white matter brain volumes. Differences in these correlations were observed between MDD patients and healthy controls.
Introduction
From 2000 to 2020, prevalence of obesity grew from 30.5% to 41.9%, making it amongst the costliest diseases in the US. Obesity may be a risk factor for diseases including heart disease and cognitive impairments. Major depression is among the most common mental disorders, with a lifetime risk of 12%. Both diseases are risk factors for each other, and common anti-depressant treatments such as selective serotonin reuptake inhibitors (SSRIs) or monamine oxidase inhibitors (MAOIs) carry increased risk for weight gain. High resolution magnetic resonance (MRI) at ultrahigh field may better characterize the effects of MDD and obesity on brain physiology and morphology. We investigated the relationship between brain gray and white matter ratios and body mass index (BMI) in the presence and absence of major depressive disorder.Materials & Methods
T1-weighted MPRAGE imaging was acquired from forty-four MDD patients (17F/27M, 37.6±11.6 years, 25.3±5.1 BMI) and forty-seven healthy controls (20F/27M, 36.4±10.7 years, 25.4±5.2 BMI). Patients were clinically assessed for depression by a psychiatrist and screened against substance abuse and current antidepressant treatment. Scan parameters included: TE/TR=3.62/6000ms, field-of-view=224x168 mm3, array size=320x240x240, voxel size=0.7mm3 isotropic, 7:26min. All scans were acquired with a Siemens 7T whole-body MRI scanner and a 32-channel Nova head coil. Images were automatically segmented using the FreeSurfer 6.0 algorithm, which parcellated the cortex into 34 regions-of-interest (ROIs) per hemisphere. Three whole-brain ratios were also obtained consisting of total gray matter / white matter ratio (G/W), cerebral white matter / supratentorial volume (W/ST) and total gray matter / brain segmentation volume (G/BS). Because FreeSurfer segmented total gray matter but cerebral white matter, comparable brain volumes were selected in assessing whole-brain composition (supratentorial and brain segmentation volumes, respectively). Complete correlations and partial correlation with age as a covariate were performed between BMI and the 68 cortical ROIs and three whole-brain metrics.Results
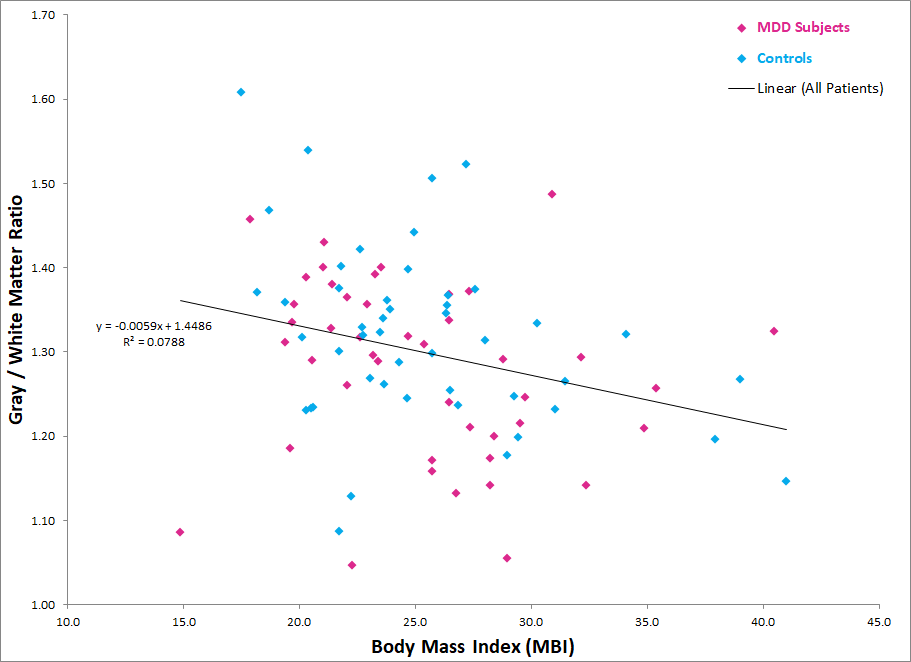
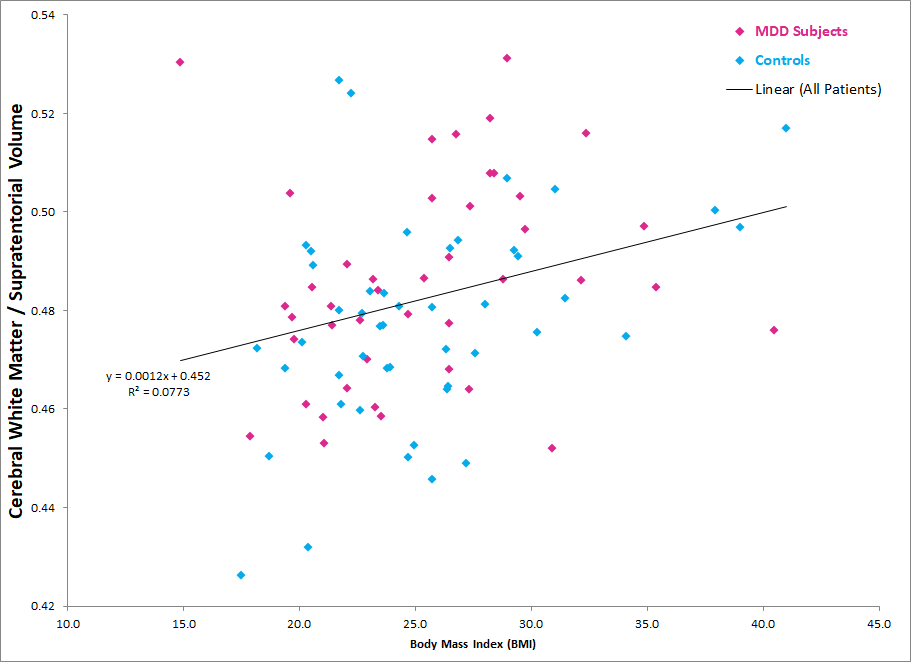
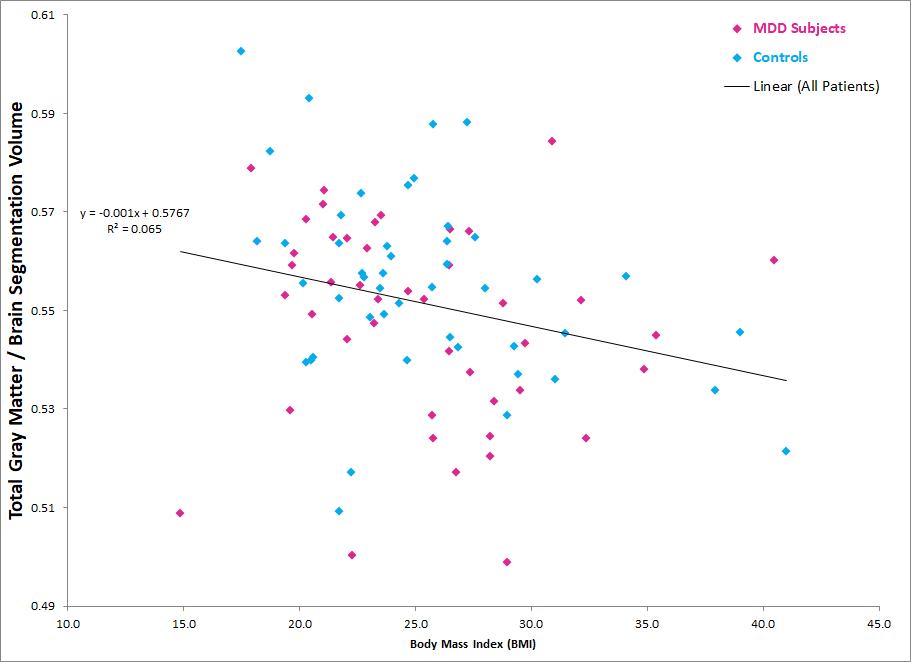
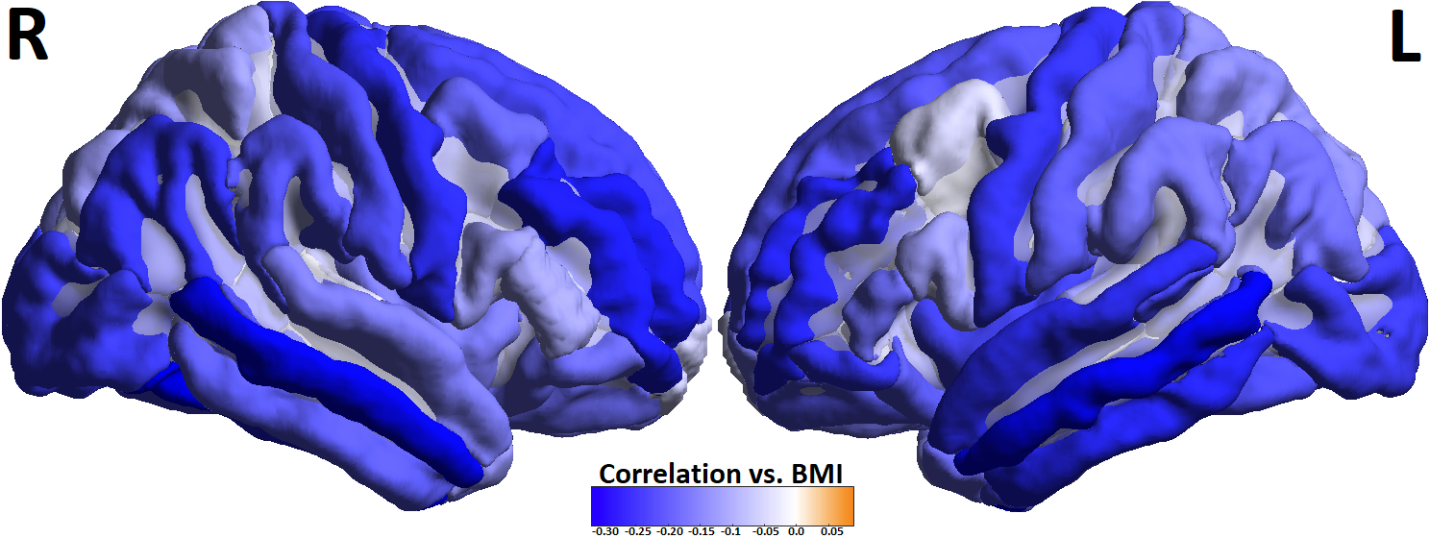
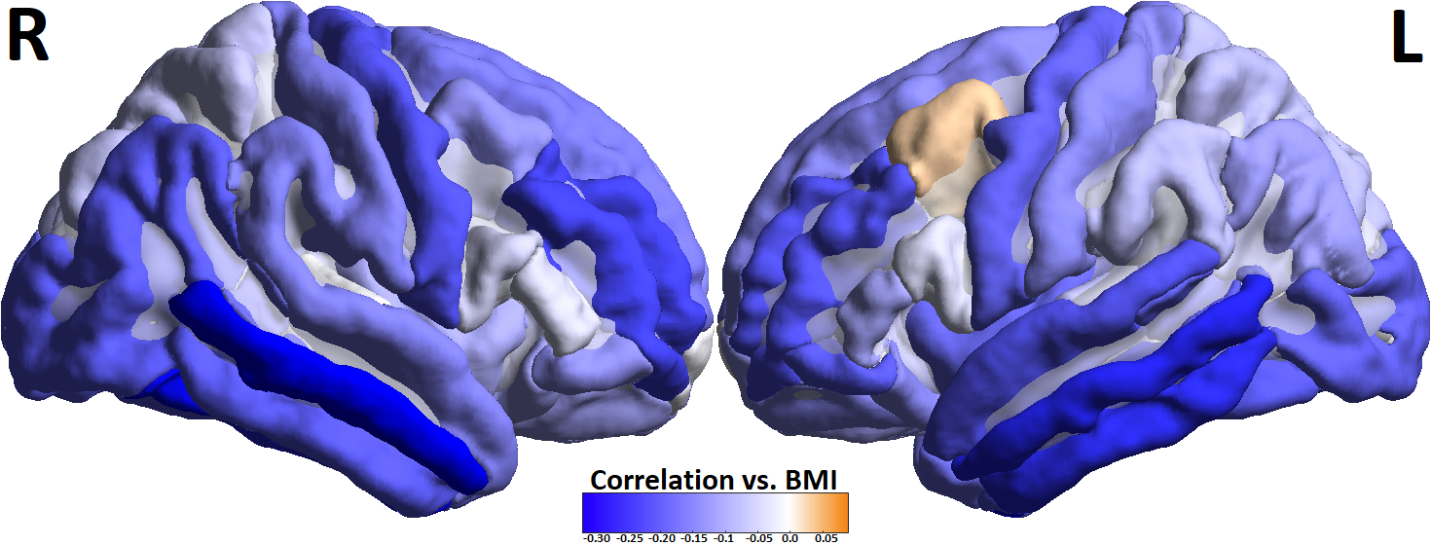
BMI was found to be significantly negatively correlated with G/W and G/BS ratios, and significantly positively correlated with W/ST ratio when evaluated among healthy controls and the combined control and MDD patient cohort. These correlations were not significant when evaluated among the MDD patient cohort alone. Table 1 shows rho and p-values for the three whole-brain comparisons for all subjects, MDD-only cohort and healthy control cohort. All three of the whole-brain metrics tested showed significant correlation with BMI with and without covariation for age. Correlation between age and BMI across all subjects showed r=0.17 with p=0.11.Figures 1-3 show distributions of gray/white matter ratio, white matter / supratentorial volume and gray matter / brain segmentation volume, respectively amongst patients (blue) and controls (pink). Figures 4 and 5 shows volumetric maps of complete correlation and partial correlation with age covariation between cortical gray/white matter ratios and BMI. With complete correlations twenty-five of the 68 cortical ROIs showed significantly negative correlation with BMI. With partial correlations, seven of the 68 cortical ROIs showed significantly negative correlation with BMI. The trend in correlations was largely negative in both analyses and no ROIs showed significantly positive correlation with age.
Discussion
Previous research investigating the relationship between BMI and white matter composition has shown negative correlation between BMI and gray matter volumes. Haltia et al. showed positive correlation between waist-to-hip ratio and white matter volume that was partially reversed by dieting. A UK Biobank study of over 12000 participants found trends of negative correlation between total body fat and gray matter volume and positive correlation between total body fat and white matter volume. Neuroinflammatory changes associated with obesity and high-fat diets may help explain the link between BMI and overall brain structure. These correlations may also implicate loss in gray matter volume as a contributing factor to obesity and depression. Investigation into why BMI showed correlation to gray/white matter ratio among controls, but not MDD patients must account for contributing effects of MDD-related eating disorders and treatment side effects. Disordered eating may be a feature of MDD, and some of the most-prescribed treatments for MDD list weight gain among the most common side effects.Acknowledgements
The authors would like to acknowledge funding from the following grants:
NIH R01 MH109544
NARSAD Young Investigator
References
1. Haltia LT, Viljanen A, Parkkola R, Kemppainen N, Rinne JO, Nuutila P, Kaasinen V. Brain white matter expansion in human obesity and the recovering effect of dieting. The Journal of Clinical Endocrinology & Metabolism. 2007 Aug 1;92(8):3278-84.
2. Dekkers IA, Jansen PR, Lamb HJ. Obesity, brain volume, and white matter microstructure at MRI: a cross-sectional UK Biobank study. Radiology. 2019 Jun;291(3):763-71.
3. Ou X, Andres A, Pivik RT, Cleves MA, Badger TM. Brain gray and white matter differences in healthy normal weight and obese children. Journal of Magnetic Resonance Imaging. 2015 Nov;42(5):1205-13.
4. Ward MA, Carlsson CM, Trivedi MA, Sager MA, Johnson SC. The effect of body mass index on global brain volume in middle-aged adults: a cross sectional study. BMC neurology. 2005 Dec;5:1-7.
Figures