1728
Neurochemical Correlates of PTSD Severity: Insights from ACC and Hippocampal Metabolite Analysis1Purdue University, West Lafayette, IN, United States, 2Athinoula A. Martinos Center for Biomedical Imaging, Institute for Innovation in Imaging, Massachusetts General Hospital and Harvard Medical School, Boston, MA, United States, 3Purdue University Northwest, Hammond, IN, United States
Synopsis
Keywords: Psychiatric Disorders, Brain, Post-traumatic Stress Disorder
Motivation: Neurochemical alterations in PTSD are well-researched across various brain regions, yet understanding their connection to symptoms remains unexplored.
Goal(s): Our aim was to determine the association between the neurochemical profile and emotional/cognitive symptoms in diagnosed PTSD individuals and healthy controls.
Approach: Participants underwent an MRS scan and CNS Vital Signs survey. Correlations between metabolites and survey scores were examined.
Results: We found significant differences across several PTSD symptoms, for which the severity correlated with metabolite levels alterations in the ACC and hippocampus.
Impact: By understanding correlation between neurochemical alternations and clinical symptom severity, this study provides valuable insights into the pathways of PTSD. It paves the way for innovative approaches in managing neurological disorders.
Introduction
Post-traumatic stress disorder (PTSD) includes persistent emotional response to traumatic stimuli in environments where a threat is no longer present. Exposure to strong stressors can trigger chronic disruption to motor, emotional, and cognitive function. Clinically, PTSD manifests in four clusters of symptoms: flashbacks, avoidance of stimuli associated with the trauma, mood changes, hyperactivity and hyperarousal that persist when no direct threat is present. Long-term effects include residual psychological and cognitive impairment, substance abuse, and suicide risk.1 Because exposure to trauma does not always lead to PTSD, it is important to understand what happens in the brain physiology.1 Neuroimaging studies have reported structural and functional changes in the anterior cingulate cortex (ACC), hippocampus, amygdala, and insula of patients with PTSD.2–6 Certain brain regions are closely related to the underlying PTSD symptoms, including anterior cingulate cortex (ACC) which registers physical pain and emotional awareness, while the hippocampus (hippo) regulates memory consolidation.2,7 We have previously found significant differences in multiple metabolites, including glutamate-glutamine (Glx), creatine (Cr), choline (tCho), gamma-aminobutyric acid (GABA), and glutathione (GSH) across these brain regions of interest.[abstract #179, ISMRM 2023] However the relationship between these biochemical changes and severity of PTSD symptoms remains unclear. The purpose of this study is to evaluate the relationship between the neurochemical profile and emotional and cognitive symptoms of PTSD in the clinically diagnosed population compared to healthy controls.Methods
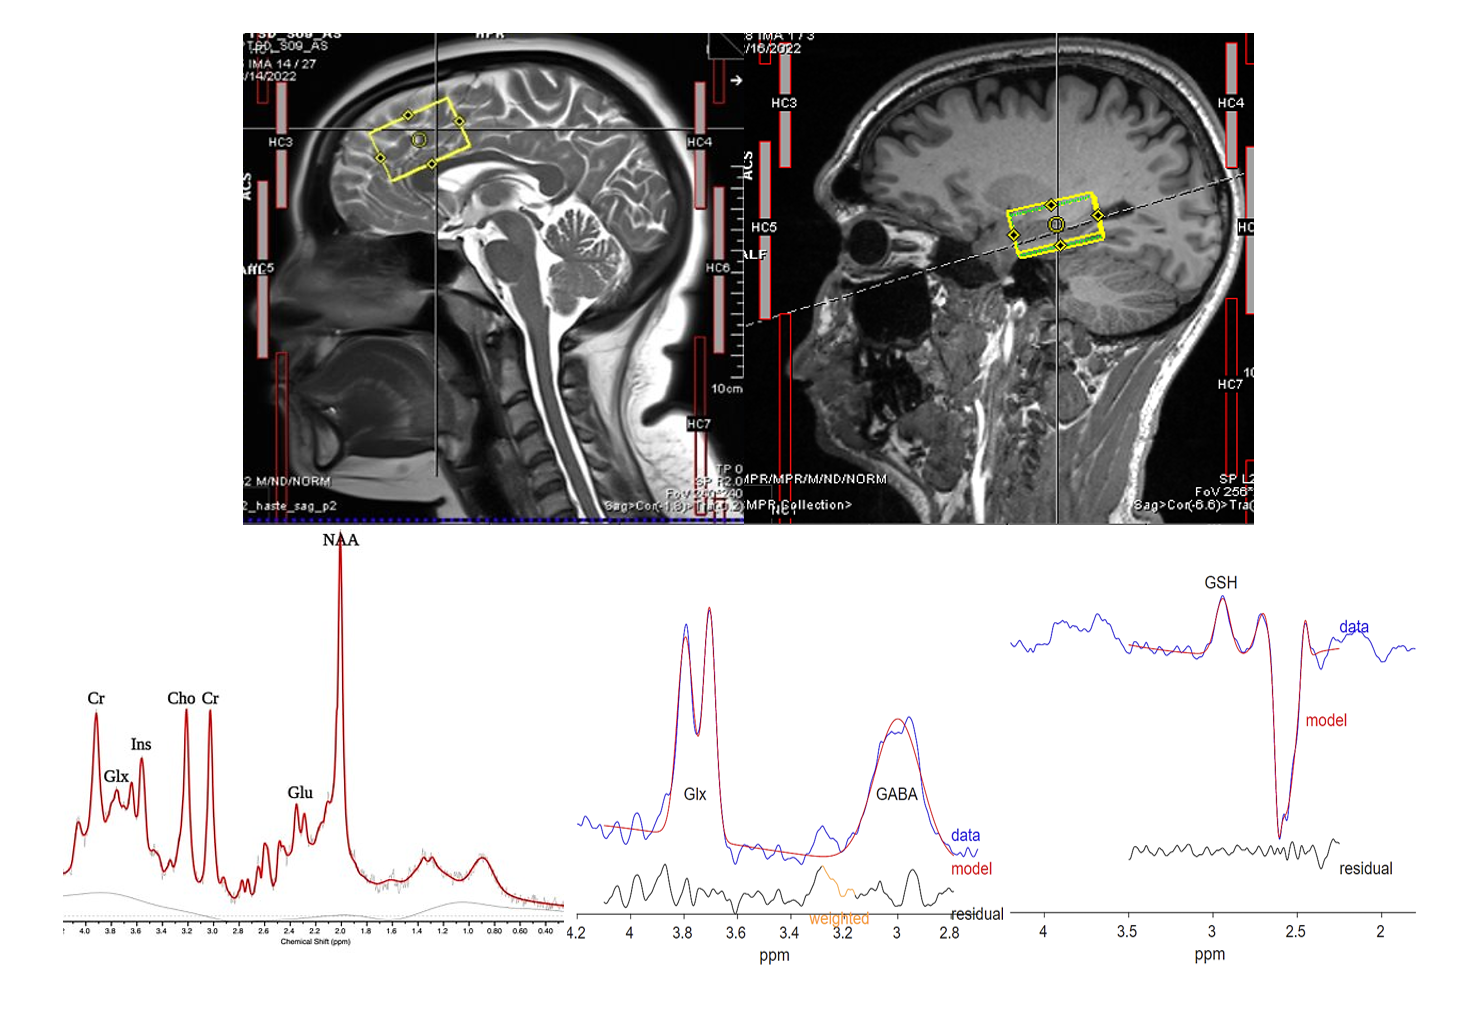
Ten participants diagnosed with PTSD (8 males, 2 females, age: 33.9±8.2) and ten healthy age and gender matched controls (8 males, 2 females, age: 33.5±8.5) underwent a brain scan on a 3T Siemens MAGNETOM Prisma MRI scanner using a 64-channel receiver head coil. Two brain regions (ACC, hippo) have been investigated using edited and unedited MRS. Unedited MRS was obtained using Point RESolved Spectroscopy (PRESS)8 using TE/TR:30/2000ms, 64 averages, and VOI:40x25x27mm3. PRESS was chosen to better match the localization used in edited MRS. Edited MRS was acquired using Hadamard Encoding and Reconstruction of MEGA-Edited Spectroscopy (HERMES)9 with TE/TR:80/2000ms, 256 averages, and VOI:40x25x27mm3 (Figure 1). All unedited MRS was processed using Osprey10 and quantified with LCModel,11 while GABA and GSH, obtained from edited MRS were quantified using Gannet.12 All participants were also administered a CNS Vital Signs13 questionnaire to assess psychological and cognitive severity of PTSD symptoms. The following tests were included: Verbal Memory, Visual Memory, Reaction Time, Alcohol Use Disorders Id Test, Depression, Anxiety, Stress, Drug Use, Epworth Sleepiness Scale, Fatigue, Emotional Wellbeing, Social Functioning, and Pain. Group differences were determined with unpaired t-Test of equal variance. Spearman correlations, with α=0.05 significance level, were run between CNSVS standard scores and brain metabolites. All statistical analyses were performed in R-studio.Results
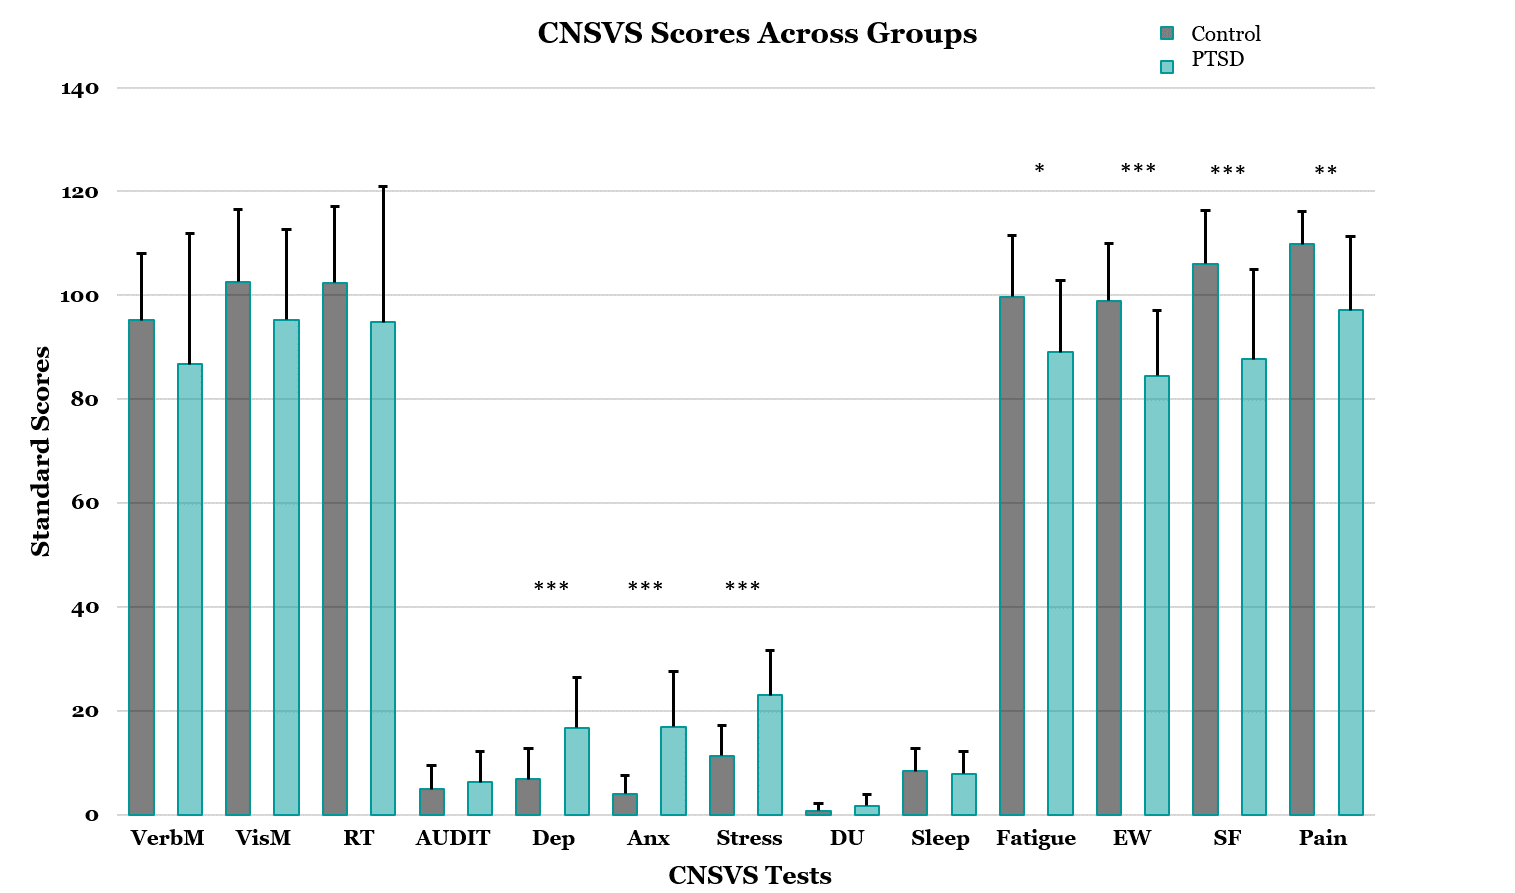
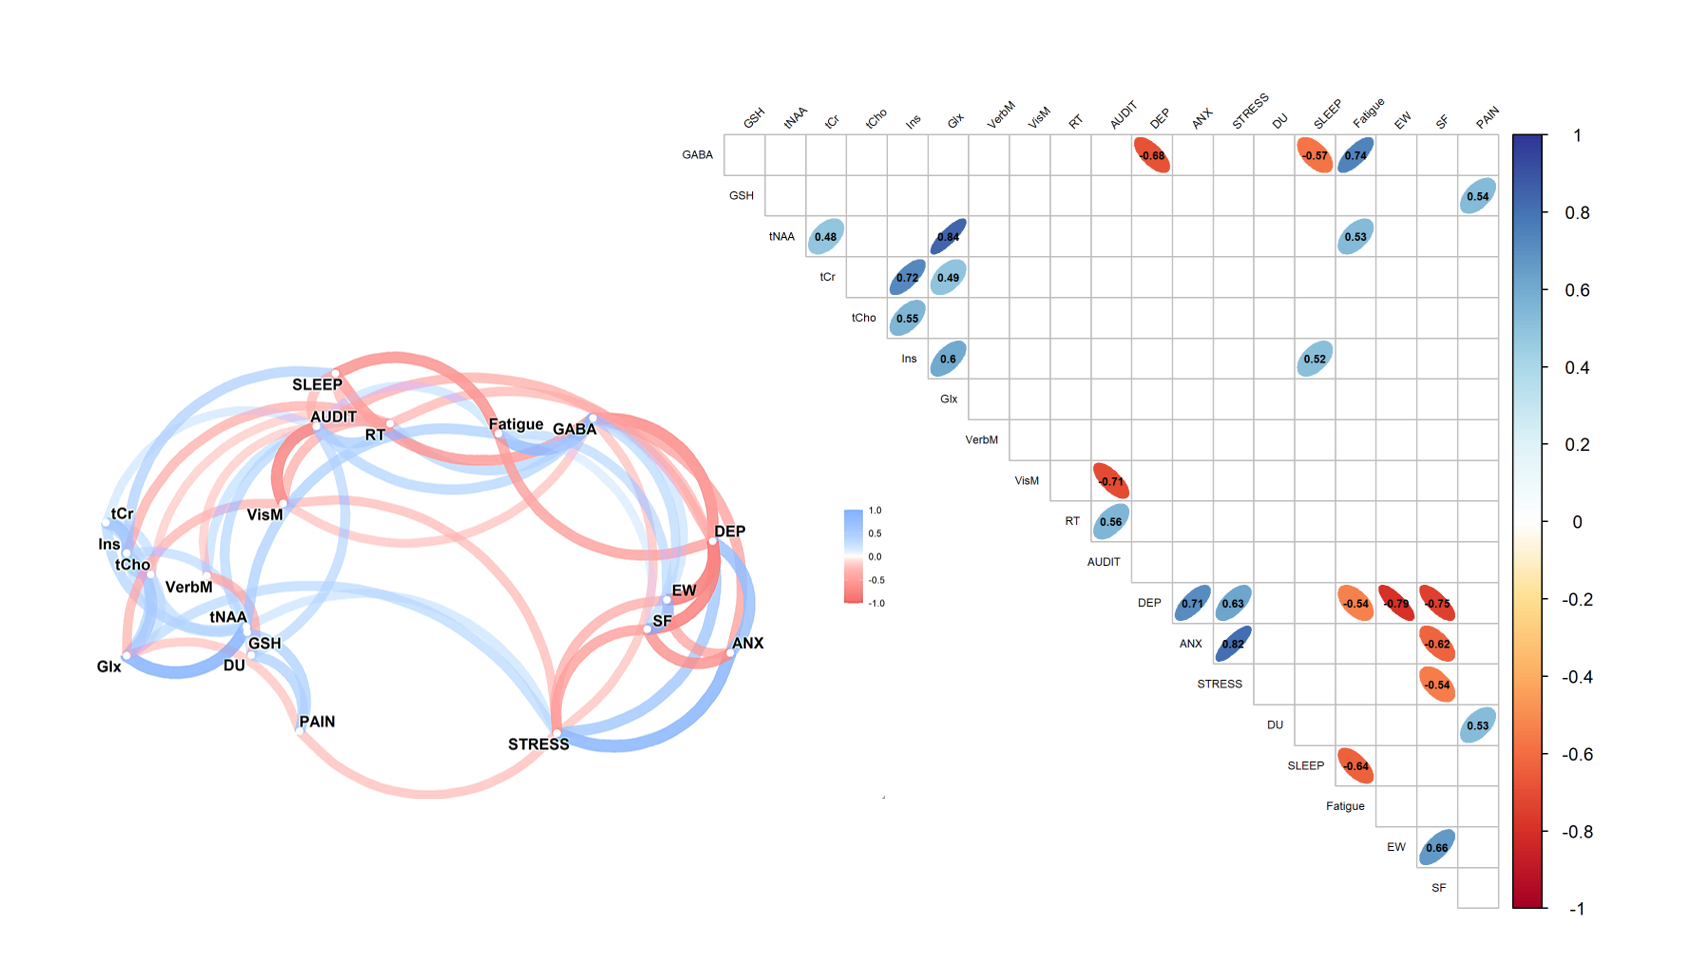
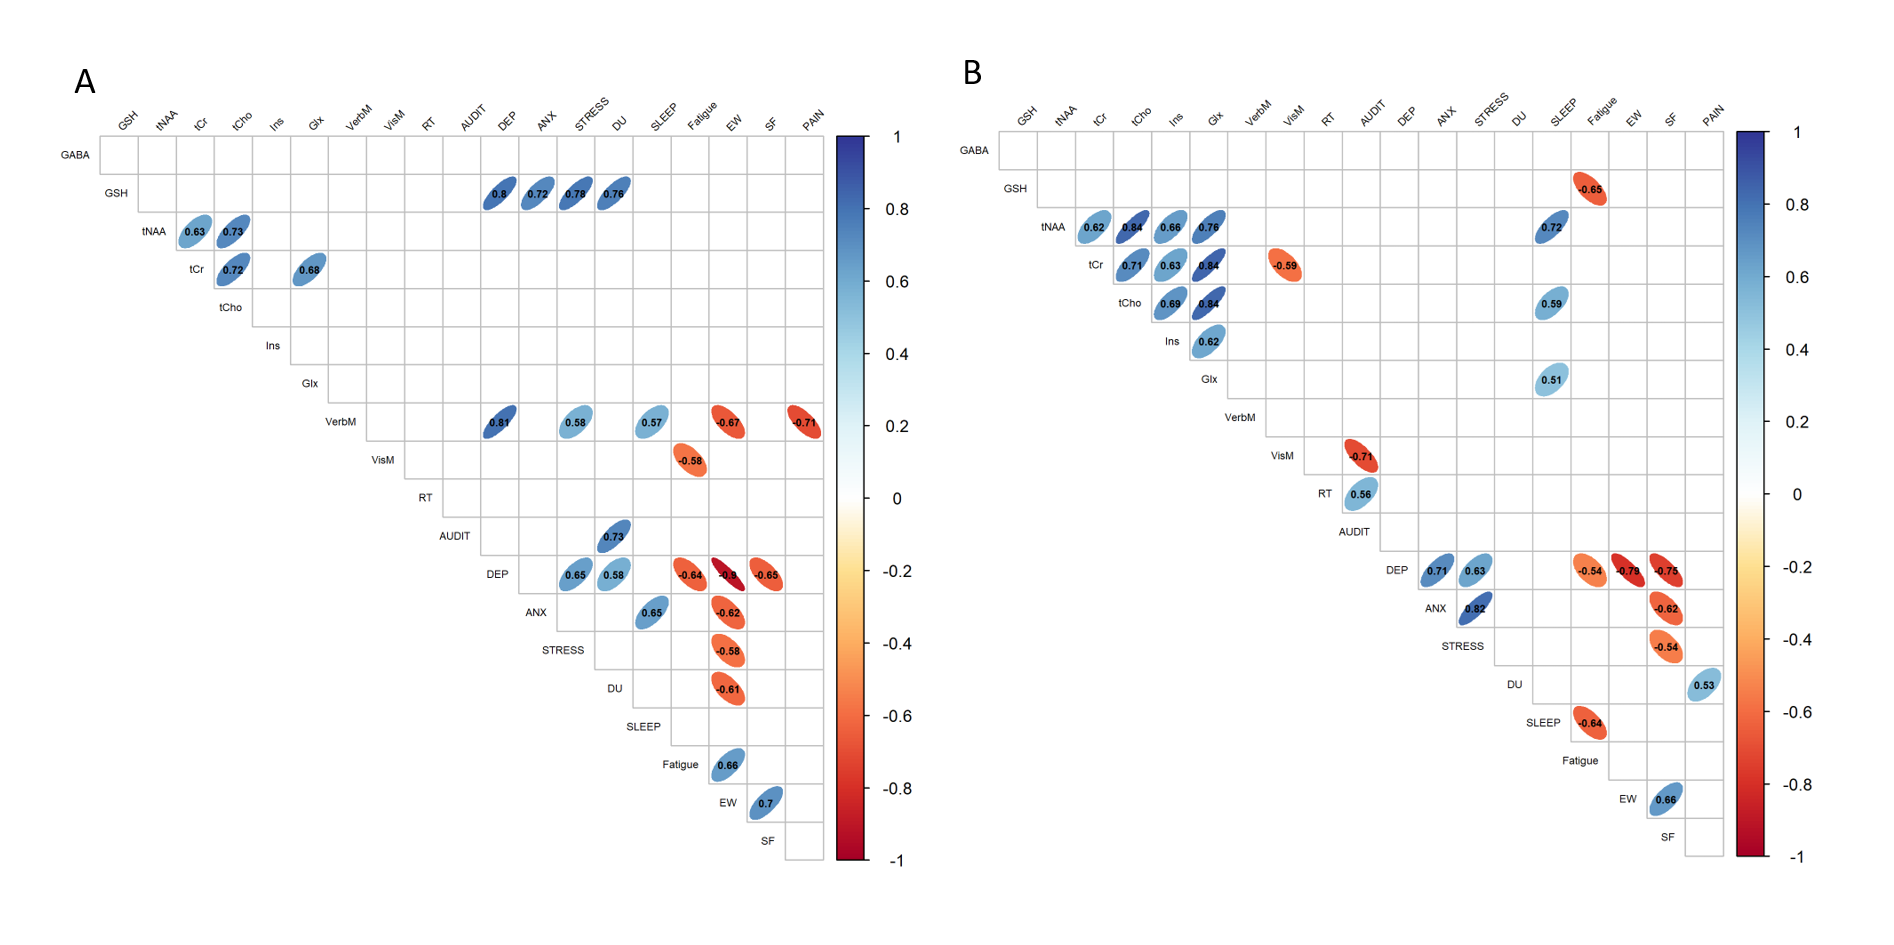
Participants diagnosed with PTSD exhibited significantly higher depression, anxiety, and stress scores, coupled with lower scores for fatigue, emotional wellness, social functioning, and pain (Figure 2). Notably, in the ACC, significant correlations emerged between GABA and depression (p=0.007), sleep (p=0.03), and fatigue (p=0.002), as well as between GSH and pain (p=0.03) among those with diagnosed PTSD, as shown in Figure 3. Conversely, the control group exhibited only one significant correlation—between ACC GABA and social functioning (p=0.04). In the hippo of participants with PTSD, GSH exhibited negative correlations with fatigue (p=0.009), while sleep correlated positively with tNAA (p=0.001), tCr (p=0.01), and Glx (p=0.04). Surprisingly, in the control group's hippo, GSH positively correlated with depression (p=0.003), anxiety (p=0.01), stress (p=0.005), and drug use (p=0.004), as illustrated in Figure 4.Discussion and Conclusion
We have demonstrated notable differences in CNS Vital Sign scores between the control group and the PTSD group. Elevated depression, anxiety, and stress scores in PTSD indicate heightened symptom severity, while lower scores in fatigue, emotional wellness, social functioning, and pain indicate decreased energy levels, poor emotional wellness and willingness to interact in social setting, and more experienced pain. Negative correlations between GABA and depression/sleep imply that reduced ACC GABA associates with heightened depression and sleep issues. Conversely, positive correlations, such as ACC GABA-fatigue, GSH-pain, tNAA-fatigue, and Ins-sleep, suggest that increased metabolite levels align with elevated symptoms. Positive correlations between sleep and hippocampal tNAA, tCho, and Glx indicate that higher metabolite levels lead to increased sleeplessness. The negative GSH-fatigue correlation may indicate decreased energy with rising oxidative stress. Notably, control group correlations, especially GSH with depression, anxiety, stress, and drug use, reveal that GSH is intricately involved in the manifestation of such mood symptoms, even if they are transient.Acknowledgements
Purdue University Northwestern Interdisciplinary Grant; Purdue University Northwestern Catalyst Grant; NIH S10 OD012336;References
1. Yehuda R, Hoge CW, Mcfarlane AC, et al. Post-traumatic stress disorder. Nat Rev Dis Prim. 2015;1(1):1-22. doi:10.1038/nrdp.2015.57
2. Michels L, Schulte-Vels T, Schick M, et al. Prefrontal GABA and glutathione imbalance in posttraumatic stress disorder: Preliminary findings. Psychiatry Res Neuroimaging. 2014;224(3):288-295. doi:10.1016/J.PSCYCHRESNS.2014.09.007
3. Meyerhoff DJ, Mon A, Metzler T, Neylan TC. Cortical Gamma-Aminobutyric Acid and Glutamate in Posttraumatic Stress Disorder and Their Relationships to Self-Reported Sleep Quality. Sleep. 2014;37(5):893. doi:10.5665/SLEEP.3654
4. Rosso IM, Weiner MR, Crowley DJ, Silveri MM, Rauch SL, Jensen JE. Insula and anterior cingulate GABA levels in post-traumatic stress disorder: Preliminary findings using magnetic resonance spectroscopy. Depress Anxiety. 2014;31(2):115. doi:10.1002/DA.22155
5. Yan X, Brown AD, Lazar M, et al. Spontaneous brain activity in combat related PTSD. Neurosci Lett. 2013;547:1-5. doi:10.1016/J.NEULET.2013.04.032
6. Bromis K, Calem M, Reinders AATS, Williams SCR, Kempton MJ. Meta-Analysis of 89 Structural MRI Studies in Posttraumatic Stress Disorder and Comparison With Major Depressive Disorder. Am J Psychiatry. 2018;175(10):989. doi:10.1176/APPI.AJP.2018.17111199
7. Wang D, Wang X, Luo MT, Li YH, Wang H. Gamma-aminobutyric acid levels in the anterior cingulate cortex of perimenopausal women with depression: A magnetic resonance spectroscopy study. Front Neurosci. 2019;13(JUL):447833. doi:10.3389/FNINS.2019.00785/BIBTEX
8. BOTTOMLEY PA. Spatial Localization in NMR Spectroscopy in Vivo. Ann N Y Acad Sci. 1987;508(1):333-348. doi:10.1111/J.1749-6632.1987.TB32915.X
9. KL, Puts NAJ, Schär M, Barker PB, Edden RAE. HERMES: Hadamard Encoding and Reconstruction of MEGA-Edited Spectroscopy. Magn Reson Med. 2016;76(1):11. doi:10.1002/MRM.26233
10. Oeltzschner G, Zöllner HJ, Hui SCN, et al. Osprey: Open-Source Processing, Reconstruction & Estimation of Magnetic Resonance Spectroscopy Data. J Neurosci Methods. 2020;343:108827. doi:10.1016/J.JNEUMETH.2020.108827
11. Provencher SW. Automatic quantitation of localized in vivo 1H spectra with LCModel. NMR Biomed. 2001;14(4):260-264. doi:10.1002/NBM.698
12. Edden RAE, Puts NAJ, Harris AD, Barker PB, Evans CJ. Gannet: A Batch-Processing Tool for the Quantitative Analysis of Gamma-Aminobutyric Acid–Edited MR Spectroscopy Spectra. J Magn Reson Imaging. 2014;40(6):1445. doi:10.1002/JMRI.24478
13. Gualtieri CT, Johnson LG. Reliability and validity of a computerized neurocognitive test battery, CNS Vital Signs. Arch Clin Neuropsychol. 2006;21(7):623-643. doi:10.1016/J.ACN.2006.05.007
Figures