1727
Exploring connectivity and microstructural recovery following detoxification in individuals suffering from Alcohol Use Disorder1ICTEAM, UCLouvain, Louvain-la-neuve, Belgium, 2IONS, UCLouvain, Brussels, Belgium
Synopsis
Keywords: Psychiatric Disorders, Brain Connectivity, AUD, withdrawal, diffusion, microstructure
Motivation: Alcohol use disorder (AUD) is a widely spread disorder responsible for 6% of global mortality. Alcohol affects a substantial portion of the population in various aspects and part of these changes may be related to brain modifications.
Goal(s): To identify the effects of alcohol withdrawal on the brain and their link with symptom improvement.
Approach: Combination of connectivity matrices and microstructural models based on diffusion MRI tested during withdrawal period.
Results: The study of global brain connectivity revealed six connections, four of which also showed microstructure changes during withdrawal that were beneficial for recovery in areas heavily affected by increased alcohol consumption.
Impact: We presented an exploratory way to evaluate the effects of short-term withdrawal using connectivity and microstructural models based on diffusion MRI. It revealed four brain connections that deserve to be studied in greater depth in the case of this pathology.
Introduction
Alcohol Use Disorder (AUD) is a major concern in our society with up to 3 million deaths every year worldwide1. Besides affecting the patient’s overall mental and physical health, alcohol consumption also induces structural alterations in brain microstructure and connectivity2,3. Diffusion Magnetic Resonance Imaging (dMRI) has proven to be of great interest for observing and quantifying those microstructural changes. It focuses on capturing microscopic water movements within tissues, providing indirect information about surrounding structures. By combining advanced dMRI microstructural models with tractography algorithms, this study aimed to identify regions impacted by short-term alcohol abstinence and to perform microstructural analyses in these areas.Materials and Methods
Data preprocessing52 AUD patients underwent three dMRI scans: first and second scans were performed on the first and last day of a 18 days withdrawal period, while the third one was made three months after. Additionally, 20 healthy adults underwent two dMRI scans 18 days apart. All scans were performed with the following parameters: $$$\text{TR}=4842ms$$$,$$$~\text{TE}=77ms$$$,$$$~2mm~$$$isotropic$$$~$$$voxels,$$$~\Delta=35.7ms$$$,$$$~\delta=22.9ms$$$,$$$~$$$64$$$~$$$gradients$$$~$$$at$$$~b=1000$$$,$$$~$$$32$$$~$$$at$$$~b=2000$$$,$$$~3000$$$,$$$~5000s/mm^2~$$$corresponding to diffusion gradient intensities up to$$$~68.9mT/m~$$$and 7$$$~$$$interspersed b0 images.
The preprocessing steps were brain extraction4, thermal denoising5, Eddy-current and head-motion correction6. A 3D T1 image ( $$$\text{TR}=2188.16ms$$$,$$$~\text{TE}=2.96ms$$$,$$$~\text{TI}=900ms$$$, 156 slices,$$$~1mm~$$$isotropic) was also acquired with each scan. The Desikan-Killiany atlas7 was registered in each patient’s native space with a diffeomorphic registration.
Tract extraction
The msmt-CSD8 algorithm was utilized for the local modeling of the in-vivo data. Whole-brain tractograms composed of 750000 streamlines were obtained with the iFOD29 algorithm and the following parameters: maximum angle of$$$~20°$$$,$$$~$$$step size of$$$~1mm~$$$and cutoff of$$$~0.1$$$. They were then filtered to 500000 streamlines using SIFT10. Connectivity matrices were obtained from filtered tractograms representing all connections between each region pair (Fig.1A) and then normalized.
A statistical Welch’s t-test between all AUD time periods corrected for multiple comparisons with Benjamini-Hochberg was conducted to highlight significant brain connections. In addition to selected connections, tracts from each of the five subdivisions11 of the Corpus Callosum (CC) (see Fig.1B) were incorporated into the analysis, due to their frequent citation in the literature12,13.
Analysis of tract microstructure
Once connections were identified, a microstructural analysis was performed using metric maps (Fig.2) estimated from three models: NODDI14, DIAMOND15 and MF16. For DIAMOND and MF, the signal was estimated with a maximum of$$$~K=2~$$$fixels and with an isotropic compartment. The microstructural properties of both fixels were averaged into a single weighted value$$$~wM~$$$:
$$wM=\frac{\sum^K_kf_k \cdot M_k}{\sum^K_kf_k},$$
where$$$~f_k~$$$and$$$~M_k~$$$are respectively the volume fraction and mean metric value allocated to fixel$$$~k$$$.
Regions of interest (ROI) were created for each tract by selecting voxels crossed by the streamlines. An average microstructural value was then computed for each ROI and metric. A statistical Welch’s t-test corrected for multiple comparisons with Benjamini-Hochberg was conducted to highlight the significant differences between the evolution of both populations throughout the first and second scans.
Results and Discussion
Six connections were found to present significant changes during withdrawal period among all possible connections in AUD patients. From those, four also exhibit significant microstructural changes:- Brain Stem$$$-$$$Caudate Left
- Corpus Callosum Mid Posterior$$$-$$$Cortex Superior Temporal Left
- Cerebellum Cortex Left$$$-$$$Cortex Postcentral Left
- Hippocampus Right$$$-$$$Cortex Inferior Parietal Right
On Fig.3A, we can see that a connection and four CC subdivisions showed significant decrease in$$$~wMD,~$$$accompagnied by a decrease in$$$~wRD~$$$and$$$~wAD$$$, for patients compared to controls. Furthermore, three connections depicted an increase in the fraction of intracellular space$$$~f_{intra}~$$$and total volume fraction of fibers$$$~f_{tot}~$$$inside a voxel (Fig.3B-C). Connections displaying a change in$$$~f_{tot}~$$$have an opposite change in$$$~f_{csf}~$$$(Fig.3D) due to their link:$$$f_{tot}+f_{csf}=1.~$$$These four graphs indicated a general recovery of the impacted brain regions. The combination of those changes could be interpreted as a general decrease of inflammation of the brain areas and an axonal integrity recovery.
Conclusion
The microstructural estimation throughout detoxification period showed an axonal integrity increase in AUD patients compared to controls. The tracts impacted are thought to be at play in the processing of visuospatial information, memory and movement coordination. This supports the hypothesis that short-term withdrawal already has a beneficial effect on the recovery of areas heavily affected. However, this work could be refined by increasing the streamline count, by including the third time period and by comparing it with an equivalent in controls. Nonetheless, this exploratory study suggests the potential of connectivity analyses combined with advanced microstructural modeling for interpreting the biophysical processes involved in AUD.Acknowledgements
No acknowledgement found.References
1. K. Witkiewitz, R. Z. Litten, and L. Leggio, “Advances in the science and treatment of alcohol use disorder,”Science Advances, vol. 5, no. 9, 2019.
2. M. Dupuy and S. Chanraud, “Imaging the addicted brain,” International Review of Neurobiology, p. 1–31,2016.
3. C. Crespi, C. Galandra, N. Canessa, M. Manera, P. Poggi, and G. Basso, “Microstructural damage of white matter tracts connecting large-scale networks is related to impaired executive profile in alcohol use disorder,” NeuroImage: Clinical, vol. 25, p. 102141, 2020.
4. N. Otsu, “A threshold selection method from gray-level histograms,” IEEE Transactions on Systems, Man, and Cybernetics, vol. 9, no. 1, pp. 62–66, 1979.
5. J. Veraart, D. S. Novikov, D. Christiaens, B. Ades-aron, J. Sijbers, and E. Fieremans, “Denoising of diffusion MRI using random matrix theory,” NeuroImage, vol. 142, pp. 394–406, Nov. 2016. 10.1016/j.neuroimage.2016.08.016.
6. J. L. Andersson and S. N. Sotiropoulos, “An integrated approach to correction for off-resonance effects and subject movement in diffusion MR imaging,” NeuroImage, vol. 125, pp. 1063–1078, Jan. 2016. 10.1016/j.neuroimage.2015.10.019.
7. R. S. Desikan, F. S´egonne, B. Fischl, B. T. Quinn, B. C. Dickerson, D. Blacker, R. L. Buckner, A. M. Dale, R. P. Maguire, B. T. Hyman, M. S. Albert, and R. J. Killiany, “An automated labeling system for subdividing the human cerebral cortex on MRI scans into gyral based regions of interest,” NeuroImage, vol. 31, pp. 968– 980, July 2006.
8. B. Jeurissen, J.-D. Tournier, T. Dhollander, A. Connelly, and J. Sijbers, “Multi-tissue constrained spherical deconvolution for improved analysis of multi-shell diffusion MRI data,” NeuroImage, vol. 103, pp. 411–426, Dec. 2014.
9. J.-D. Tournier, F. Calamante, and A. Connelly, “Improved probabilistic streamlines tractography by 2nd order integration over fibre orientation distributions,” Proc. Intl. Soc. Mag. Reson. Med. (ISMRM), vol. 18, Jan. 2010.
10. R. E. Smith, J.-D. Tournier, F. Calamante, and A. Connelly, “SIFT: Spherical-deconvolution informed filtering of tractograms,” NeuroImage, vol. 67, pp. 298–312, Feb. 2013.
11. S. Hofer and J. Frahm, “Topography of the human corpus callosum revisited—Comprehensive fiber tractography using diffusion tensor magnetic resonance imaging,” NeuroImage, vol. 32, no. 3, pp. 989–994, 2006.
12. S. De Santis, P. Bach, L. Pérez-Cervera, A. Cosa-Linan, G. Weil, S. Vollstädt-Klein, D. Hermann, F. Kiefer, P. Kirsch, R. Ciccocioppo, and et al., “Microstructural white matter alterations in men with alcohol use disorder and rats with excessive alcohol consumption during early abstinence,” JAMA Psychiatry, vol. 76, no. 7, p. 749, 2019.
13. E. González-Reimers, C. Martín-González, L. Romero-Acevedo, G. Quintero-Platt, E. Gonzalez-Arnay, and F. Santolaria-Fernández, “Effects of alcohol on the corpus callosum,” Neuroscience of Alcohol, p. 143–152, 2019.
14. H. Zhang, T. Schneider, C. A. Wheeler-Kingshott, and D. C. Alexander, “NODDI: Practical in vivo neurite orientation dispersion and density imaging of the human brain,” NeuroImage, vol. 61, pp. 1000–1016, July 2012.
15. B. Scherrer, A. Schwartzman, M. Taquet, M. Sahin, S. P. Prabhu, and S. K. Warfield, “Characterizing brain tissue by assessment of the distribution of anisotropic microstructural environments in diffusion-compartment imaging (DIAMOND): Characterizing Brain Tissue with DIAMOND,” Magnetic Resonance in Medicine, vol. 76, pp. 963–977, Sept. 2016.
16. G. Rensonnet, B. Scherrer, G. Girard, A. Jankovski, S. K. Warfield, B. Macq, J.-P. Thiran, and M. Taquet, “Towards microstructure fingerprinting: Estimation of tissue properties from a dictionary of monte carlo diffusion MRI simulations,” vol. 184, pp. 964–980.
17. Driscoll ME, Bollu PC, Tadi P. Neuroanatomy, Nucleus Caudate. In: StatPearls. StatPearls Publishing, Treasure Island (FL); 2022. PMID: 32491339.
18. Erin D. Bigler , Sherstin Mortensen , E. Shannon Neeley , Sally Ozonoff , Lori Krasny , Michael Johnson , Jeffrey Lu , Sherri L. Provencal , William McMahon & Janet E. Lainhart (2007) Superior Temporal Gyrus, Language Function, and Autism, Developmental Neuropsychology, 31:2, 217-238, DOI: 10.1080/87565640701190841
19. DiGuiseppi J, Tadi P. Neuroanatomy, Postcentral Gyrus. 2023 Jul 24. In: StatPearls [Internet]. Treasure Island (FL): StatPearls Publishing; 2023 Jan–. PMID: 31751015.
20. Bareham CA, Georgieva SD, Kamke MR, Lloyd D, Bekinschtein TA, Mattingley JB. Role of the right inferior parietal cortex in auditory selective attention: An rTMS study. Cortex. 2018 Feb;99:30-38. doi: 10.1016/j.cortex.2017.10.003. Epub 2017 Oct 16. PMID: 29127879.
21. Ezzati A, Katz MJ, Zammit AR, Lipton ML, Zimmerman ME, Sliwinski MJ, Lipton RB. Differential association of left and right hippocampal volumes with verbal episodic and spatial memory in older adults. Neuropsychologia. 2016 Dec;93(Pt B):380-385. doi: 10.1016/j.neuropsychologia.2016.08.016. Epub 2016 Aug 16. PMID: 27542320; PMCID: PMC5154822.
Figures
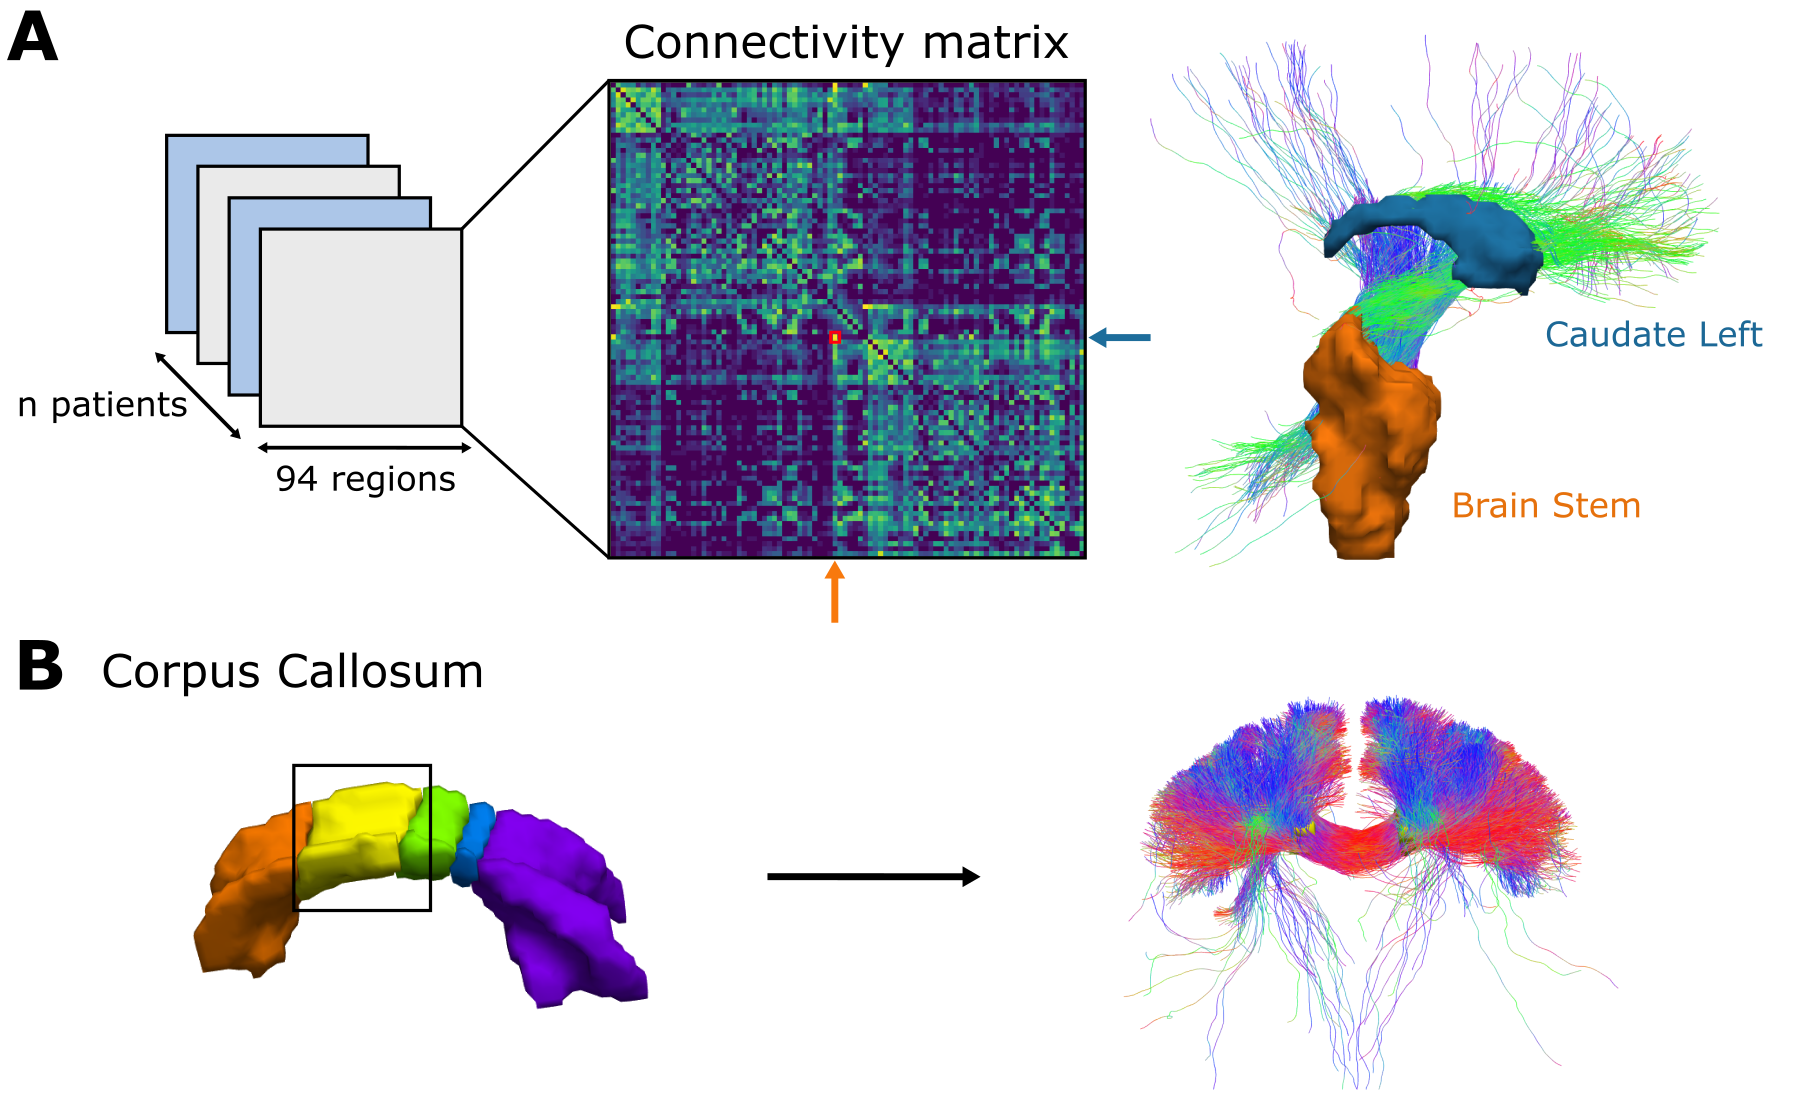
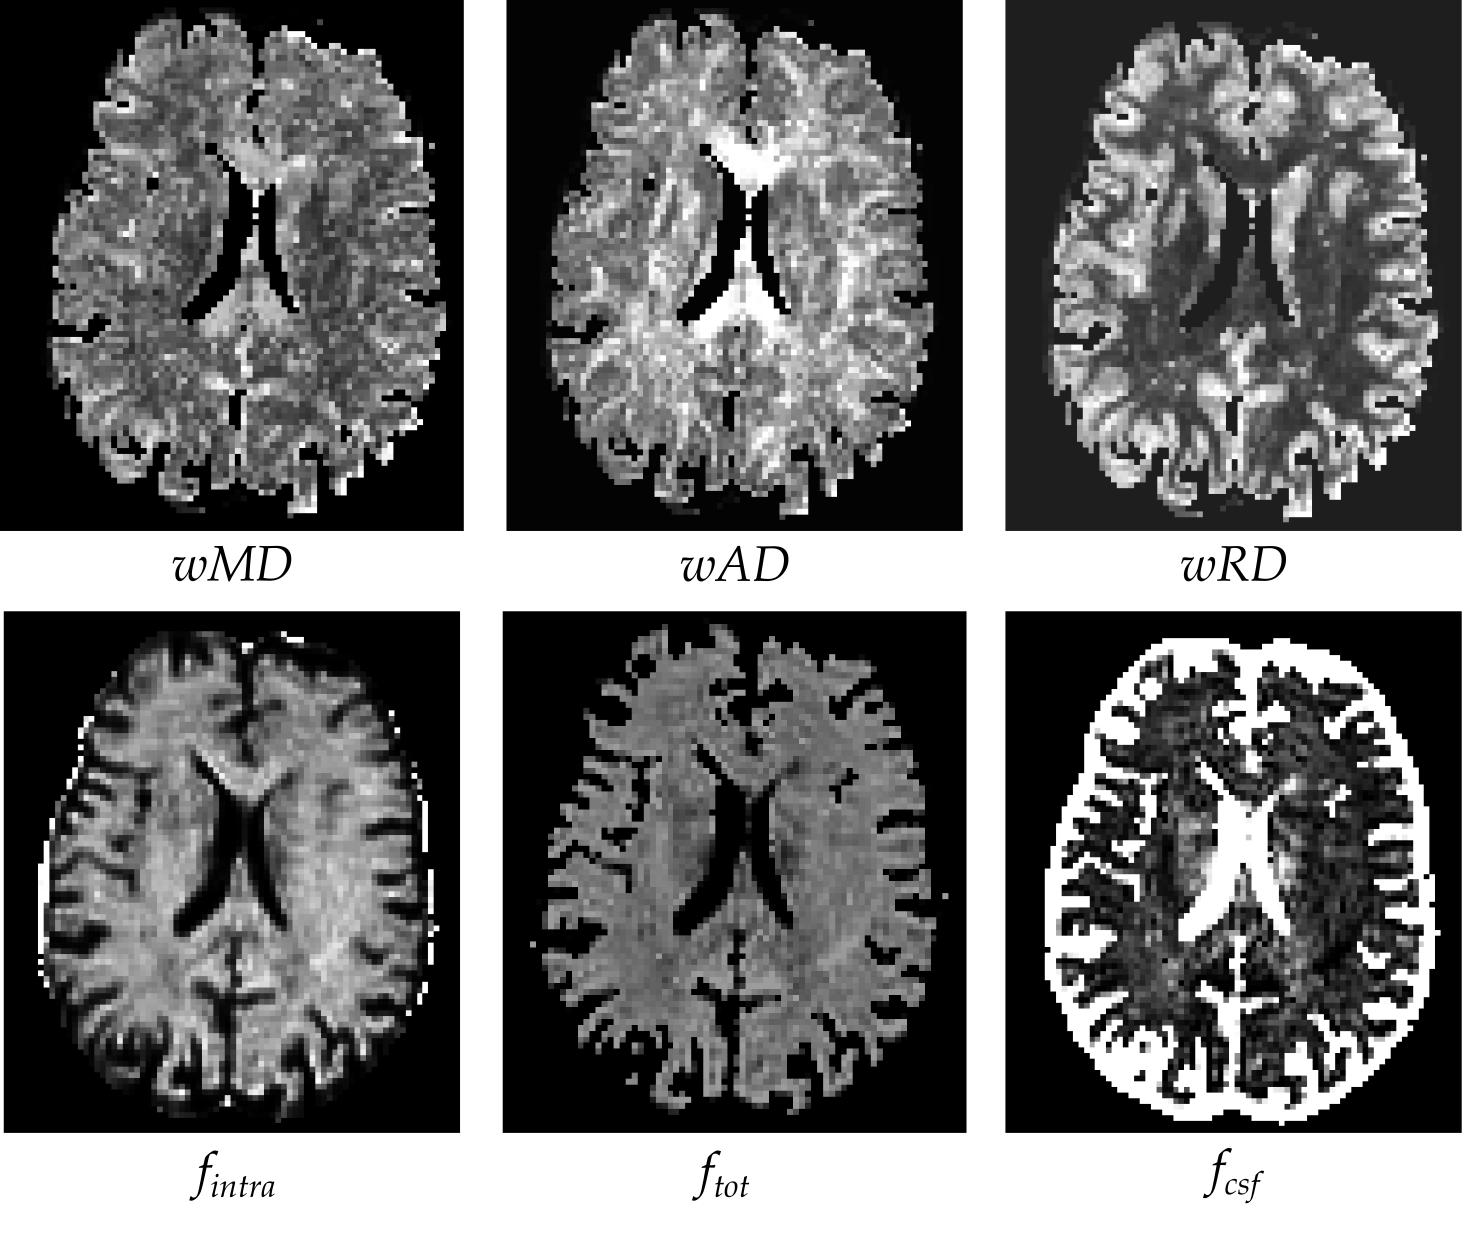
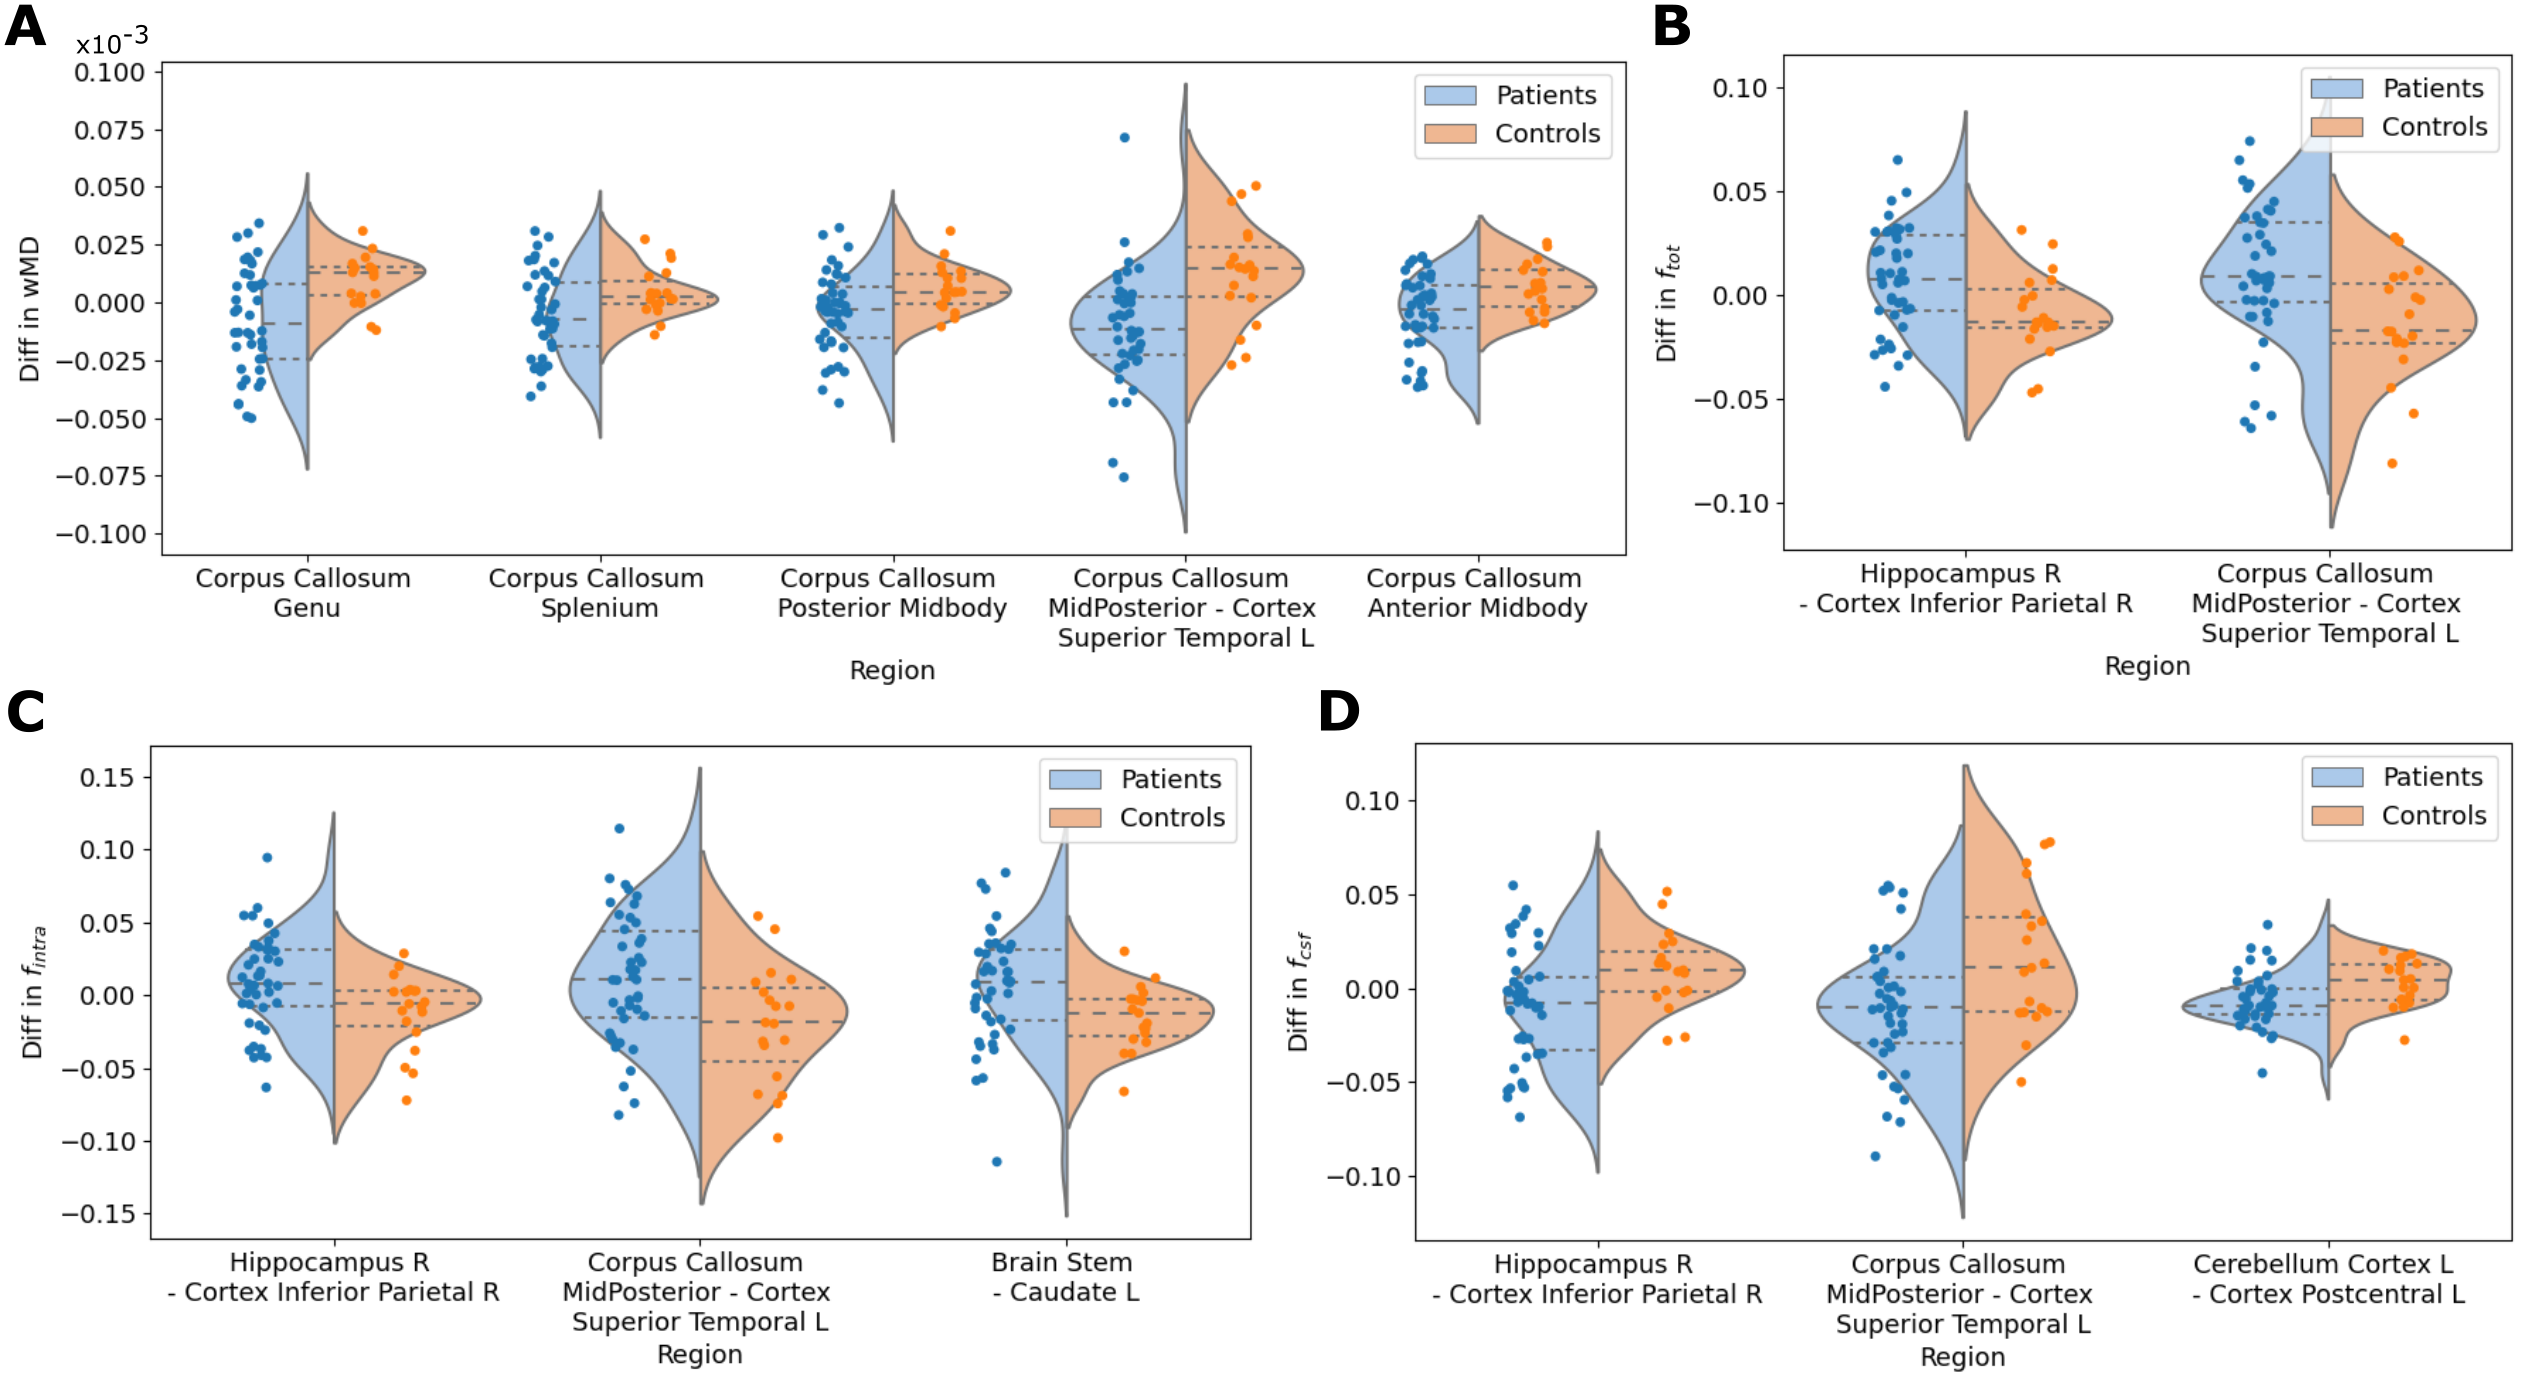
Figure 3: Violin plots with the median (dashed line) and quartiles (dotted lines) of the microstructural evolution of AUD (blue) and control (orange) population for A $$$wMD$$$, B $$$f_{tot}$$$, C $$$f_{intra}$$$ and D $$$f_{csf}$$$ for the four significant regions above mentioned and four of the five subdivisions of the CC. L stands for Left and R for Right.