1724
Quantitative analysis of MRI-visible perivascular spaces in schizophrenia1Division of Biomedical Engineering, Hankuk University of Foreign Studies, Yongin, Korea, Republic of, 2Department of Neuropsychiatry, Pusan National University Yangsan Hospital, Yangsan, Korea, Republic of
Synopsis
Keywords: Psychiatric Disorders, Psychiatric Disorders, Schizophrenia, Glymphatic, Perivascular Space, water clearance
Motivation: Perivascular spaces(PVS) are fluid-filled spaces that surround blood vessels in the brain. While dilated PVS(dPVS) play an important role, investigations into dPVS in schizophrenia are poorly understood.
Goal(s): In this study, we aim to explore the potential of dPVS quantification as a biomarker for schizophrenia.
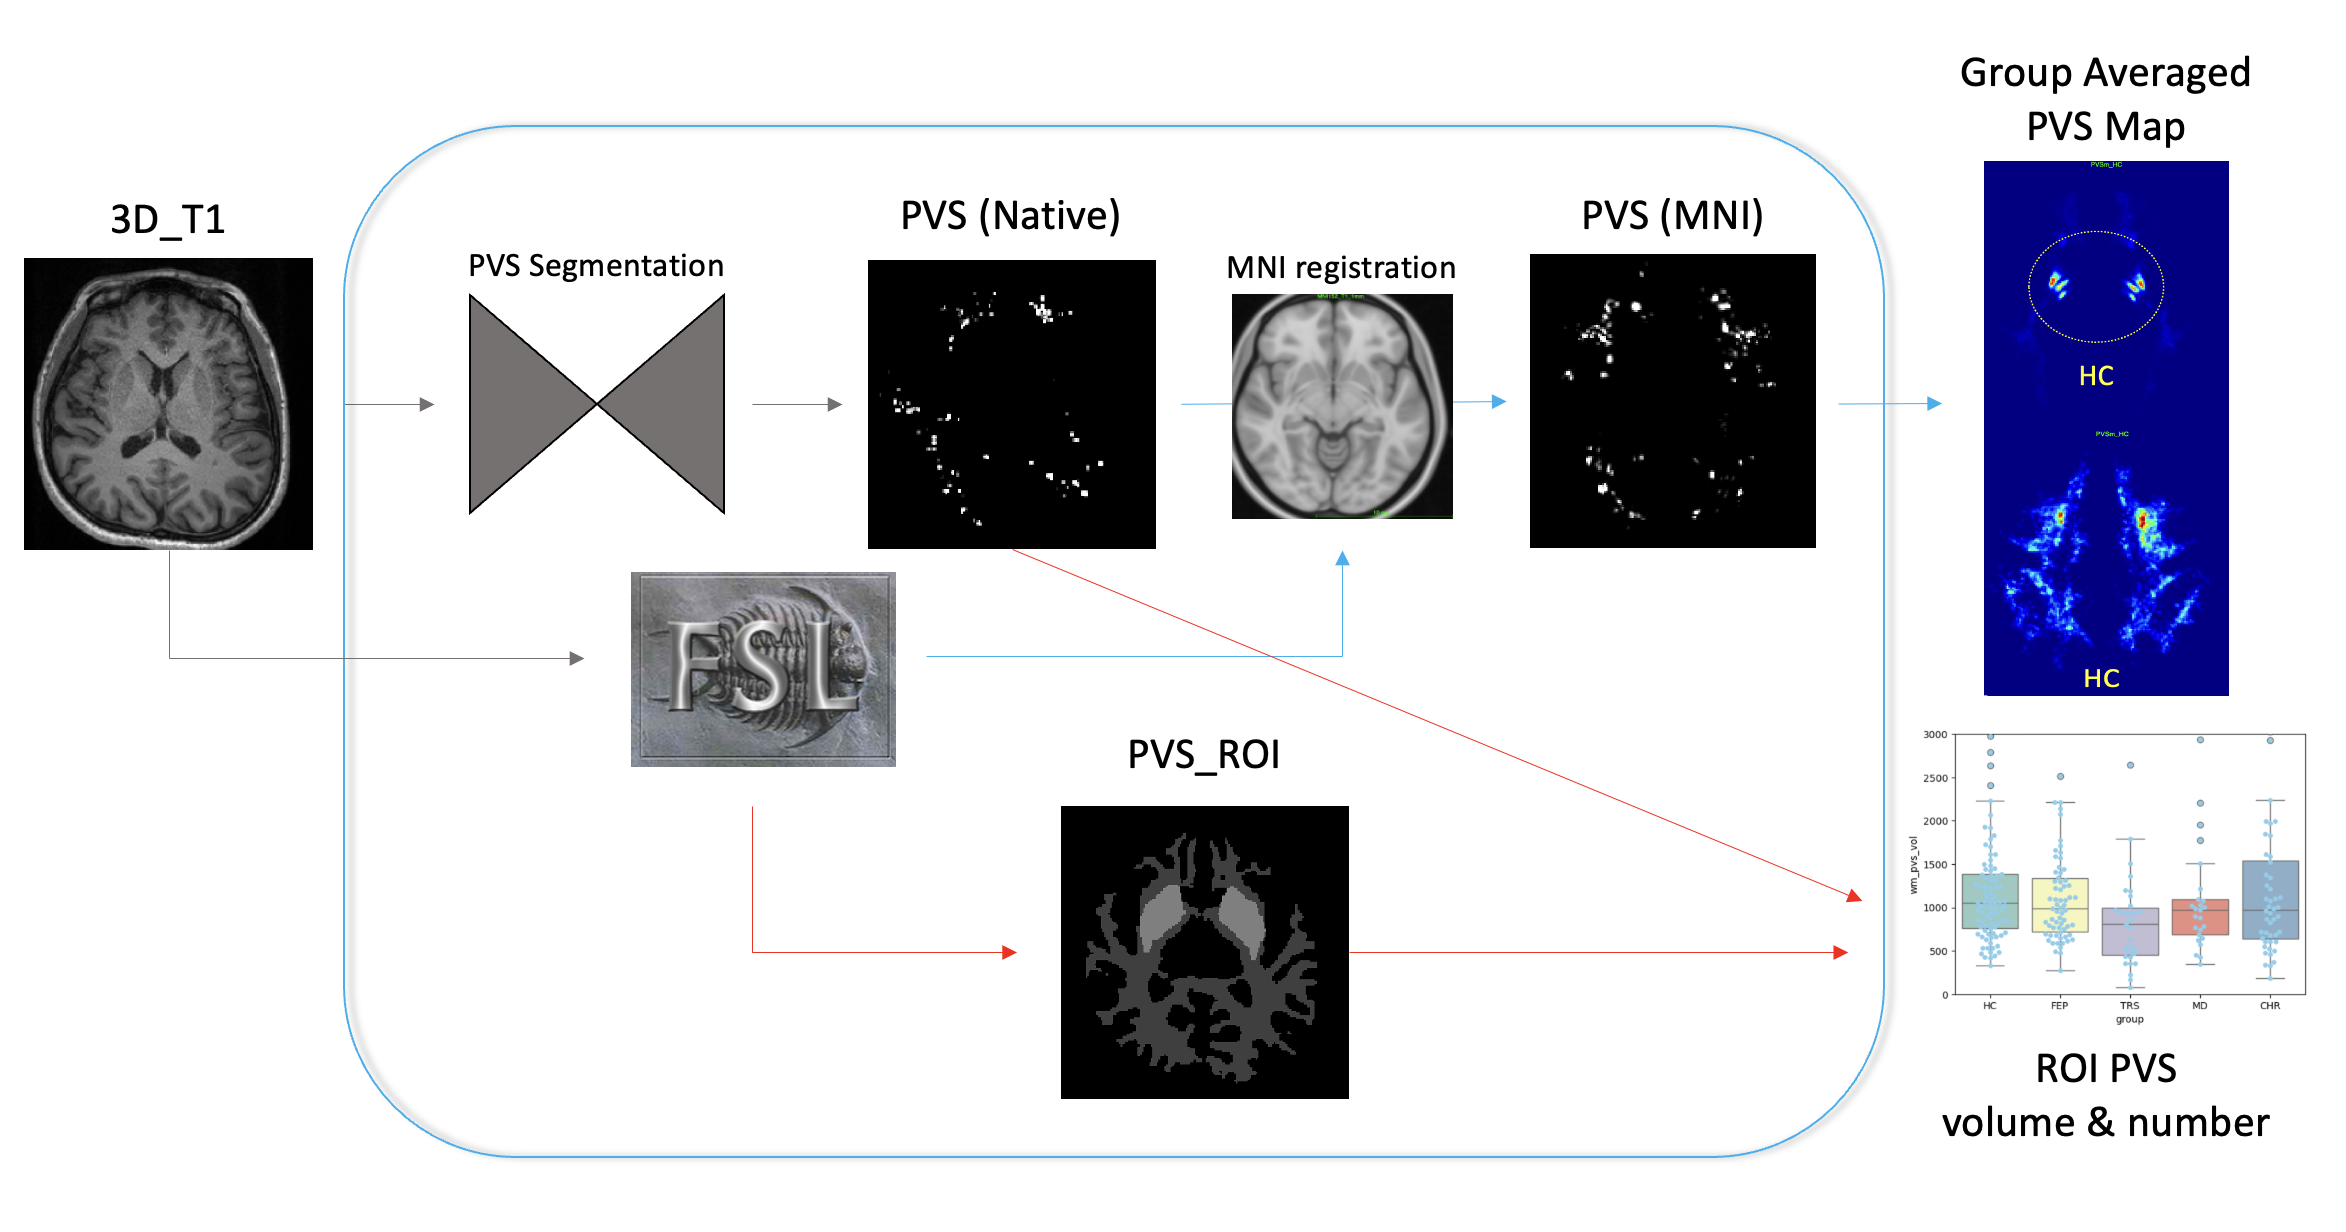
Approach: For volumetric assessment, we segmented the dPVS in the white matter(WM) and basal ganglia(BG), and calculated the volumes and numbers of dPVS for each subject.
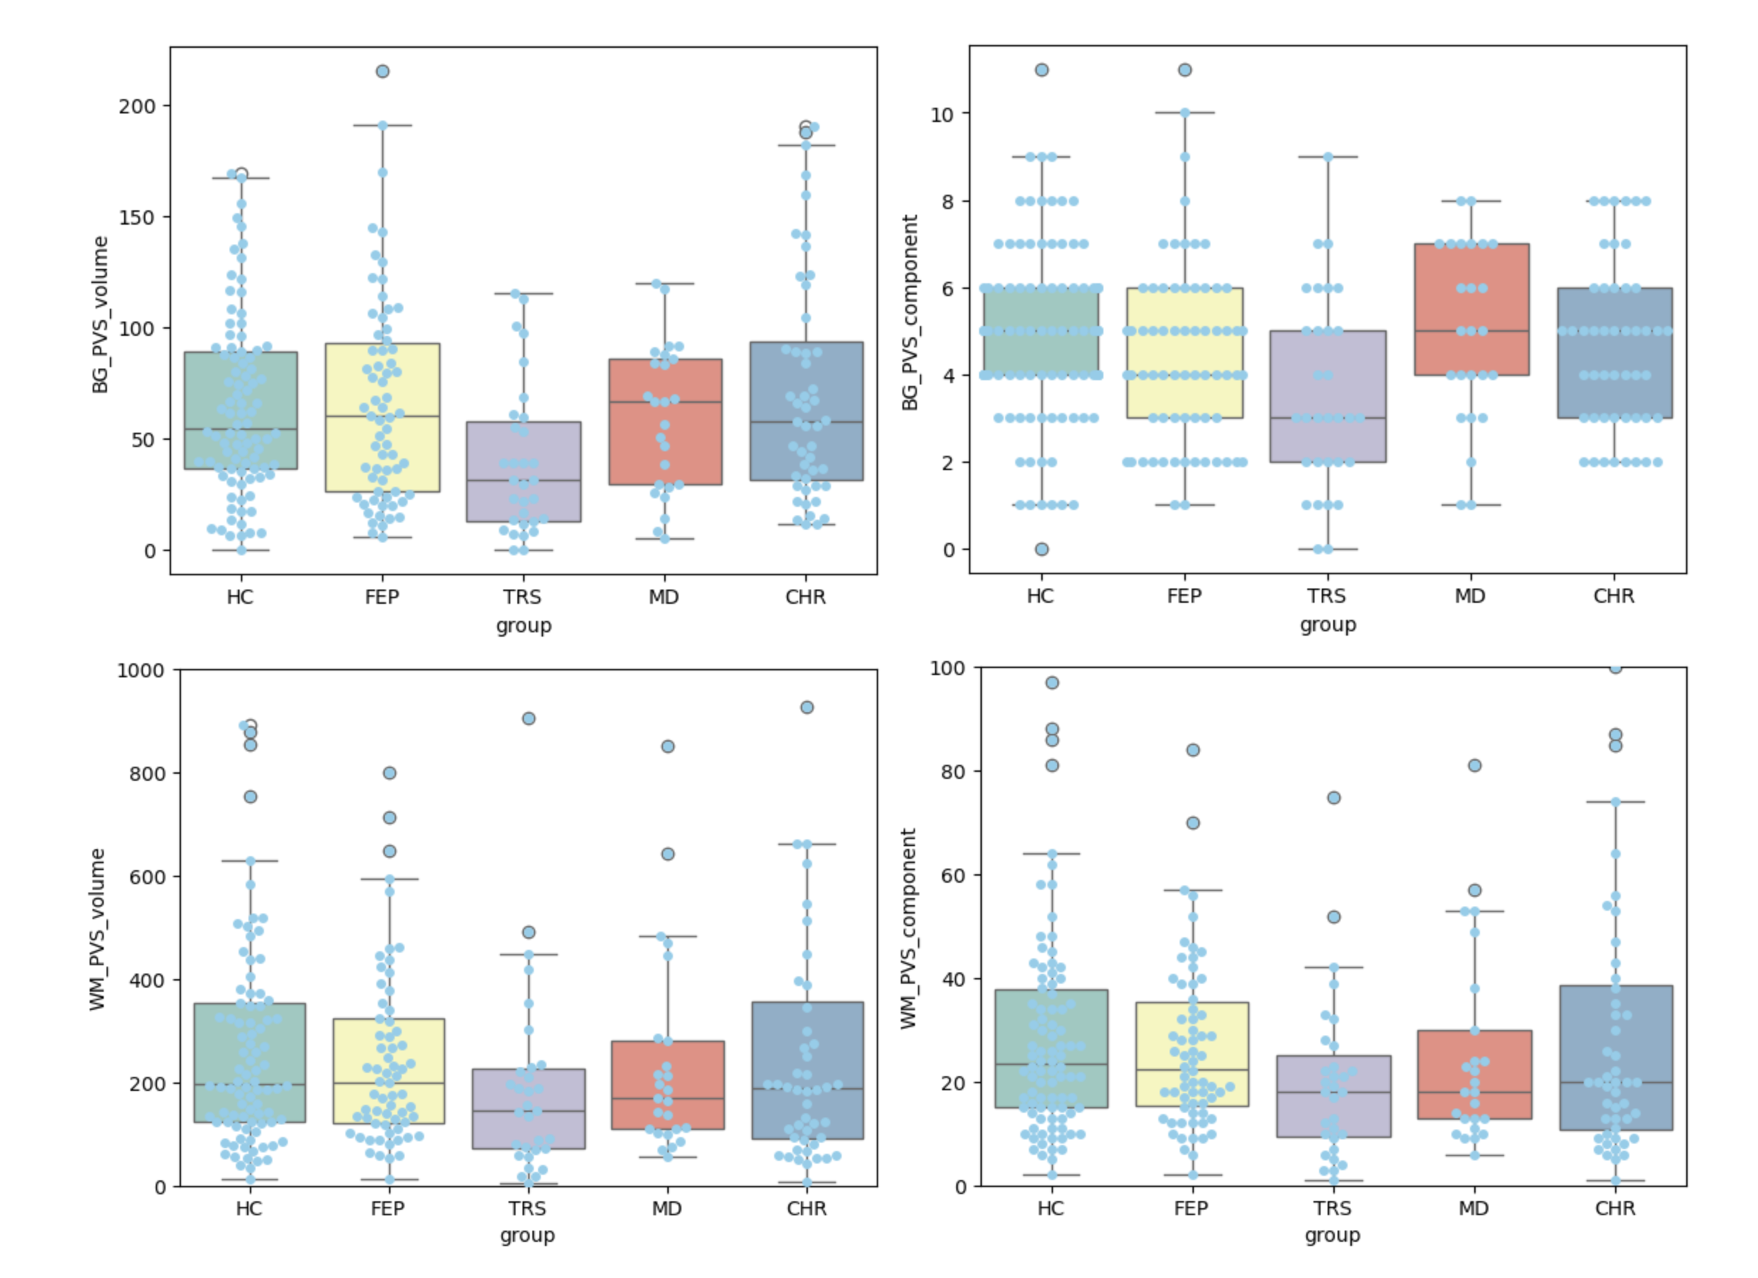
Results: Our findings reveal differences in dPVS numbers and volumes among schizophrenia subgroups, especially in treatment-resistant schizophrenia(TRS) which showed smaller dPVS volumes compared to other groups in both WM and BG.
Impact: Our study offers insights into the potential of dPVS quantification as a biomarker for schizophrenia. We observed differences in total dPVS volumes and number of dPVS components between different schizophrenia subgroups and found significant results especially in TRS.
Introduction
Schizophrenia is a complex neuropsychiatric disorder characterized by diverse symptoms affecting cognitive, emotional, and social functioning. The glymphatic system, a network of dPVS and vessels in the brain responsible for clearing waste products and facilitating cerebrospinal fluid flow, has gained increasing attention in neuroimaging research.However, there are not many studies focused on dPVS when it comes to schizophrenia. By using dPVS imaging as a tool for assessing the glymphatic system in the brain, valuable insights into its functionality and potential implications for neurological conditions like schizophrenia may be expected. In this study, we investigated dPVS in schizophrenia subgroups by a visual and volumetric assessment using our automatic pipeline.
Methods
We collected 3D T1-weighted images of subjects categorized into schizophrenia subgroups. The subgroups include 66 patients with first-episode psychosis (FEP), 31 patients with treatment-resistant schizophrenia (TRS), 48 patients classified as clinical high risk for psychosis (CHR), 25 patients with major depressive disorder (MD), and 90 healthy control subjects (HC).For volumetric assessment, we segmented the dPVS included in the regions of interest (ROI), specifically white matter (WM) and basal ganglia (BG), using deep learning-based automatic pipeline. Then, the volumes and numbers of dPVS were calculated for each subject and subgroup. In addition, to compare the dPVS distributions between subgroups, we performed a nonlinear fully deformable registration to MNI space with FSL Anat. For statistical analysis, a Student t-test was used. A P-value of ≤0.05 was considered as statistically significant.
Results
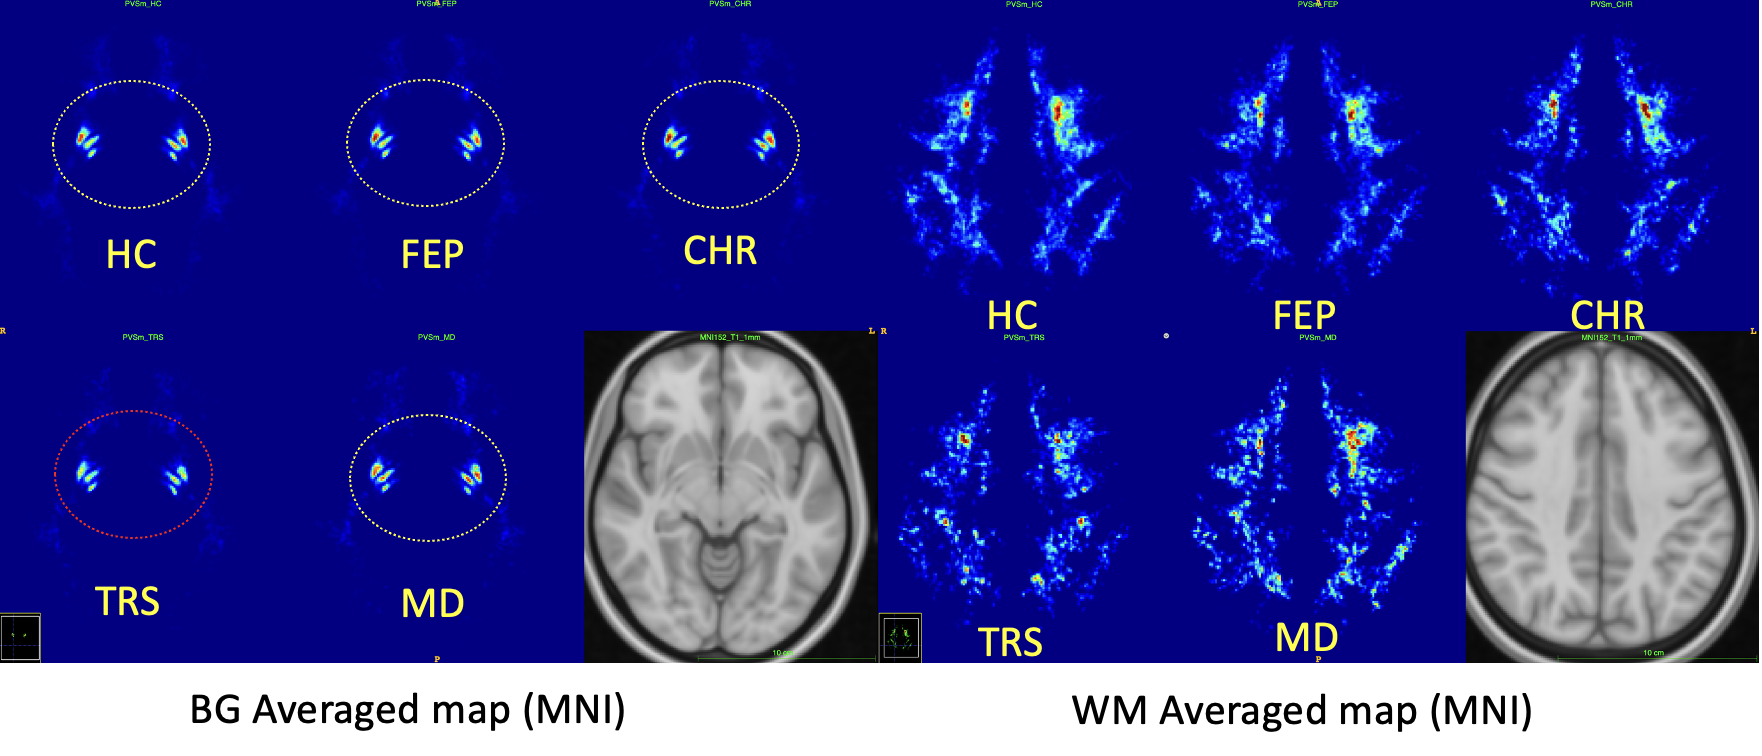
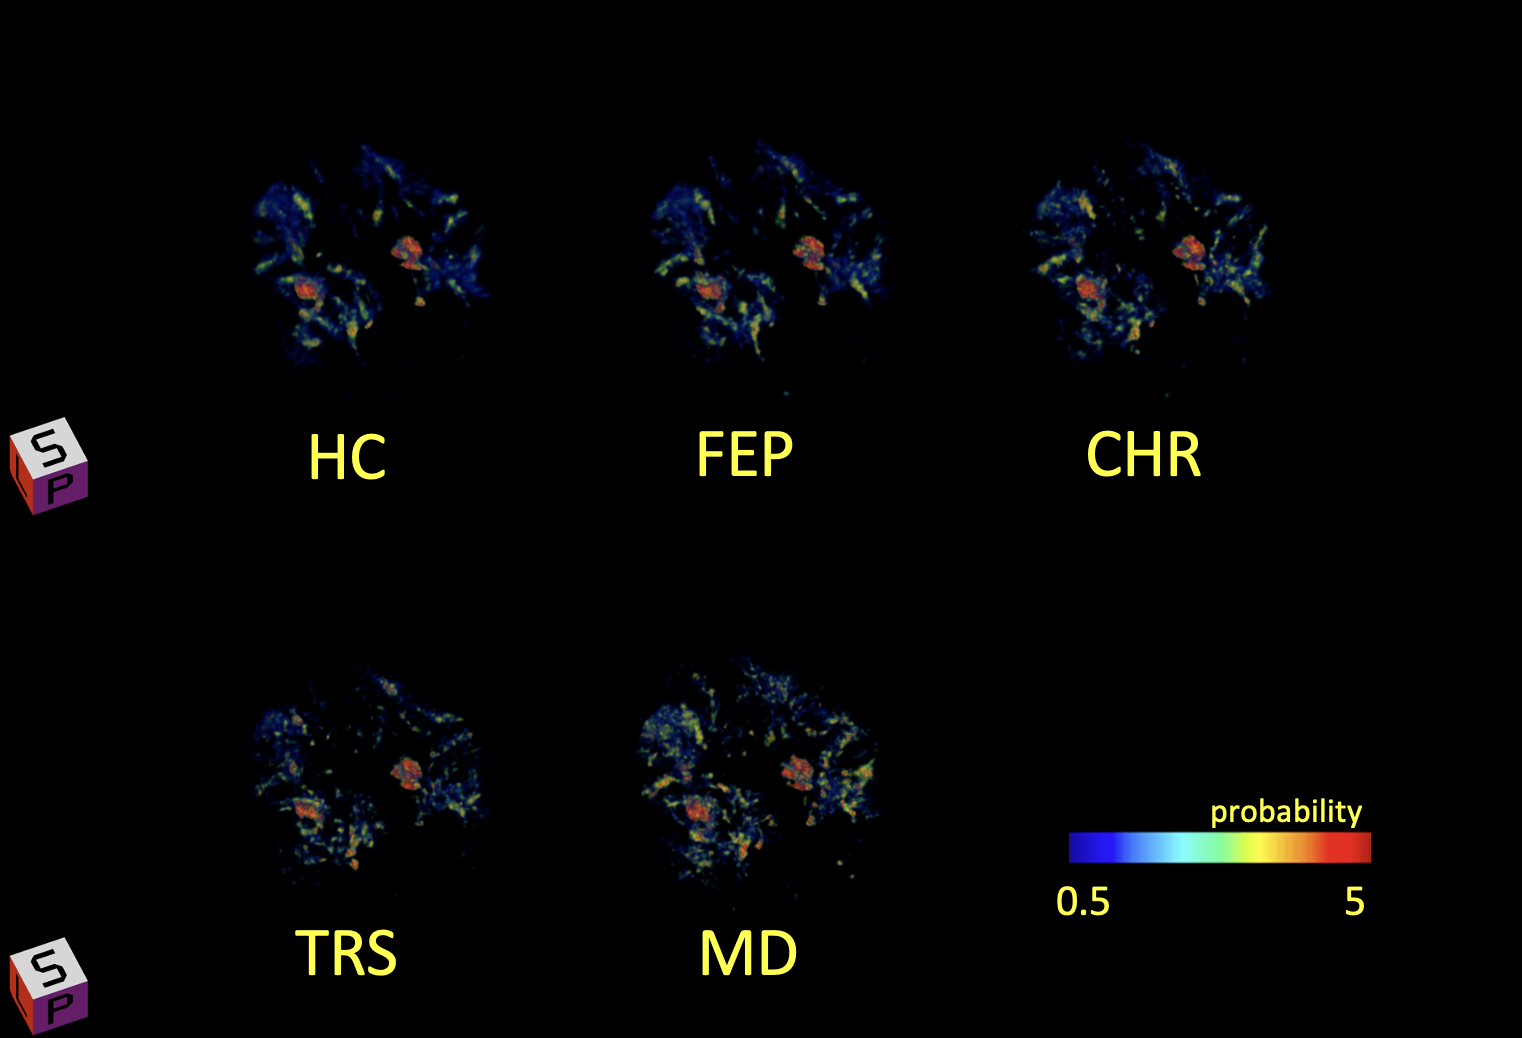
Figure 2 shows the quantitative differences in dPVS volumes among the various subgroups. Notably, TRS showed relatively small dPVS volumes and numbers compared to other groups for both WM and BG.Figures 3 and 4 show the group averaged dPVS maps, offering a visual representation of the distribution of PVS of each subgroup.
Figure 5 shows the representative cases of HC and TRS, highlighting the differences in dPVS volumes.
Discussion
We have investigated the volumes and numbers of dPVS in schizophrenia subgroups. While dPVS volumes in TRS have been observed to be significantly smaller than other subgroups, further research is needed to fully explain the underlying mechanisms driving these volume differences.Conclusion
Our results indicate that the quantification of dPVS may hold promise in distinguishing different schizophrenia subgroups. While this study contributes to our understanding of PVS in schizophrenia, ongoing research is essential to clarify the mechanisms underpinning the observed differences and to determine the clinical relevance of dPVS quantification as a diagnostic tool for schizophrenia.Acknowledgements
No acknowledgement found.References
1. Li, X., Lin, Z., Liu, C., Bai, R., Wu, D. and Yang, J. (2023), Glymphatic Imaging in Pediatrics. J Magn Reson Imaging. https://doi.org/10.1002/jmri.29040
2. Sotgiu MA, Lo Jacono A, Barisano G, Saderi L, Cavassa V, Montella A, Crivelli P, Carta A and Sotgiu S (2023) Brain perivascular spaces and autism: clinical and pathogenic implications from an innovative volumetric MRI study. Front. Neurosci. 17:1205489. doi: 10.3389/fnins.2023.1205489
Figures