1720
Longitudinal assessment of brain functional connectivity in depressed patients according to resting-state fMRI1Department of Medical Imaging and Radiological Sciences, and Department of Artificial Intelligence, Chang Gung University, Taoyuan, Taiwan, 2School of Medicine, Chang Gung University, Taoyuan, Taiwan, 3Department of Psychiatry, Chang Gung Memorial Hospital, Chiayi, Taiwan, 4Department of Diagnostic Radiology, Chang Gung Memorial Hospital, Chiayi, Taiwan
Synopsis
Keywords: Psychiatric Disorders, Psychiatric Disorders, fMRI (resting state)
Motivation: Given that suicidal ideation (SI) is closely related to social development, it is important to understand the associations between network function and SI (or the non-suicidal ideation, NS) in patients with depression.
Goal(s): We aim to investigate brain function changes in depressed patients with SI and NS between baseline (Time 1, TP1) and follow-up (Time 2, TP2; after one year of therapy).
Approach: Paired t-tests, repeated-measure ANCOVA, and network-based statistical analysis were used.
Results: We found differences in functional activity after treatment, the results surrounded the DMN region in each group. NBS revealed significantly increased functional interconnections of subnetworks after treatment.
Impact: Our findings provide more information about potential neural biomarkers of various depressive disorders.
Introduction
Suicidal ideation (SI) is an important predictor of suicide attempts, yet SI is difficult to predict [1]. Given that SI is closely related to social development, it is important to understand the associations between network function and SI (or the absence of suicidal ideation, NS) in patients with depression. In the study, we would like to investigate whether there were any brain function alterations in depressed patients with SI and without SI (NS) between baseline (Time 1, TP1) and follow-up (Time 2, TP2; after one year of therapy). We also examined patients from the SI group who converted to NS after treatment (the improved group).Methods
We recruited 83 subjects and divided them into four groups: 25 healthy controls (HCs), 27 depressed patients without suicidal ideation (NS), 18 depressed patients with suicidal ideation (SI), and 13 depressed patients with SI converted to NS (improved). All subjects underwent resting-state fMRI (3T MRI scanner) at baseline (TP1) and one year later (TP2) after receiving therapy. The mean amplitude of low-frequency fluctuations (mfALFF) [2] and mean regional homogeneity (mReHo) [3] were used to compare the function of each brain region with resting-state fMRI between TP1 and TP2 and paired t-tests as well as repeated-measure ANCOVA. Network-based statistics (NBS) were also performed to assess changes in connectivity from TP1 to TP2.Results
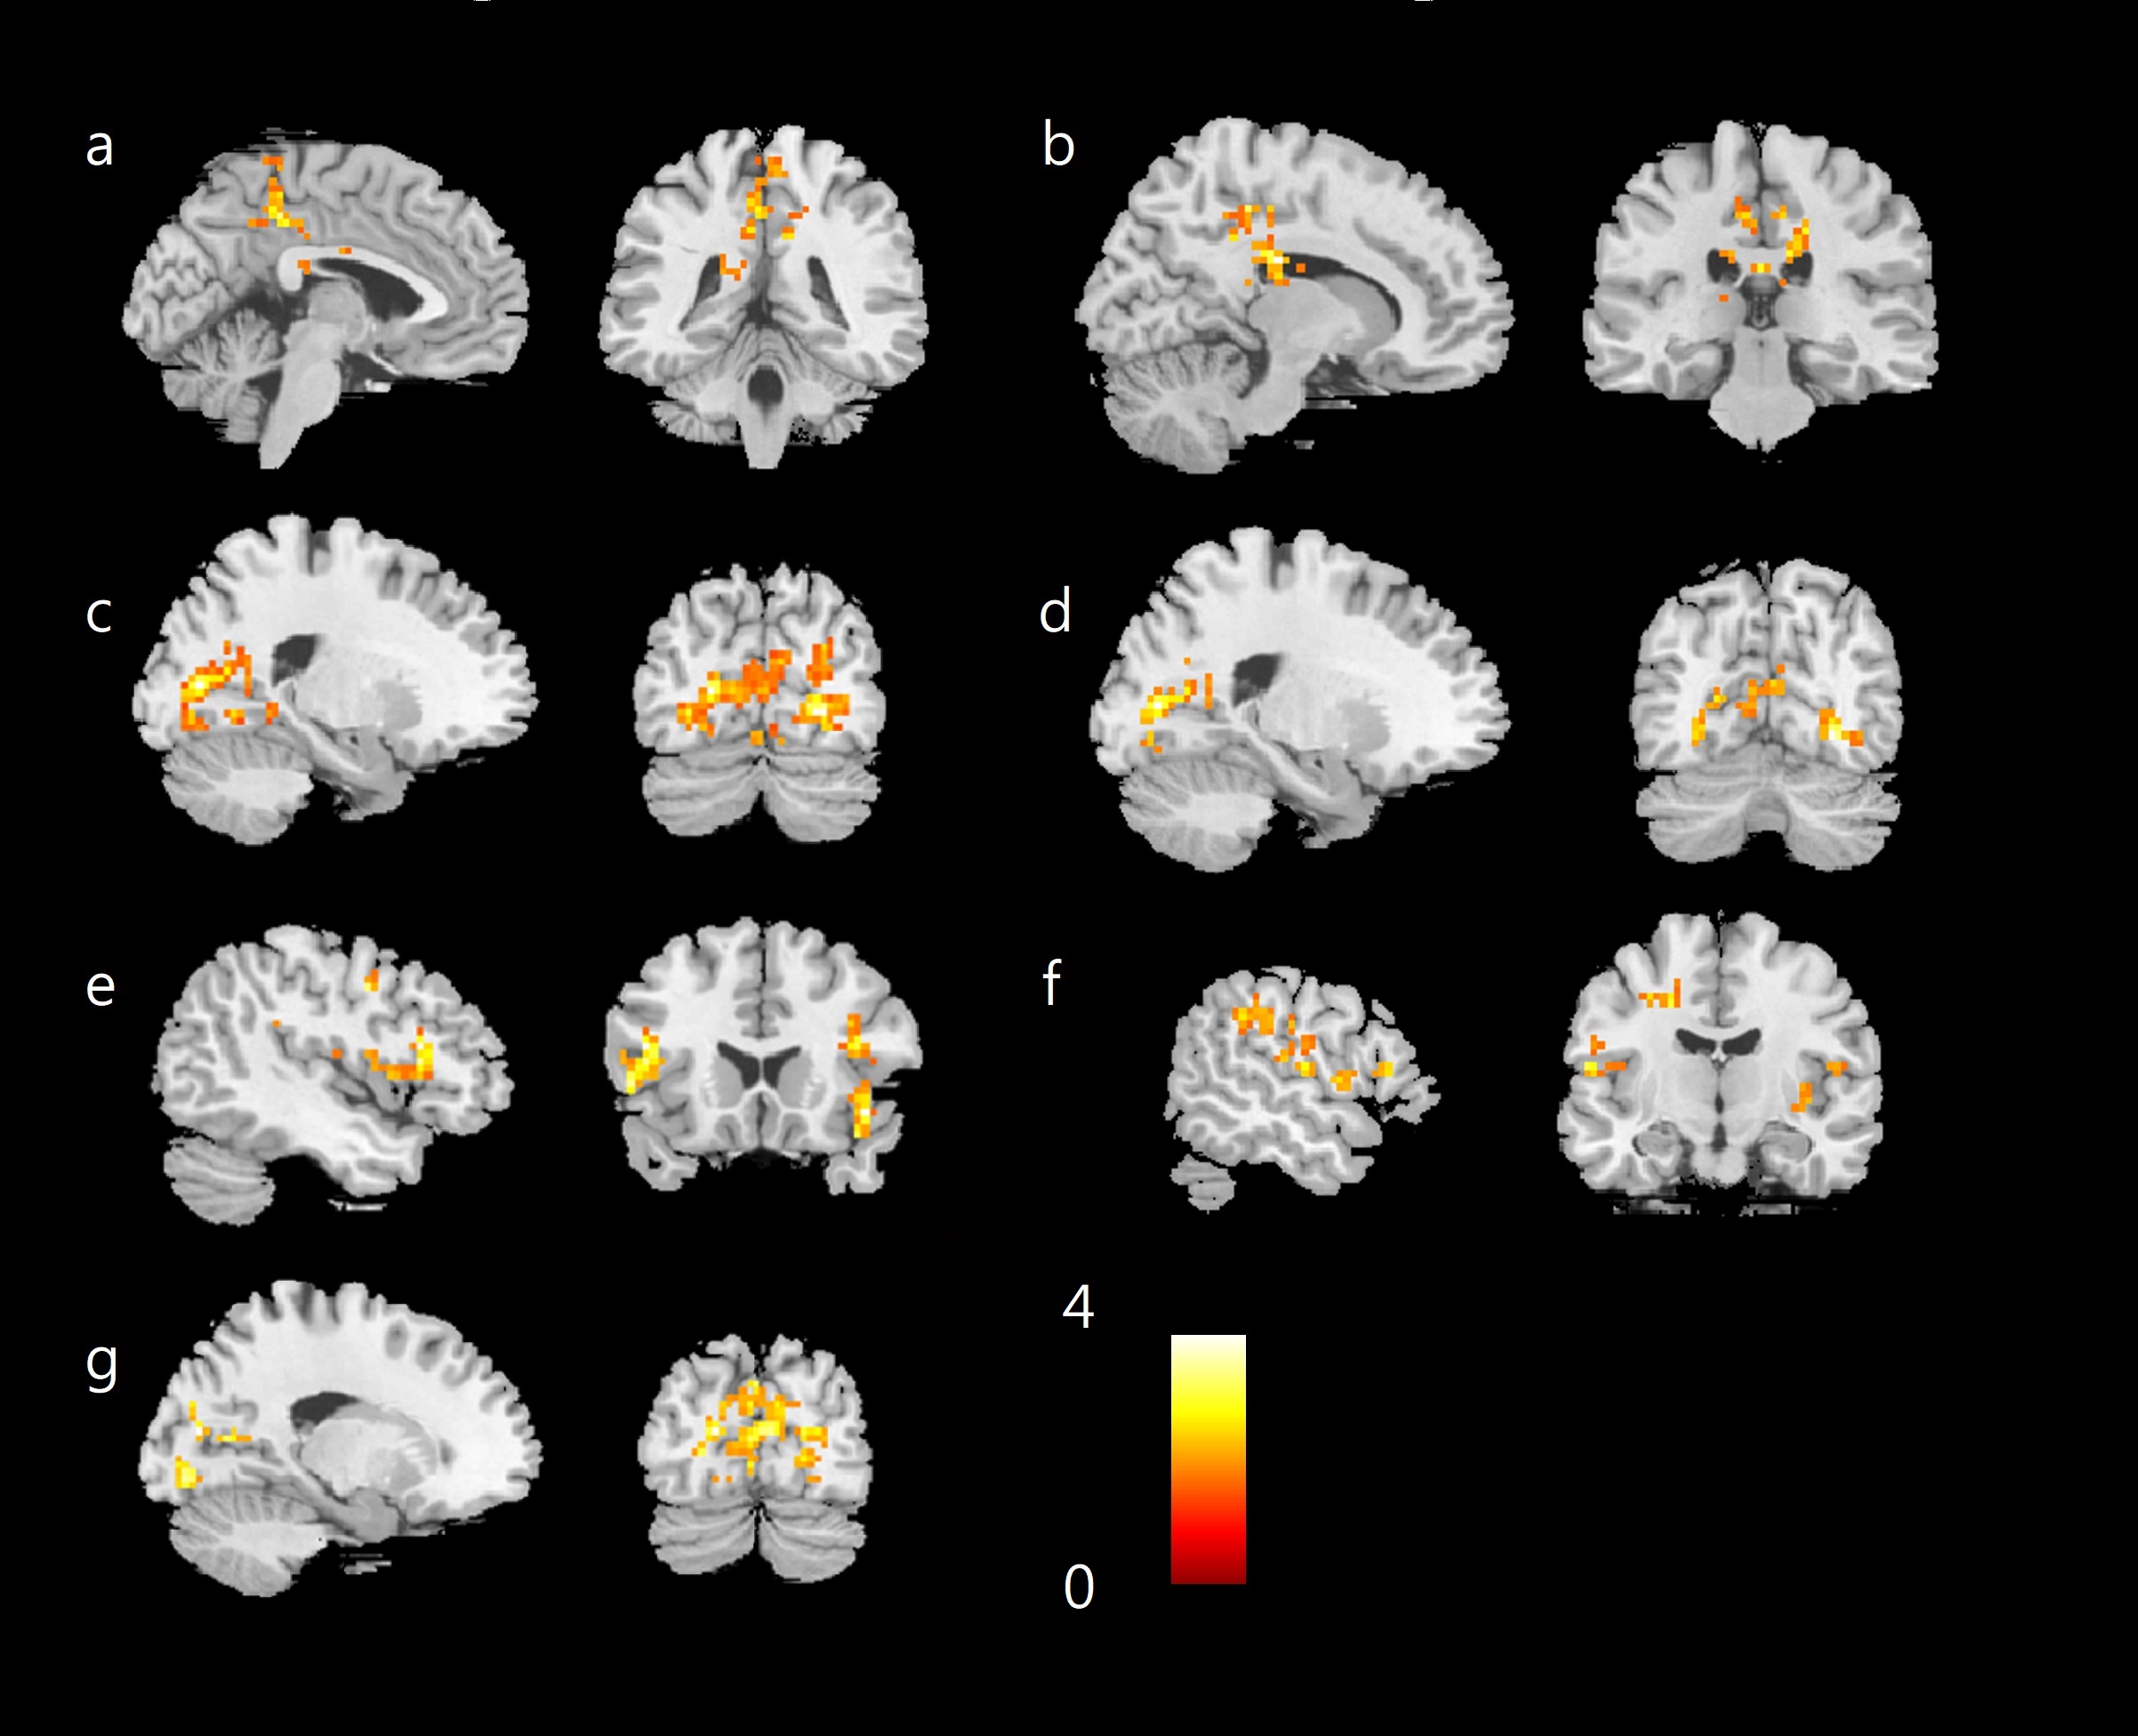
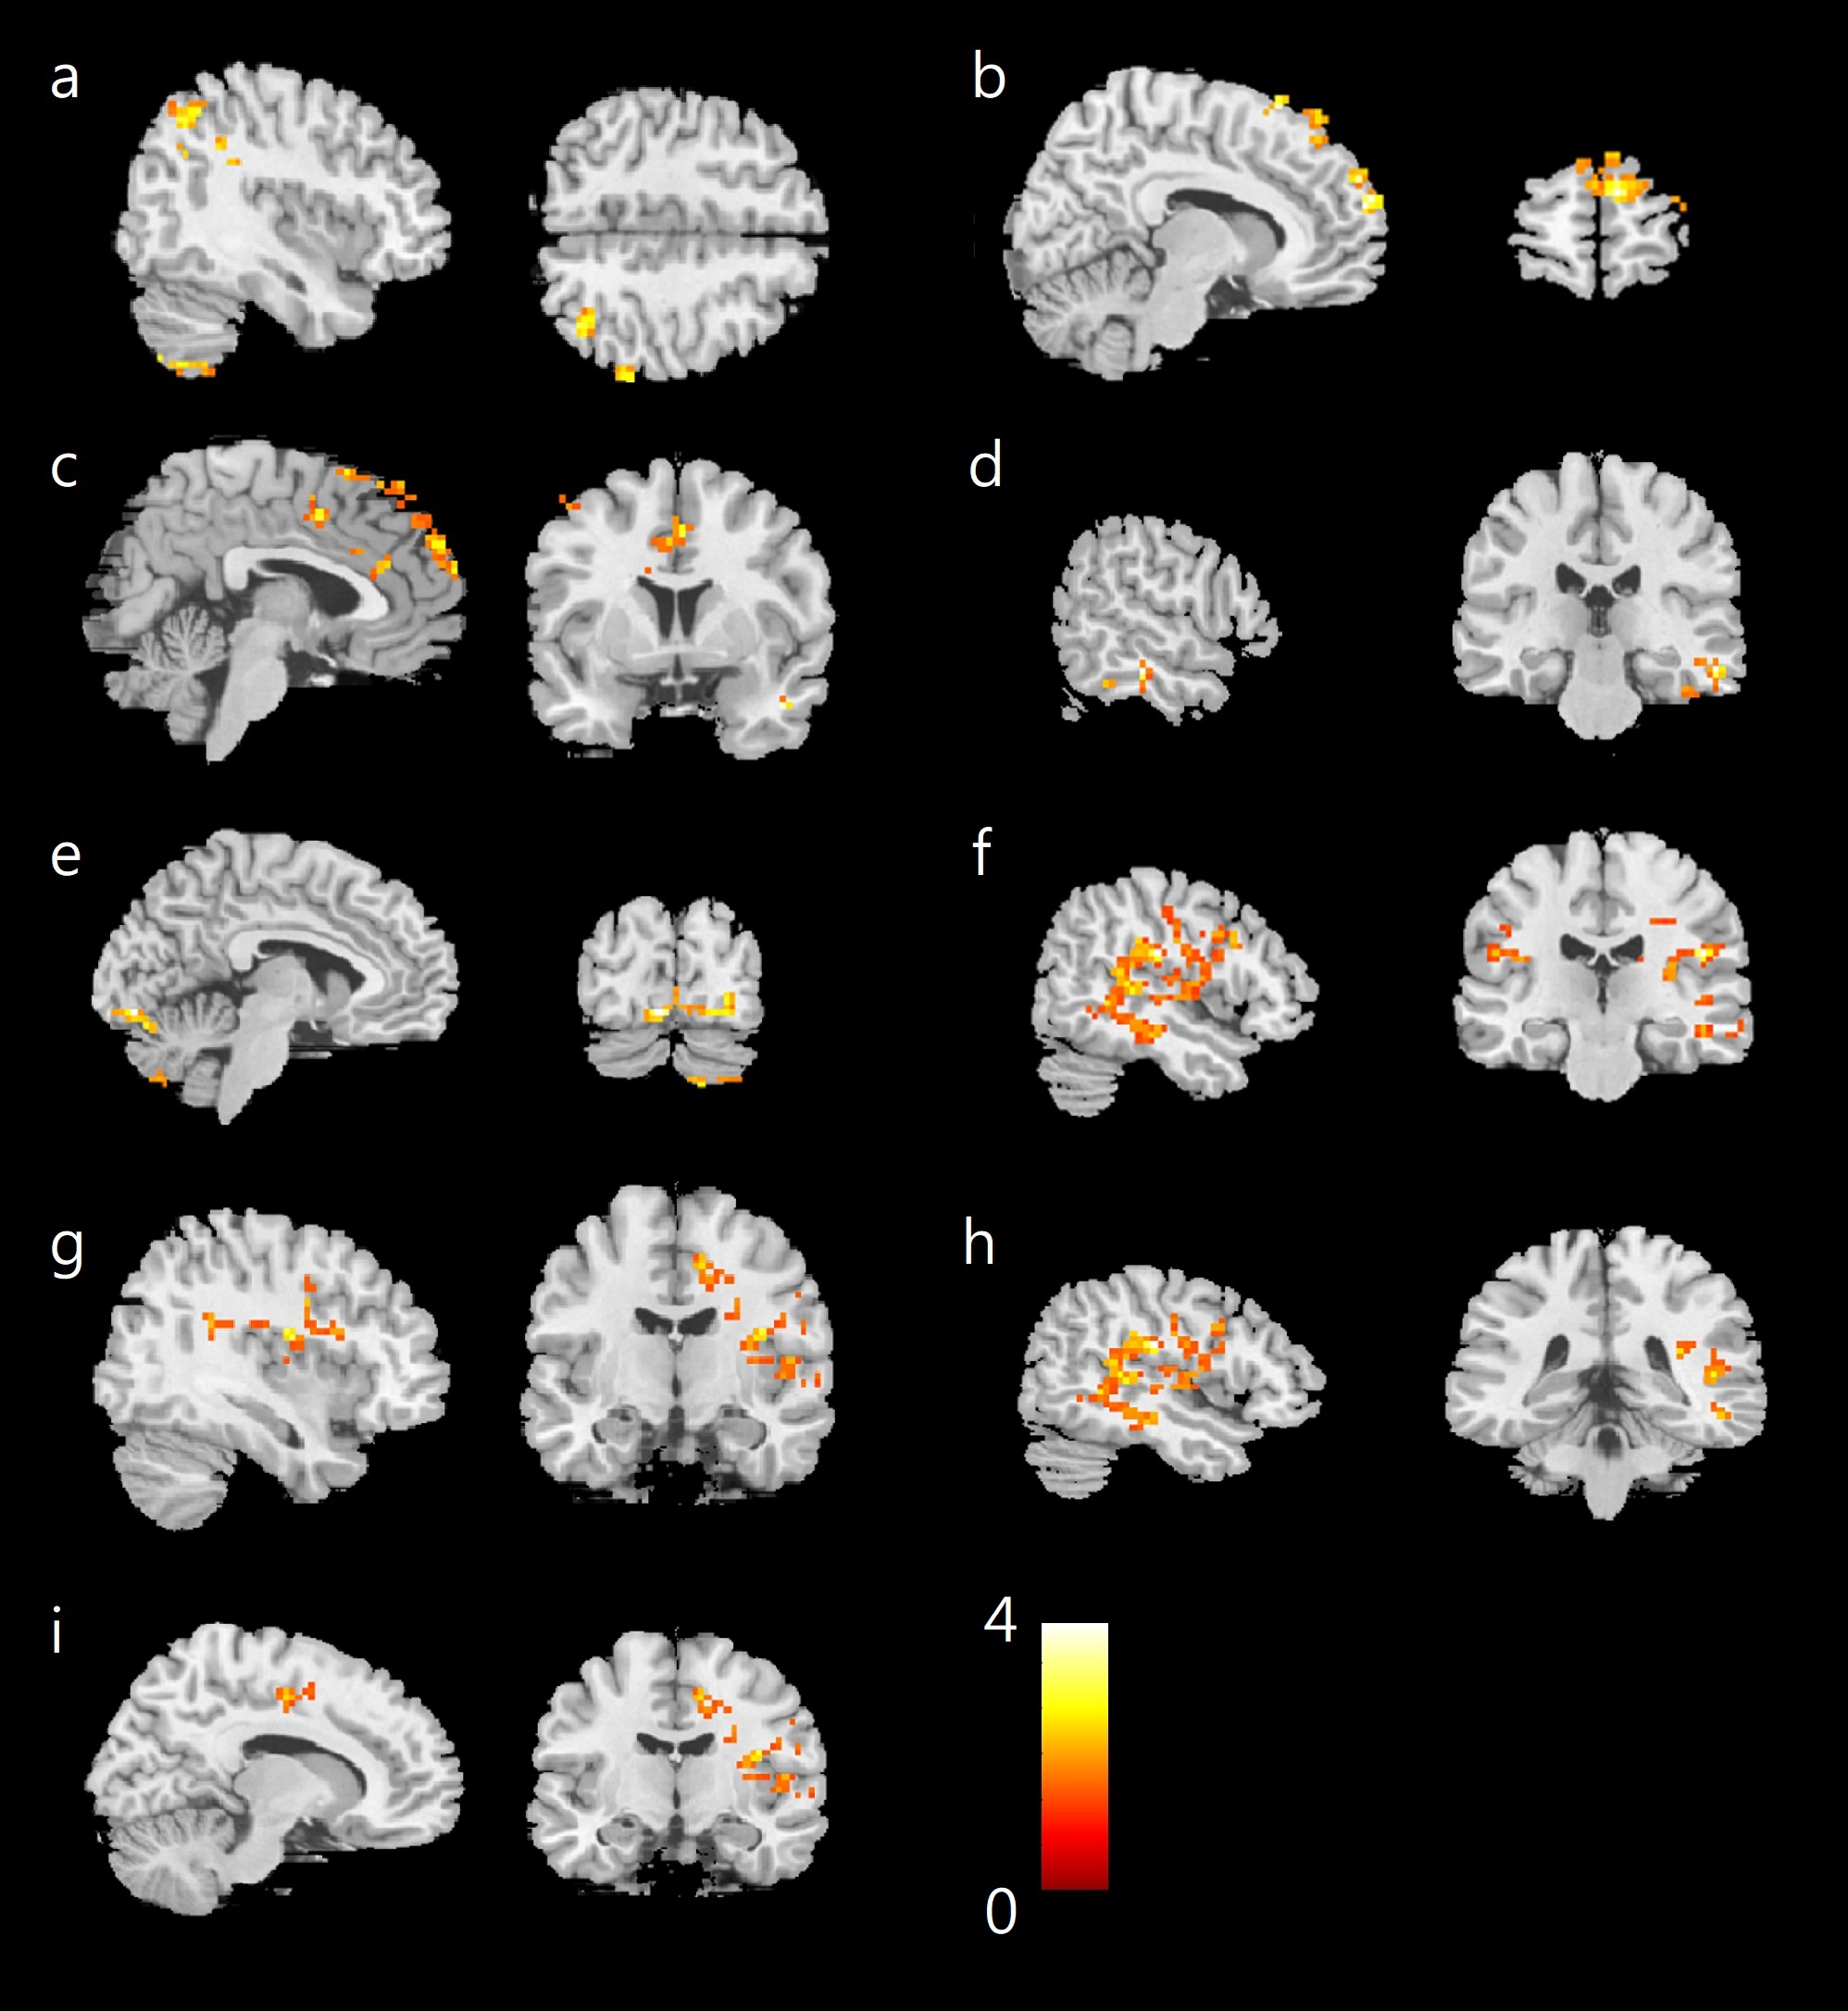
We compared the brain function of individuals in each group before and after treatment. In the depressed patients, the mfALFF maps showed a significant decrease in functional activity within the corpus callosum, paracentral lobule, and cingulate gyrus after treatment (Fig. 1a, b). Conversely, there was an increase in functional activity within the PCC, cuneus, and lingual gyrus after treatment (Fig. 1c, d). The mReHo maps showed reduced functional activity within the inferior frontal lobe and insula after treatment (Fig. 1e, f). Additionally, there was a significant increase in functional activity within the cuneus after treatment (Fig. 1g).In addition, in the SI group and improved group, mfALFF and mReHo also exhibited differences within several brain regions from TP1 to TP2 (Fig. 2 and Fig. 3). In the mfALFF map of the SI group, the inferior parietal lobe exhibited a decrease in functional activity after treatment (Fig. 2a). mfALFF was increased in the middle and superior frontal lobes, the cingulate gyrus, and the middle temporal lobe (Fig. 2b-d). In the mReHo map of the SI group, the lingual gyrus, calcarine cortex, and fusiform gyrus exhibited decreased mReHo after treatment (Fig. 2e). In contrast, higher mReHo was found in the inferior frontal lobe, cingulate gyrus, insula, postcentral gyrus, and superior temporal gyrus after treatment (Fig. 2f-i).
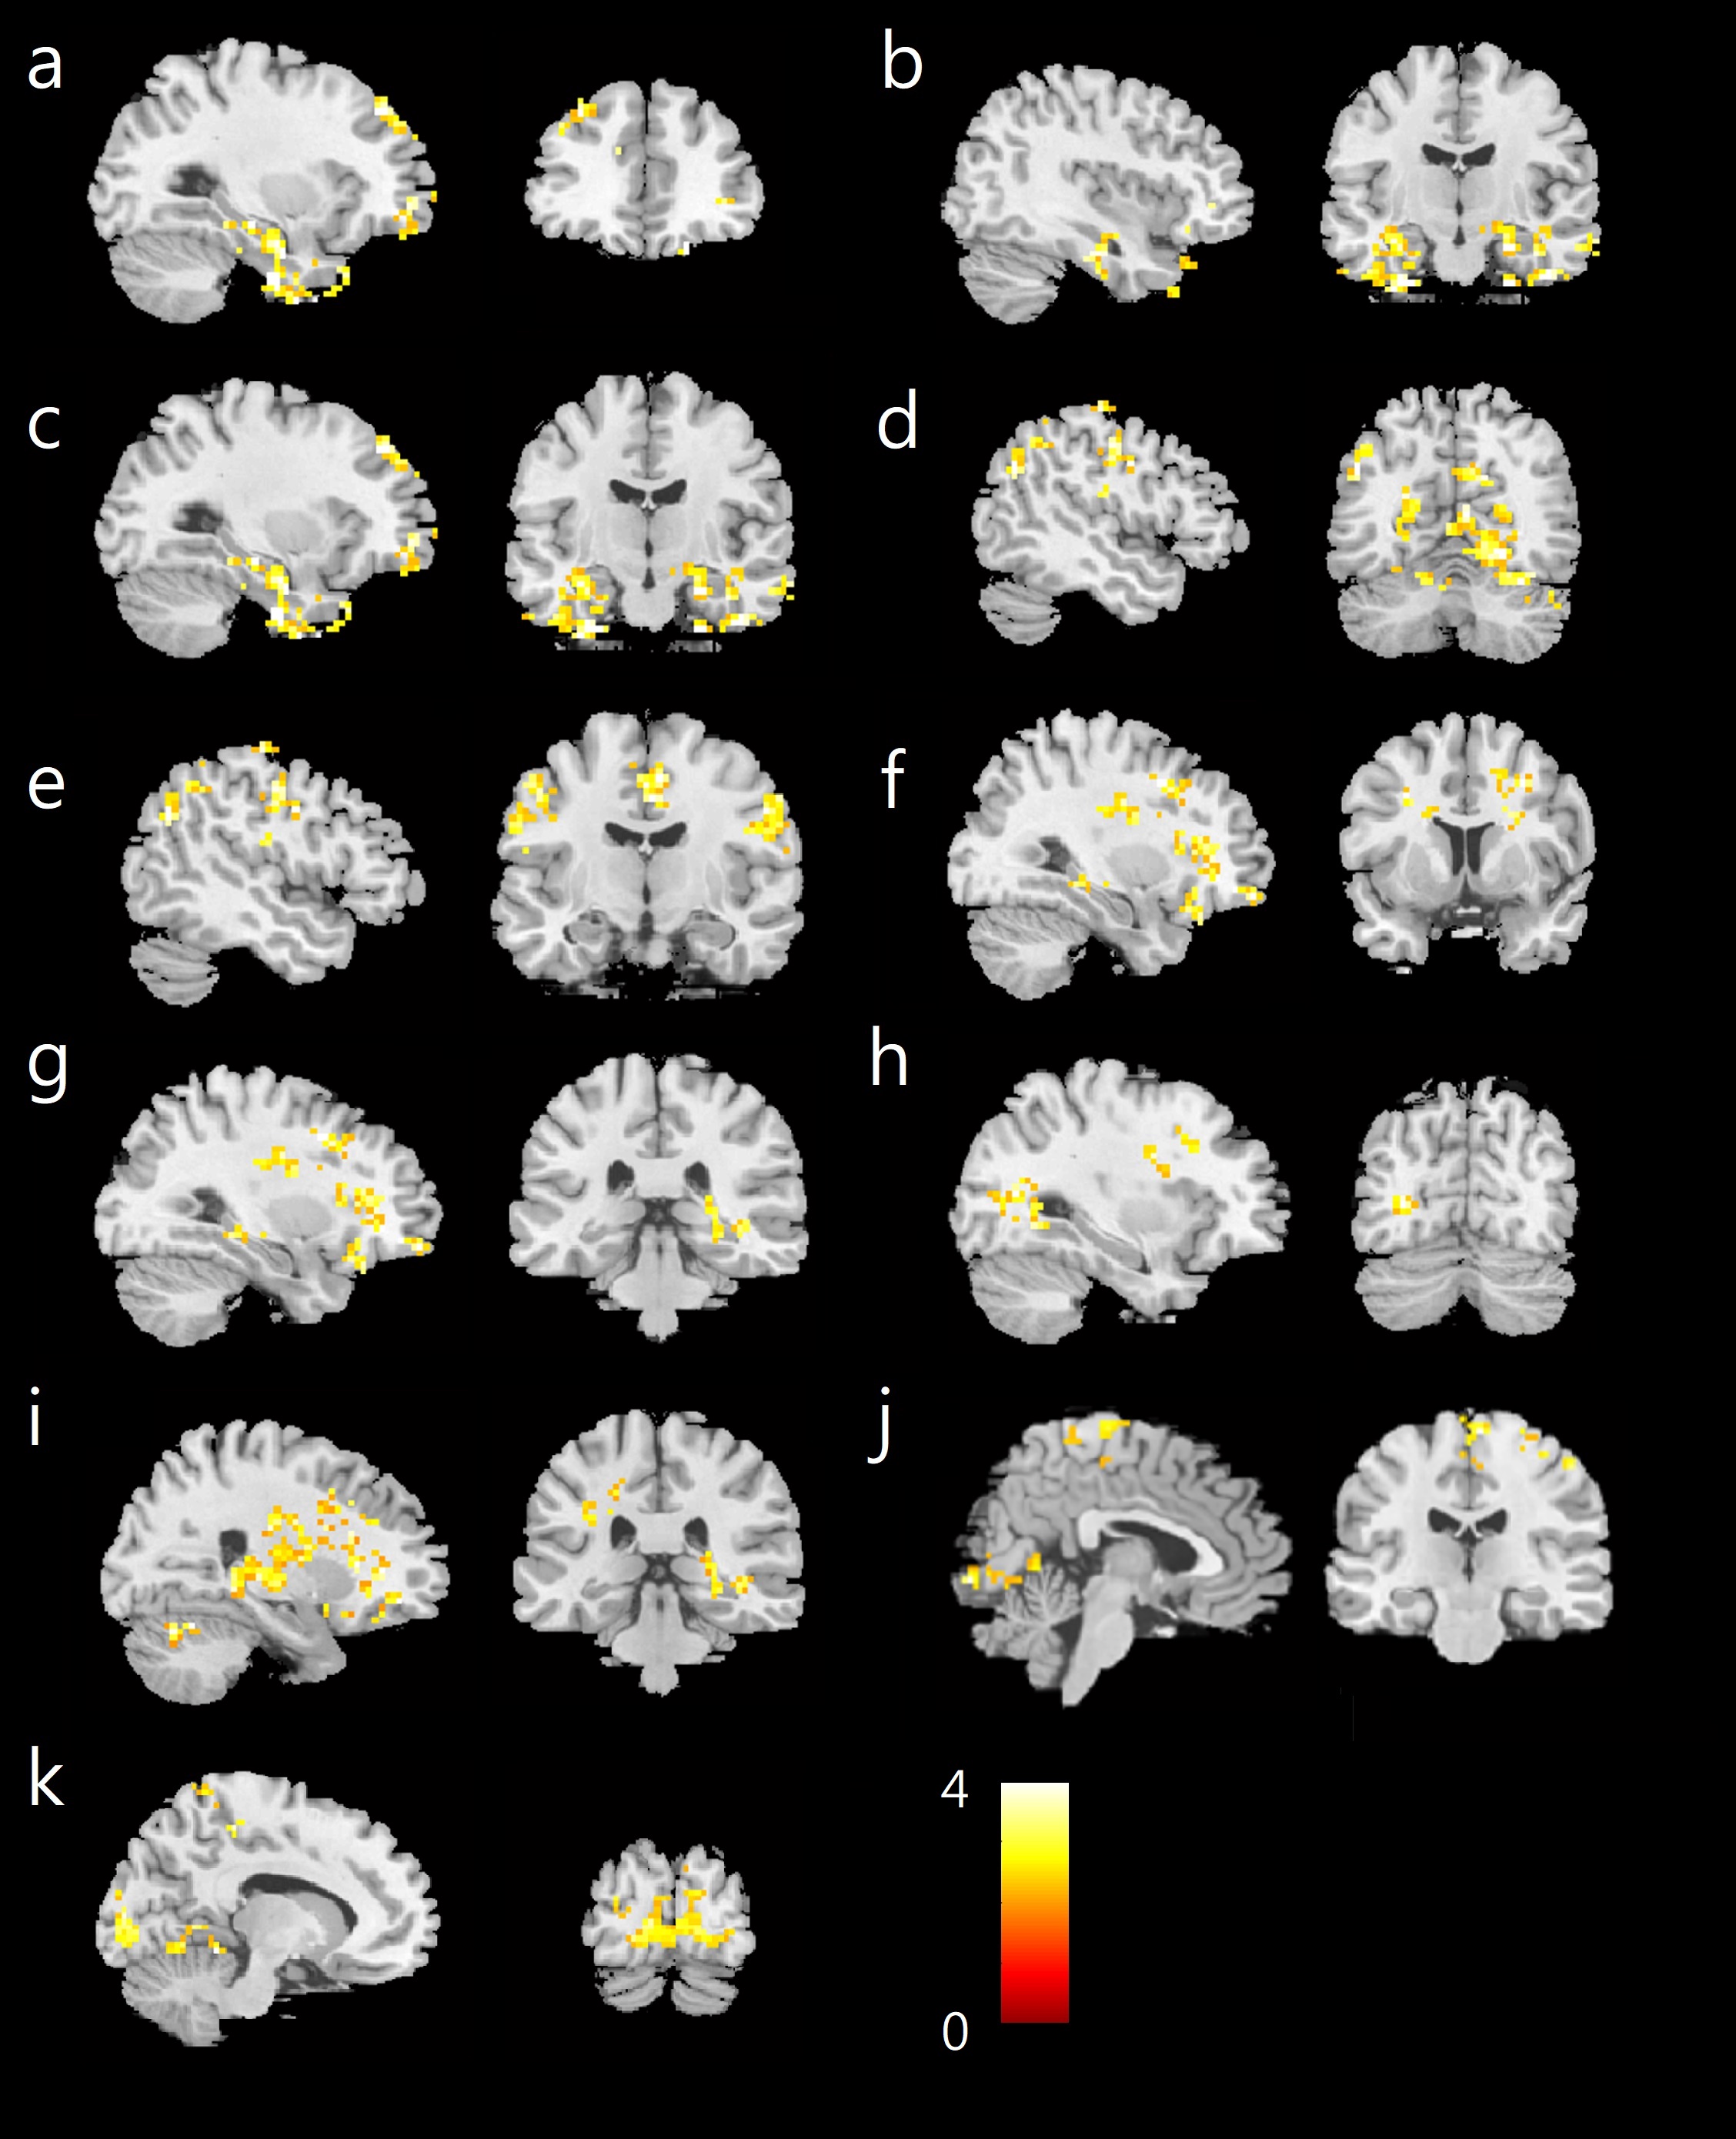
In the mfALFF map of the improved group, the superior frontal gyrus, fusiform gyrus, and hippocampus exhibited reduced mfALFF after treatment (Fig. 3a-c). mfALFF was increased in the pre/cuneus, para-hippocampus, lingual gyrus, and pre/postcentral gyrus after treatment (Fig. 3d-f). In the mReHo map of the improved group, the frontal lobe, thalamus, and hippocampus had reduced mReHo after treatment (Fig. 3g-i). In the lingual gyrus, paracentral gyrus, precentral gyrus, postcentral gyrus, para-hippocampus, and cuneus, there was increased mReHo after treatment (Fig. 3j-k).
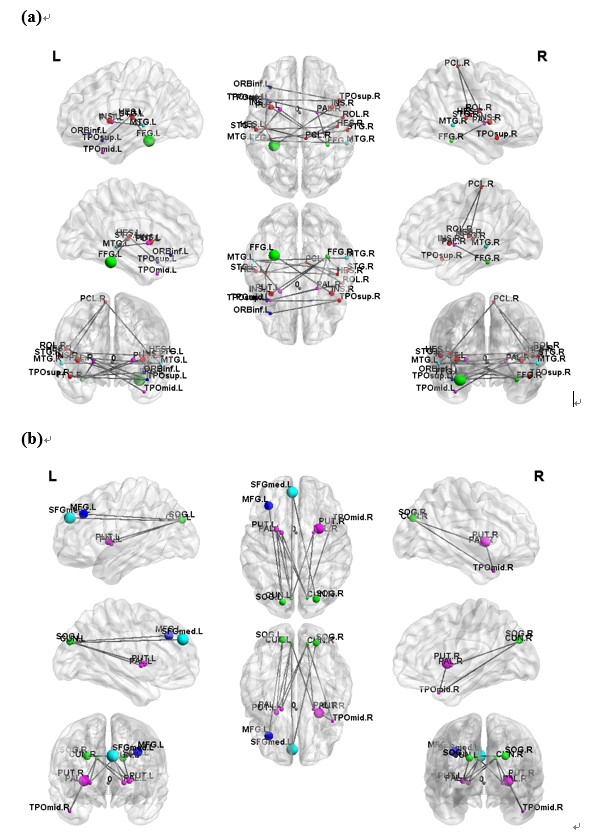
In the NBS analysis, we found that the NS group showed significantly increased interconnections of subnetworks between the bilateral temporal lobe at TP2 than at TP1 (Fig. 4a). We also found that the improved group showed significantly increased interconnections of subnetworks among the frontal lobe, occipital lobe, temporal lobe, and putamen at TP2 than at TP1 (Fig. 4b).
Discussion
Paired-sample t tests of mfALFF and mReHo values in the improved group revealed decreased mfALFF and mReHo in the frontal lobe, and hippocampus after treatment, and increased mfALFF and mReHo in the cuneus, para-hippocampus, and precuneus. A previous study showed that there was a strong relationship between depression and the default mode network (DMN) [4]. Similarly, we found changes in several brain regions in the DMN in the improved group. In NBS analysis, there was bilateral hemisphere increased interconnectivity between TP1 and TP2. It indicated its global segregation improved after the treatment.Conclusion
The above results indicate that there were brain function changes after treatment in each group, especially in the SI and improved groups. Our findings provide more information about potential neural biomarkers of various depressive disorders.Acknowledgements
This study was supported by research grants MOST109-2314-B-182-047-MY3 and NSTC112-2221-E-182-013-MY3 from the National Science and Technology Council, Taipei, Taiwan, respectively. This study was also supported by grants NMRPD1N0291~3 from Chang Gung University, Taoyuan, Taiwan.References
1. Sveticic, J. and D. De Leo, The hypothesis of a continuum in suicidality: a discussion on its validity and practical implications. Ment Illn, 2012. 4(2): p. e15.
2. Zou, Q.H., et al., An improved approach to detection of amplitude of low-frequency fluctuation (ALFF) for resting-state fMRI: fractional ALFF. J Neurosci Methods, 2008. 172(1): p. 137-41.
3. Zang, Y., et al., Regional homogeneity approach to fMRI data analysis. Neuroimage, 2004. 22(1): p. 394-400.
4. Buckner, R.L., J.R. Andrews-Hanna, and D.L. Schacter, The brain's default network: anatomy, function, and relevance to disease. Ann N Y Acad Sci, 2008. 1124: p. 1-38.
Figures