1717
Diagnosis of Schizophrenia and its Subtypes Using MRI and Machine Learning1Research Center for Molecular and Cellular Imaging, Tehran University of Medical Sciences, Tehran, Iran (Islamic Republic of), 2Computational and Artificial Intelligence, Institute of Cognitive Science Studies, Tehran, Iran (Islamic Republic of), 3Psychology, University of Tehran, Tehran, Iran (Islamic Republic of)
Synopsis
Keywords: Psychiatric Disorders, Psychiatric Disorders, Schizophrenia, Subtypes, MRI, fMRI, Machine Learning
Motivation: The heterogeneity in schizophrenia remains poorly understood which contributes to the limited success of existing treatments and the observed variability in treatment responses.
Goal(s): Our goal was to classify schizophrenia and its subtypes by using machine learning (ML) and MRI to improve understanding of the neurological basis of this schizophrenia.
Approach: We applied conventional ML and feature selection methods on MRI to reach our goal.
Results: We were able to distinguish schizophrenia and healthy and subtypes of schizophrenia using the combination of MRI and ML. we also showed evidences of brain dysfunctions in schizophrenia and its correlation with behaviors related to the disorder
Impact: The outcomes of this study reinforce the notion that the fusion of machine learning methodologies with structural and functional neuroimaging holds the potential to unearth novel biomarkers, consequently contributing to the enhancement of diagnosis and treatment strategies for psychiatric disorders.
Background
The neurobiological heterogeneity present in schizophrenia remains poorly understood and poses challenges to current analyses [1]. This likely contributes to the limited success of existing treatments and the observed variability in treatment responses. Our objective was to employ magnetic resonance imaging (MRI) and machine learning algorithms to improve the classification of schizophrenia and its subtypes. This approach aimed to achieve more accurate diagnoses and enhance our comprehension of the neural underpinnings of this disorder.Method
We utilized a publicly available dataset provided by the UCLA Consortium for Neuropsychiatric Research, containing structural MRI and resting-state fMRI (rsfMRI) data [2]. We selected 50 individuals diagnosed with schizophrenia in this dataset; along with 50 age- and gender-matched individuals among 130 healthy control cases [3-4]. By utilizing Freesurfer, we extracted the volumetrics of 66 subcortical regions and the thickness of 72 cortical regions [5]. Additionally, we obtained four graph-based measures for 116 intracranial regions in the AAL atlas from rsfMRI data including degree, betweenness centrality, participation coefficient, and local efficiency [6]. Employing conventional machine learning methods, we sought to distinguish patients with schizophrenia from healthy individuals. Furthermore, we applied the methods for discriminating subtypes of schizophrenia. To streamline the feature set, various feature selection techniques were applied. In addition, we selected the most accurate model in terms of achieving the highest classification rate between patients vs. controls to classify different subgroups of schizophrenia. Furthermore, a validation phase involved employing the selected model on a dataset domestically acquired using the same imaging assessments (N=13). Finally, we explored the correlation between neuroimaging features and behavioral assessments.Results
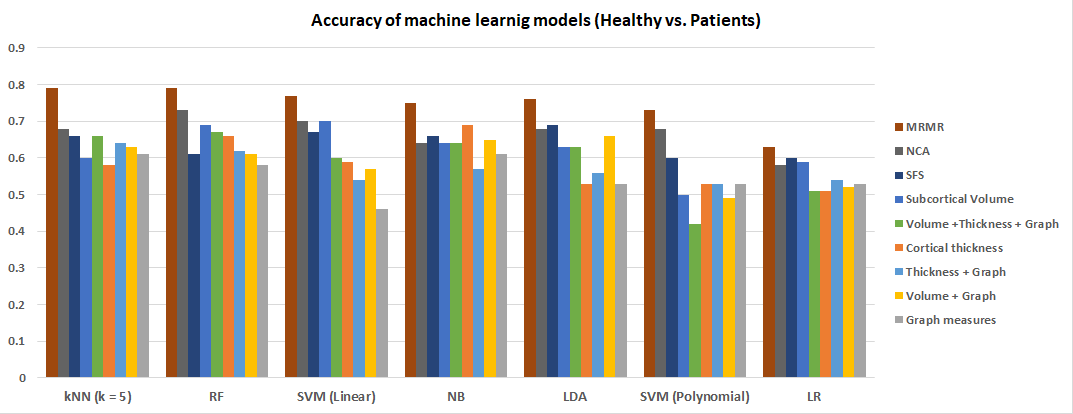
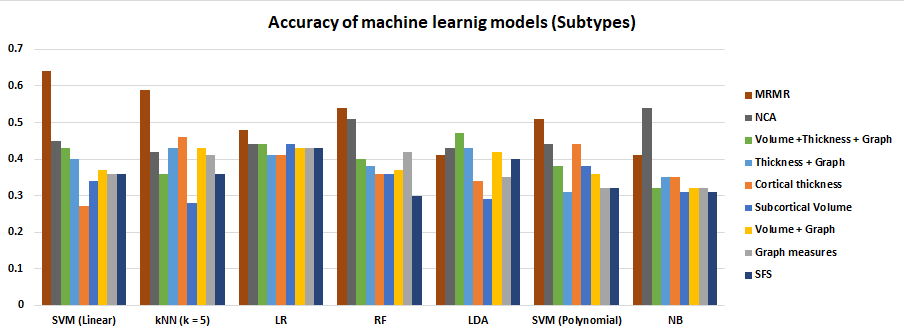
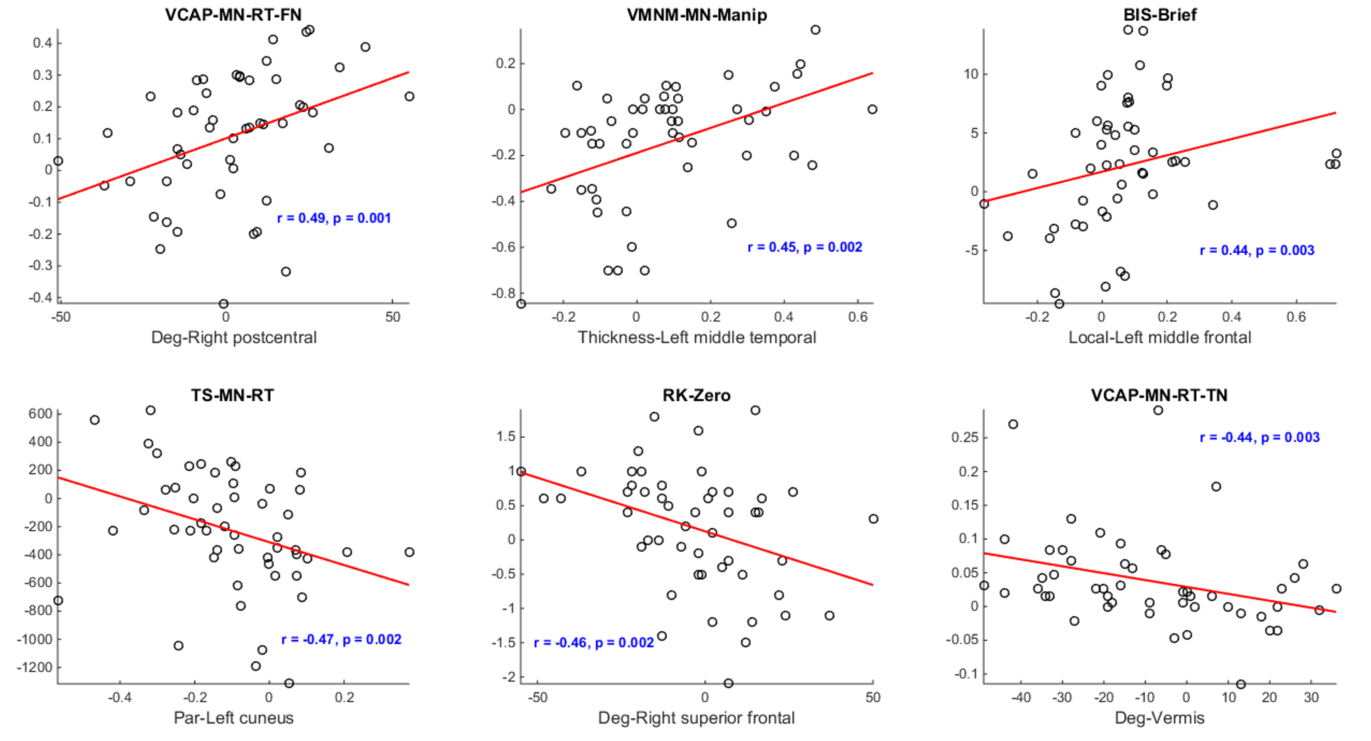
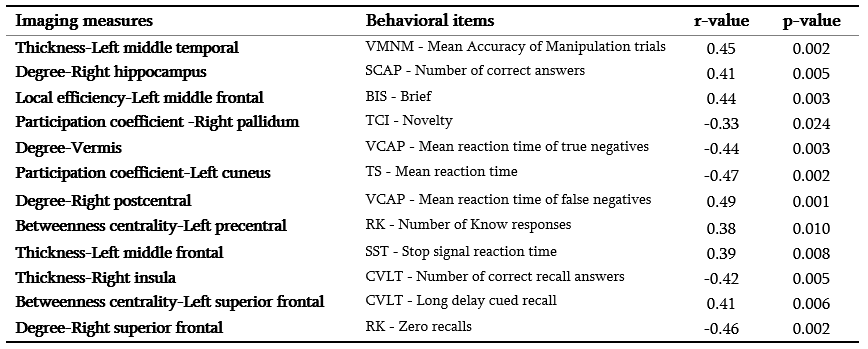
MRI preprocessing and feature extraction provided a vector with 602 features for each subject including 66 subcortical-related values, 72 cortical-related values, and 4 graph measures of 116 brain regions (602 = 66 + 72 + 4×116). The accuracy of performing all conventional models on different sets of features for classifying healthy and schizophrenic patients is shown in Fig. 1. The combination of all three sets of imaging measures brought the best accuracy of 67% using the RF classifier. As it is observed, there is an improvement after applying feature selection methods, with the best impact of MRMR and the 12 most relevant features with kNN: 79%. The accuracy of performing all conventional models on different sets of features for classifying healthy and schizophrenic patients is shown in Fig. 1. The model demonstrated high effectiveness (85% accuracy) in estimating the disease vs. control label for a new dataset acquired domestically. There was a drastic inequality between the numbers of samples for each subtype, as shown in Table 2. The disorganized subtype was eliminated since there was only one patient falling in this subtype. This elimination left us with four subtypes: Paranoid, Undifferentiated, Residual, and Schizoaffective. Although Schizoaffective is not a recognized schizophrenia subtype based on DCM-5, we still considered it in the classifiers to see the effect. The same procedure was adopted as the classification of patients vs. healthy controls. Fig. 2 shows the performance of 7 machine learning models and 9 sets of features on classifying the subtypes. The highest accuracy of 64% was derived from SVM with a linear kernel on 62 features obtained from MRMR. Table 1 lists the behavioral measures with the strongest correlations to each of the 12 imaging features selected by MRMR. Statistical analysis suggests a significant difference (p < 0.05). The degree of right postcentral and the verbal capacity task showed the highest correlation (r = 0.49, p = 0.001). The thickness of the left middle temporal and mean accuracy of manipulation trials in the VMNM task showed the second-highest positive connection (r = 0.45, p = 0.002). Both the participation coefficient of the left cuneus and the degree of vermis were negatively correlated with the reaction times of two cognitive tasks (r = -0.44, -0.47, p = 0.003, 0.002). The remaining negative correlations (r = -0.42, -0.46, p = 0.005, 0.002) were between two MRI measures and the recollection process of two tasks. Fig. 3 is showing the most positive and negative correlated imaging features and behavioral scales.Conclusion
The findings of this study underscore the utility of MRI and machine learning algorithms in enhancing the diagnostic process for schizophrenia. Furthermore, these methods hold promise for detecting both brain-related abnormalities and cognitive impairments associated with this disorder.Acknowledgements
No acknowledgement found.References
[1]. de Araujo, A. N., de Sena, E. P., de Oliveira, I. R., & Juruena, M. F. (2012). Antipsychotic agents: efficacy and safety in schizophrenia. Drug Healthc Patient Saf, 4, 173-180. doi:10.2147/DHPS.S37429.
[2]. Poldrack, R. A., Congdon, E., Triplett, W., Gorgolewski, K. J., Karlsgodt, K. H., Mumford, J. A., . . . Bilder, R. M. (2016). A phenome-wide examination of neural and cognitive function. Sci Data, 3, 160110. doi:10.1038/sdata.2016.110.
[3]. Yan, C.-G., Wang, X.-D., Zuo, X.-N., & Zang, Y.-F. (2016). DPABI: Data Processing & Analysis for (Resting-State) Brain Imaging. Neuroinformatics, 14(3), 339-351. doi:10.1007/s12021-016-9299-4
[4]. Gorgolewski, K. J., Durnez, J., & Poldrack, R. A. (2017). Preprocessed Consortium for Neuropsychiatric Phenomics dataset. F1000Res, 6, 1262. doi:10.12688/f1000research.11964.2.
[5]. Tzourio-Mazoyer, N., Landeau, B., Papathanassiou, D., Crivello, F., Etard, O., Delcroix, N., . . . Joliot, M. (2002). Automated anatomical labeling of activations in SPM using a macroscopic anatomical parcellation of the MNI MRI single-subject brain. Neuroimage, 15(1), 273-289. doi:10.1006/nimg.2001.0978.
[6]. Rubinov, M., & Sporns, O. (2010). Complex network measures of brain connectivity: uses and interpretations. Neuroimage, 52(3), 1059-1069. doi:10.1016/j.neuroimage.2009.10.003.
Figures