1716
Modulation of left anterior cingulate myo-Inositol in Lithium treatment of bipolar disorder1Cleveland Clinic Foundation, Cleveland, OH, United States, 2Brigham and Women’s Hospital, Boston, MA, United States
Synopsis
Keywords: Psychiatric Disorders, Spectroscopy
Motivation: There is limited information on anterior cingulate cortex (ACC) myo-inositol (m)I level in medication-free bipolar disorder (BD) patients in depressed state, which can explore role of neuro-inflammation in BD.
Goal(s): Investigate modulation of ACC mI level during Li monotherapy.
Approach: Patients with BD (depressed state) and healthy controls were scanned at 7-tesla MRI with a semi-LASER sequence at baseline and 2, 8 and 26 weeks from onset of Li monotherapy, and ACC mI level was measured at each time point.
Results: mI level decreased in 1st 2 weeks of onset of therapy but the reduction was not observed after 8 weeks.
Impact: The preliminary results suggest that decrease in neuro-inflammatory/microglial marker mI during Li monotherapy of depressed BD may be a short term effect. Future studies can investigate if this is specific to depressed state by investigating during manic state also.
Introduction
Bipolar disorder (BD) is characterized by periods of uncharacteristically elevated mood and depression.[1,2] Microglial activation and cytokine inflammation are suggested biomarkers of BD.[3,4] mI has been suggested to be a marker of glial activation [5-7] and neuro-inflammation.[8-10] BD has been associated with modulation in mI concentrations in frontal and temporal lobes, cingulate gyrus and basal ganglia.[11]Investigation of mI modulation at anterior cingulate cortex (ACC) is important because of its involvement in pathophysiology of BD.[12-14] However, no differences in ACC mI were observed between medication-free BD (depressed and different mood states) and healthy controls. [15,16]
Lithium (Li), having anti-inflammatory properties, is a commonly prescribed mood stabilizing drug in BD[17]. Higher ACC mI and brain Li levels have been reported to be related in older patients with BD.[18] Reduction in ACC (i) mI in healthy individuals 2 hours after Li administration,[19] (ii) mI/creatine (Cr) ratio ~7 days after acute lithium treatment in children with BD [20] and (iii) mI/Cr after 6-week of Li-induced euthymia[21] have been reported in BD.
Investigation of ACC mI level in medication-free patients in depressed state, which can explore role of neuro-inflammation in BD, is largely lacking. We investigated modulation of left dorsal/rostral ACC mI level during 26 weeks of Li therapy in medication-free patients with BD in depressed state.
Methods
Seventeen patients with BD (30±9 y, 3 M, fulfilling DSM-V criteria for BD with current depressive episode, 15<HAM-D<25, YMRS<8, ≥2 weeks without any psychotropic (medication-free for 5 weeks in case previously on fluoxetine), no Li therapy for past 6 months, 1 week without alcohol consumption) and 9 healthy controls (29±10 y, 3 M) were scanned at Siemens 7T Magnetom scanner with a 32-channel receive head coil under an IRB-approved protocol. Subjects were scanned at baseline (pre-therapy), and after 2, 8 and 26 weeks of Li monotherapy (started at 300 mg po bid and increased aiming for a blood level of 0.6 meq/l or as tolerated). MRI scans consisted of (i) localizer, T1-weighted MPRAGE anatomical scan (TR/TE=2250/2.97ms, matrix=256×256, FOV=204×204mm2, scan time 4-min 38-s) and (iii) semi-LASER (sLASER)[22] scan with VAPOR for water suppression[23] (TR/TE1/TE2/TE3=8000/9/11/9ms, 32 transients, scan time 4-min 24-s) scan of a 20×30×20mm3 voxel at left dorsal/rostral ACC (Fig. 1). In addition, unsuppressed water signals with RF off and on were acquired for eddy current correction and quantification respectively. MRspa (https://www.cmrr.umn.edu/downloads/mrspa/) was used to analyze sLASER data, which consisted of (i) Eddy current correction, (ii) frequency correction, (iii) phase correction, (iv) signal averaging, and (v) quantification using LCModel corrected for tissue voxel composition. Voxel segmentation was performed using BET and FAST algorithm[24] of FSL software library.[25] Data with >20% CRLB of mI fit were not used in analysis.Mean ACC mI levels of patients and controls at baseline were compared using unpaired t-test. Longitudinal mI data were analyzed using a linear mixed-effects model including visit (4 time-points), group (patients and controls) and their interaction as fixed effects, and a Gaussian random intercept at t participant level. Linear contrasts were applied to estimate changes in mI level at different visits and their difference. Statistical significance was established at two-sided P-value<0.05. %Coefficient of variation (%CV) of mI levels over 4 weeks was determined for healthy controls using data from 6 subjects with all 4 time-points.
Results and Discussion
A sample LCModel fitted spectrum is shown in Fig. 2. Two patients dropped out after 2 visits, and 3 patients and 1 control dropped out after 3 visits. After accounting for data with poor fit, baseline mI level were not significantly different between patients (N=16; 6.00±1.05 mM) and controls (N=9; 5.71±0.78 mM). %CV of mI for healthy controls was determined to be 10.46%. Evolution of mI levels over 4 visits for patients and controls are shown in Fig. 3. mI levels in patients decreased significantly change during 1st 2 weeks of Li therapy (P=0.003); however mI levels at 8 and 26 weeks did not differ significantly from baseline level. In addition, there was significant difference in changes in mI level (from baseline) to 2-week between patients and controls (P=0.02). Results from this preliminary study addressing depressed state of BD are in line with that observed in acute Li treatment and Li-induced euthymia.[20,21] However, this study suggests that reduction in mI is not a long-term effect and is reverted sometime between 2 and 8 weeks.Conclusion
Li-monotherapy decreases mI level at left dorsal/rostral ACC in otherwise medication-free patients with BD in depressed state in 1st 2 weeks of onset of therapy and the reduction is not observed after 8 weeks.Acknowledgements
This work was supported, in part, by the National Institutes of Health. We thank Sineyob Ahn, Siemens Healthineers, for support with sLASER sequence used in this study.References
[1] Anderson IM, Haddad PM, Scott J. Bipolar disorder. BMJ 2012;345:e8508.
[2] Association AP. Diagnostic and Statistical Manual of Mental Disorders Arlington: American Psychiatric Publishing; 2013.
[3] Pinto JV, Passos IC, Librenza-Garcia D, Marcon G, Schneider MA, Conte JH, et al. Neuron-glia Interaction as a Possible Pathophysiological Mechanism of Bipolar Disorder. Curr Neuropharmacol 2018;16:519-32.
[4] Dong XH, Zhen XC. Glial pathology in bipolar disorder: potential therapeutic implications. CNS Neurosci Ther 2015;21:393-7.
[5] Brand A, Richter-Landsberg C, Leibfritz D. Multinuclear NMR studies on the energy metabolism of glial and neuronal cells. Dev Neurosci 1993;15:289-98.
[6] Hattingen E, Raab P, Franz K, Zanella FE, Lanfermann H, Pilatus U. Myo-inositol: a marker of reactive astrogliosis in glial tumors? NMR Biomed 2008;21:233-41.
[7] Chang L, Munsaka SM, Kraft-Terry S, Ernst T. Magnetic resonance spectroscopy to assess neuroinflammation and neuropathic pain. J Neuroimmune Pharmacol 2013;8:576-93.
[8] Bitsch A, Bruhn H, Vougioukas V, Stringaris A, Lassmann H, Frahm J, et al. Inflammatory CNS demyelination: histopathologic correlation with in vivo quantitative proton MR spectroscopy. AJNR Am J Neuroradiol 1999;20:1619-27.
[9] Murray ME, Przybelski SA, Lesnick TG, Liesinger AM, Spychalla A, Zhang B, et al. Early Alzheimer's disease neuropathology detected by proton MR spectroscopy. J Neurosci 2014;34:16247-55.
[10] Pardon MC, Yanez Lopez M, Yuchun D, Marjanska M, Prior M, Brignell C, et al. Magnetic Resonance Spectroscopy discriminates the response to microglial stimulation of wild type and Alzheimer's disease models. Sci Rep 2016;6:19880.
[11] Silverstone PH, McGrath BM, Kim H. Bipolar disorder and myo-inositol: a review of the magnetic resonance spectroscopy findings. Bipolar Disord 2005;7:1-10.
[12] Sanches M, Amorim E, Mwangi B, Zunta-Soares GB, Soares JC. Smaller left anterior cingulate cortex in non-bipolar relatives of patients with bipolar disorder. Braz J Psychiatry 2019;41:254-6.
[13] Jelen LA, King S, Horne CM, Lythgoe DJ, Young AH, Stone JM. Functional magnetic resonance spectroscopy in patients with schizophrenia and bipolar affective disorder: Glutamate dynamics in the anterior cingulate cortex during a working memory task. Eur Neuropsychopharmacol 2019;29:222-34.
[14] Bouras C, Kovari E, Hof PR, Riederer BM, Giannakopoulos P. Anterior cingulate cortex pathology in schizophrenia and bipolar disorder. Acta Neuropathol 2001;102:373-9.
[15] Dager SR, Friedman SD, Parow A, Demopulos C, Stoll AL, Lyoo IK, et al. Brain metabolic alterations in medication-free patients with bipolar disorder. Arch Gen Psychiatry 2004;61:450-8.
[16] Cao B, Stanley JA, Selvaraj S, Mwangi B, Passos IC, Zunta-Soares GB, et al. Evidence of altered membrane phospholipid metabolism in the anterior cingulate cortex and striatum of patients with bipolar disorder I: A multi-voxel (1)H MRS study. J Psychiatr Res 2016;81:48-55.
[17] Nassar A, Azab AN. Effects of lithium on inflammation. ACS Chem Neurosci 2014;5:451-8.
[18] Forester BP, Finn CT, Berlow YA, Wardrop M, Renshaw PF, Moore CM. Brain lithium, N-acetyl aspartate and myo-inositol levels in older adults with bipolar disorder treated with lithium: a lithium-7 and proton magnetic resonance spectroscopy study. Bipolar Disord 2008;10:691-700.
[19] Singh N, Sharpley AL, Emir UE, Masaki C, Herzallah MM, Gluck MA, et al. Effect of the Putative Lithium Mimetic Ebselen on Brain Myo-Inositol, Sleep, and Emotional Processing in Humans. Neuropsychopharmacology 2016;41:1768-78.
[20] Davanzo P, Thomas MA, Yue K, Oshiro T, Belin T, Strober M, et al. Decreased anterior cingulate myo-inositol/creatine spectroscopy resonance with lithium treatment in children with bipolar disorder. Neuropsychopharmacology 2001;24:359-69.
[21] Soeiro-de-Souza MG, Scotti-Muzzi E, Fernandes F, De Sousa RT, Leite CC, Otaduy MC, et al. Anterior cingulate cortex neuro-metabolic changes underlying lithium-induced euthymia in bipolar depression: A longitudinal (1)H-MRS study. Eur Neuropsychopharmacol 2021;49:93-100.
[22] Scheenen TW, Heerschap A, Klomp DW. Towards 1H-MRSI of the human brain at 7T with slice-selective adiabatic refocusing pulses. MAGMA 2008;21:95-101.
[23] Tkac I, Starcuk Z, Choi IY, Gruetter R. In vivo 1H NMR spectroscopy of rat brain at 1 ms echo time. Magn Reson Med 1999;41:649-56.
[24] Zhang Y, Brady M, Smith S. Segmentation of brain MR images through a hidden Markov random field model and the expectation-maximization algorithm. IEEE Trans Med Imaging 2001;20:45-57.
[25] Smith SM, Jenkinson M, Woolrich MW, Beckmann CF, Behrens TE, Johansen-Berg H, et al. Advances in functional and structural MR image analysis and implementation as FSL. Neuroimage 2004;23 Suppl 1:S208-19.
Figures
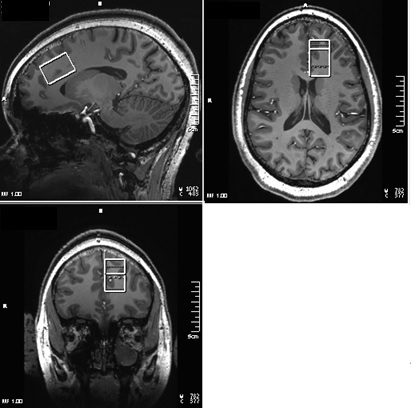
Fig. 1. 20×30×20 mm3 voxel prescribed at left dorsal/rostral ACC.
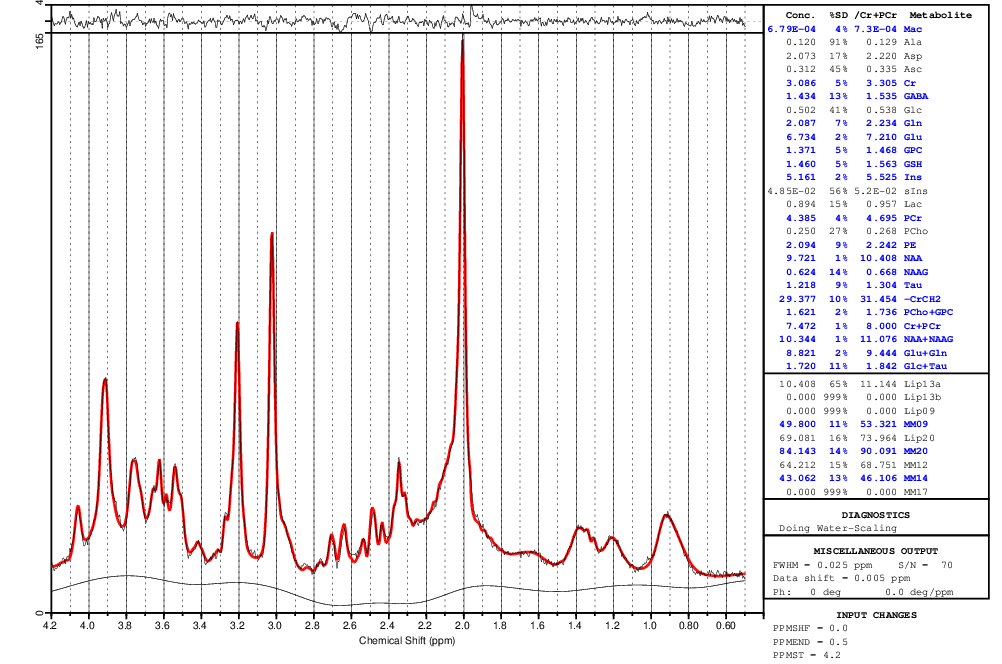
Fig. 2. Representative single subject LC Model fitted spectrum.
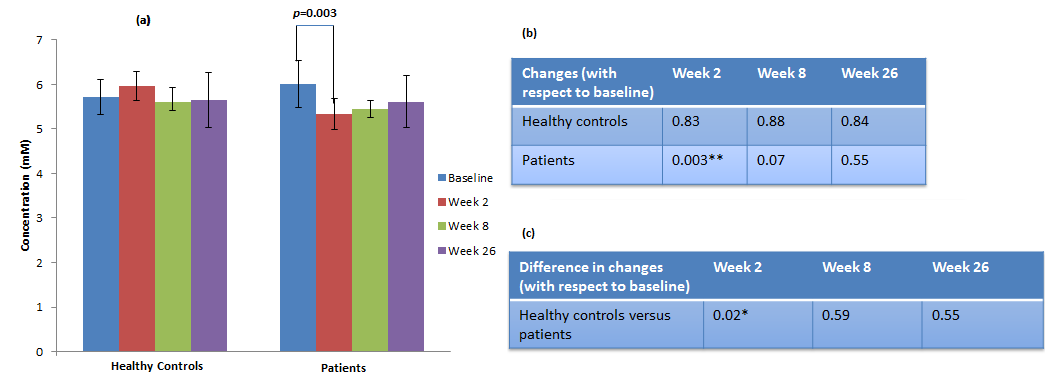
Fig. 3. (a) Evolution of left dorsal/rostral ACC mI level in healthy controls and patients during 4 visits over 26 weeks, p-values of (b) changes in mI level and (c) difference in changes in mI level between healthy controls and patients (*p<0.05, ** p<0.005).