1715
Mapping region-specific cerebrovascular reactivity in patients with major depressive disorder1Department of Biomedical Engineering, Zhejiang University, Hangzhou, China, 2Department of Radiology, Johns Hopkins University, Baltimore, MD, United States, 3Department of Diagnostic Radiology and Nuclear Medicine, University of Maryland, Baltimore, MD, United States
Synopsis
Keywords: Psychiatric Disorders, Psychiatric Disorders
Motivation: Impaired global cerebrovascular reactivity (CVR) has been reported in major depressive disorder (MDD). However, regional CVR has not been evaluated in MDD patients due to experimental difficulties.
Goal(s): The goal is to use a recently developed resting-state technique to map regional CVR in MDD patients.
Approach: Resting-state images was filtered and relative CVR index was calculated by regressing the voxel-wise BOLD signal against the reference signal.
Results: CVR was significantly reduced in occipital lobe in MDD. Temporal CVR was negatively correlated with illness duration, while psychomotor retardation was associated with elevated CVR in several emotion-related areas, including amygdala.
Impact: Current study indicated a region-specific relationship between cerebrovascular dysfunction and depression.
INTRODUCTION
A growing number of reports linked depression with cerebrovascular dysfunction, bi-directionally1. Patients with cerebrovascular diseases were easier to develop depressive disorders, leading to a hypothesis of ‘vascular depression’2. Several studies have shown evidence of altered cerebrovascular reactivity (CVR) in patients with MDD3-6. However, the majority of these studies only quantified global or large-artery level CVR and lack spatial information due to limited techniques. Recent development of CVR mapping methods using resting-state BOLD MRI allows region-specific measurement of CVR7-11. Therefore, in this study, we aimed to characterize the regional changes of CVR in MDD patients and investigate its relationship to clinical assessments.METHODS
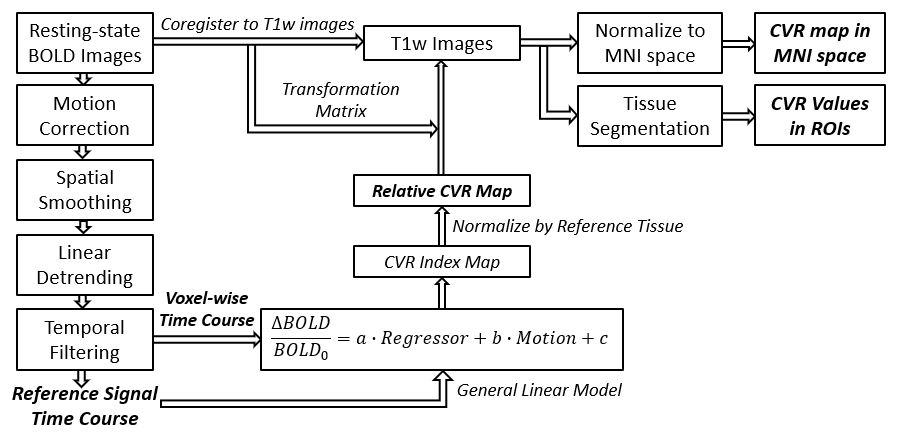
A total of 49 MDD patients (25.2±6.1yrs, 36 females) and 52 healthy controls (27.5±7.6yrs, 39 females) were enrolled. The patients had an average illness duration of 23.8±37.2 months. Patients with a history of severe organic brain disease or brain trauma, and/or alcohol and tobacco addiction or drug dependence were excluded.All MRI examinations were performed on a 3T GE SIGNA System. All participants underwent a resting-state BOLD scan with TR=2000ms, TE=30ms, voxel size=3.44×3.44×3.2mm3, and 200 repetitions. A T1-weighted 3D scan was also acquired. CVR quantification followed the method described in Liu et al.11 (Figure 1). Briefly, the BOLD images were first pre-processed and then temporally filtered using the optimal frequency range of 0 to 0.1164Hz. The resulted filtered BOLD signal time-courses were averaged across whole brain to obtain the reference time course. Then the relative CVR index was calculated by regressing the voxel-wise BOLD signal against the reference signal. In addition, BOLD images were co-registered to T1 space in order to quantify CVR in different ROIs.
A battery of clinical assessments was performed to examine the psychological status of these patients. Quantitative measurements of Hamilton Depression Scores (HAMD), Hamilton Anxiety Scores (HAMA), psychomotor retardation, cognitive impairment and sleeping difficulties were obtained.
Two levels of parcellation were considered for statistical analysis. The first one focused on major cortical grey matter regions, i.e. frontal, parietal, temporal, occipital and limbic regions. The second set includes 38 small ROIs throughout grey matter. CVR in different ROIs were first compared between MDD patients and controls using Wilcoxon rank sum test. Then the correlation between regional CVR and illness duration were examined. Finally, the association between CVR and clinical assessments were investigated using linear regression in which age, sex and medication-usage were included as covariates. Multiple comparison corrections were done for different ROIs using FDR approach.
RESULTS
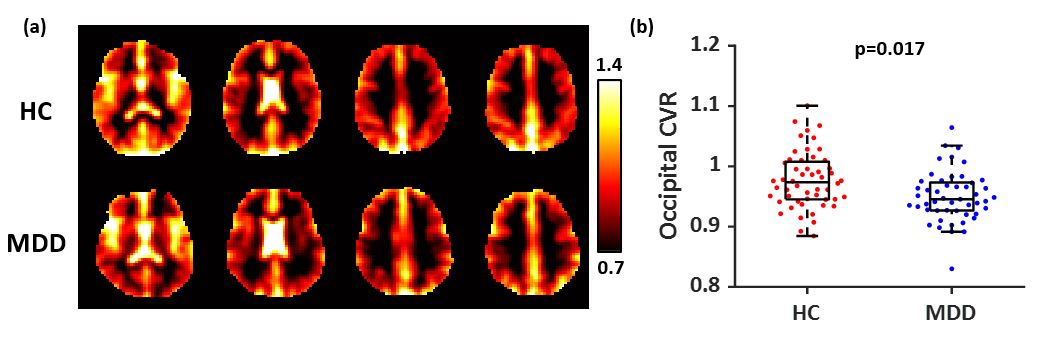
There were no significant age and sex differences between MDD and healthy control groups (p=0.84). The control group was more educated (controls: 16.6±2.7yrs, MDD: 14.2±2.8yrs, p<0.001) than MDD patients.Figure 2a shows representative CVR maps from one healthy control and one MDD patient. It was found that compared with healthy controls, MDD patients revealed a significant decreased CVR in occipital cortex (controls: 0.98±0.047, MDD: 0.95±0.042, p=0.017, Figure 2b). Further analyses within the occipital cortex showed that CVR was predominantly reduced in the middle occipital gyrus (p=0.030), inferior occipital gyrus (p=0.0092), cuneus (p=0.0013) and lingual gyrus (p=0.0058).
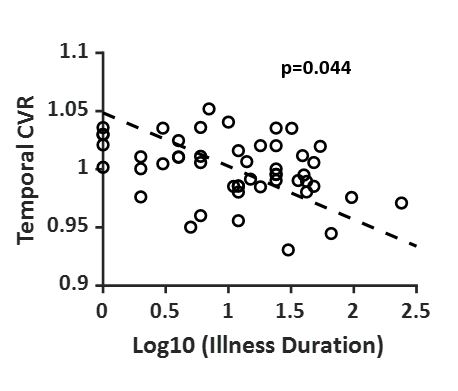
It was also found that CVR in temporal lobe was negatively correlated with the log transform of illness duration (r=-0.37, p=0.044, Figure 3). Within temporal lobe, superior temporal gyrus (STG, p=0.047) and fusiform gyrus (FuG, p=0.043) showed a significantly reduced CVR.
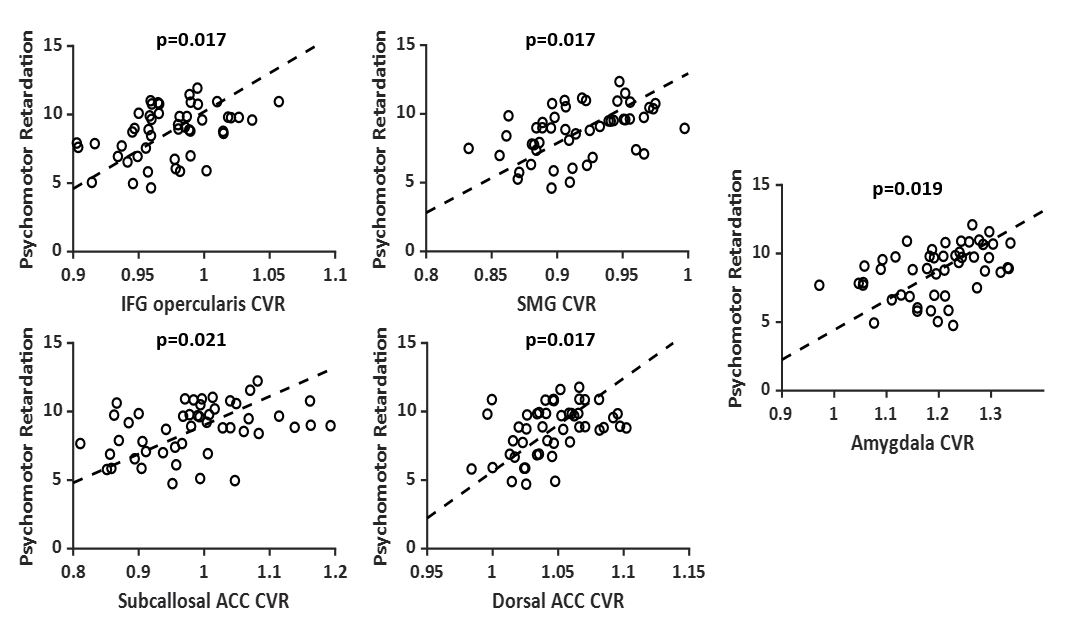
In addition, linear regression analysis showed that patients with more severe psychomotor retardation had significantly higher CVR in inferior frontal gyrus (IFG) pars opercularis (β=23.5, p=0.017), supramarginal gyrus (SMG, β=22.3, p=0.017), subcallosal anterior cingulate cortex (ACC, β=8.0, p=0.021), dorsal ACC (β=28.8, p=0.017) and amygdala (β=8.60, p=0.019).
DISCUSSION AND CONCLUSION
Recent study using ultrasound showed that CVR was blunted in middle cerebral artery for MDD patients but not changed in internal carotid artery, suggesting a region-dependent alterations in cerebrovascular regulation12 and supporting our usage of resting-state CVR mapping method, as it cannot provide absolute CVR despite a good spatial resolution for detection of regional differences.Our finding of reduced CVR in occipital cortex may be related to the pathogenesis of impaired visual perception and reduced attention, leading to selective bias in processing and interpretation of emotional information13. Decreased CVR in temporal cortex especially STG may indicate abnormalities in the affective network due to deficiency in oxygen and nutrients. On the other hand, increased CVR in amygdala, ACC, IFG and SMG in patients with severe psychomotor retardation may suggest a shift of cerebrovascular supply, resulting in a persistent negative mood and slowing of activities. These results suggested a region-specific relationship between cerebrovascular dysfunction and depression.
Acknowledgements
No acknowledgement found.References
1. Ramasubbu R. Relationship between depression and cerebrovascular disease: conceptual issues. Journal of Affective Disorders 2000; 57: 1-11. DOI: https://doi.org/10.1016/S0165-0327(99)00101-9.
2. Alexopoulos GS, Meyers BS, Young RC, et al. 'Vascular Depression' Hypothesis. Archives of General Psychiatry 1997; 54: 915-922. DOI: 10.1001/archpsyc.1997.01830220033006.
3. Lemke H, Castro AG-Cd, Schlattmann P, et al. Cerebrovascular reactivity over time-course – From major depressive episode to remission. Journal of Psychiatric Research 2010; 44: 132-136. DOI: https://doi.org/10.1016/j.jpsychires.2009.06.010.
4. Neu P, Schlattmann P, Schilling A, et al. Cerebrovascular reactivity in major depression: a pilot study. Psychosom Med 2004; 66: 6-8. 2004/01/30. DOI: 10.1097/01.psy.0000107880.03026.54.
5. Vakilian A and Iranmanesh F. Assessment of cerebrovascular reactivity during major depression and after remission of disease. Annals of Indian Academy of Neurology 2010; 13: 52-56. Original Article. DOI: 10.4103/0972-2327.61278.
6. de Castro AG, Bajbouj M, Schlattmann P, et al. Cerebrovascular reactivity in depressed patients without vascular risk factors. J Psychiatr Res 2008; 42: 78-82. 2006/11/23. DOI: 10.1016/j.jpsychires.2006.10.001.
7. Liu P, Li Y, Pinho M, et al. Cerebrovascular reactivity mapping without gas challenges. Neuroimage 2017; 146: 320-326. 2016/11/27. DOI: 10.1016/j.neuroimage.2016.11.054.
8. Lipp I, Murphy K, Caseras X, et al. Agreement and repeatability of vascular reactivity estimates based on a breath-hold task and a resting state scan. Neuroimage 2015; 113: 387-396. 2015/03/22. DOI: 10.1016/j.neuroimage.2015.03.004.
9. Golestani AM, Wei LL and Chen JJ. Quantitative mapping of cerebrovascular reactivity using resting-state BOLD fMRI: Validation in healthy adults. Neuroimage 2016; 138: 147-163. 2016/05/15. DOI: 10.1016/j.neuroimage.2016.05.025.
10. Jahanian H, Christen T, Moseley ME, et al. Measuring vascular reactivity with resting-state blood oxygenation level-dependent (BOLD) signal fluctuations: A potential alternative to the breath-holding challenge? J Cereb Blood Flow Metab 2017; 37: 2526-2538. 2016/09/30. DOI: 10.1177/0271678x16670921.
11. Liu P, Liu G, Pinho MC, et al. Cerebrovascular Reactivity Mapping Using Resting-State BOLD Functional MRI in Healthy Adults and Patients with Moyamoya Disease. Radiology 2021; 299: 419-425. 2021/03/10. DOI: 10.1148/radiol.2021203568.
12. Darling AM, Richey RE, Akins JD, et al. Cerebrovascular reactivity is blunted in young adults with major depressive disorder: The influence of current depressive symptomology. Journal of Affective Disorders 2021; 295: 513-521. DOI: https://doi.org/10.1016/j.jad.2021.08.061.
13. Elliott R, Rubinsztein JS, Sahakian BJ, et al. The Neural Basis of Mood-Congruent Processing Biases in Depression. Archives of General Psychiatry 2002; 59: 597-604. DOI: 10.1001/archpsyc.59.7.597.
Figures