1707
T2-Weighted MR Neurography and Muscle Evaluation Using GRAPPATINI T2 Mapping1Weill Cornell Medicine, New York, NY, United States, 2Department of Radiology and Imaging, Hospital for Special Surgery, New York, NY, United States, 3Department of Medical Imaging and Intervention, Chang Gung Memorial Hospital, Linkou, Taiwan, 4Advanced Clinical Imaging Technology, Siemens Healthineers International AG, Lausanne, Switzerland, 5Department of Radiology, Lausanne University Hospital and University of Lausanne, Lausanne, Switzerland, 6LTS5, Ecole Polytechnique Fédérale de Lausanne (EPFL), Lausanne, Switzerland, 7Siemens Medical Solutions USA, Inc., New York, NY, United States
Synopsis
Keywords: Neurography, Nerves, Muscle
Motivation: To evaluate the feasibility and reliability of an accelerated T2 mapping technique (GRAPPATINI) for MR neurography and muscle evaluation.
Goal(s): The study aims to qualitatively and quantitatively evaluate GRAPPATINI for MR neurography in patients with foot drop.
Approach: To compare the image quality from GRAPPATINI T2-weighted images against conventional T2-weighted images, and to compare T2 values between abnormal and normal muscles.
Results: No significant qualitative differences were observed between GRAPPATINI and conventional images diagnostically; there was complete agreement in assessment of nerve signal hyperintensity and size, and muscle edema. Significant differences in GRAPPATINI T2 values were observed between abnormal and normal muscles.
Impact: In one acquisition, GRAPPATINI can simultaneously provide clinically equivalent qualitative information and quantitative T2 maps for MR neurography evaluation of foot drop.
Introduction
MR neurography (MRN) utilizes fat-suppressed T2-weighted imaging to detect peripheral nerves and muscle pathology (1,2). T2-weighting is fluid-sensitive, assessing nerve and muscle edema (3), nerve and muscle morphology (4,5), and fatty infiltration in chronic muscle abnormalities (6). However, diagnostic MRN assessment can be subjective. Furthermore, as T2-weighted signal is qualitative, quantitative characterization of peripheral neuropathies is challenging in cross-sectional and longitudinal studies. Quantitative T2 mapping detects muscle edema in denervation (7) and correlates better with electromyography than qualitative T2-weighted imaging. T2 values may also quantitatively assess peripheral neuropathy (8). However, T2 mapping typically requires a separate acquisition from qualitative MRN and image registration for analysis. Higher spatial resolution T2-mapping is also time-intensive (>6 minutes), impeding routine clinical incorporation. To accelerate T2 mapping, conventional undersampling in k-space with parallel imaging such as GRAPPA may improve scan times (9), and further undersampling with model-based reconstruction using GRAPPATINI provides further acceleration (10) along with T2-weighted images for qualitative evaluation. This study aimed to evaluate the GRAPPATINI sequence in MRN of foot drop for its application in qualitative diagnostic interpretation and quantitative T2 values. We hypothesized that GRAPPATINI would yield similar image quality to conventional T2-weighted images and demonstrate significant T2 differences between abnormal and normal muscles and nerves in subjects with foot drop.Methods
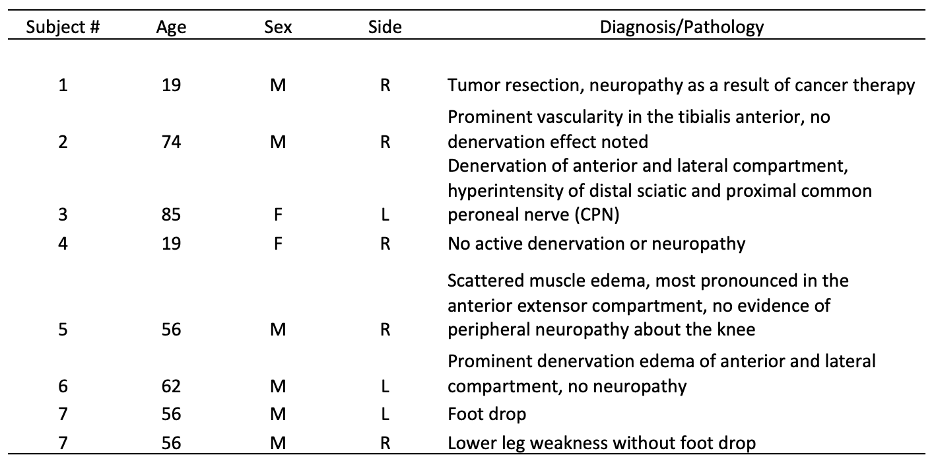
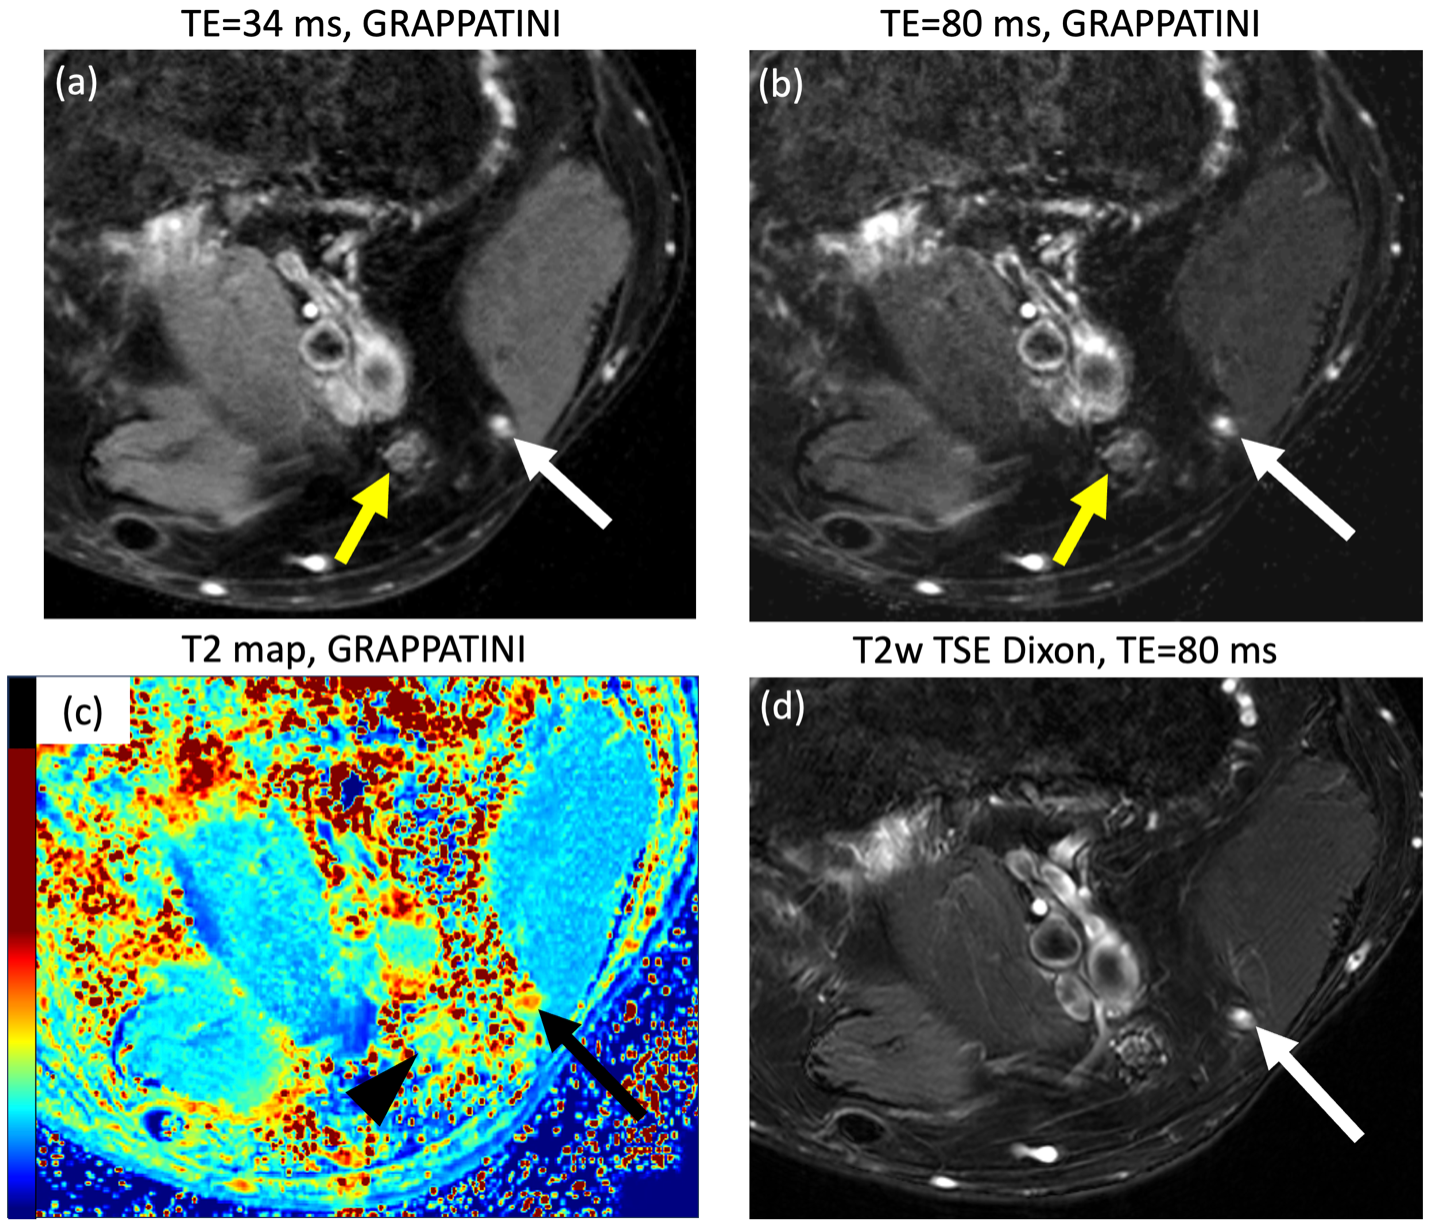
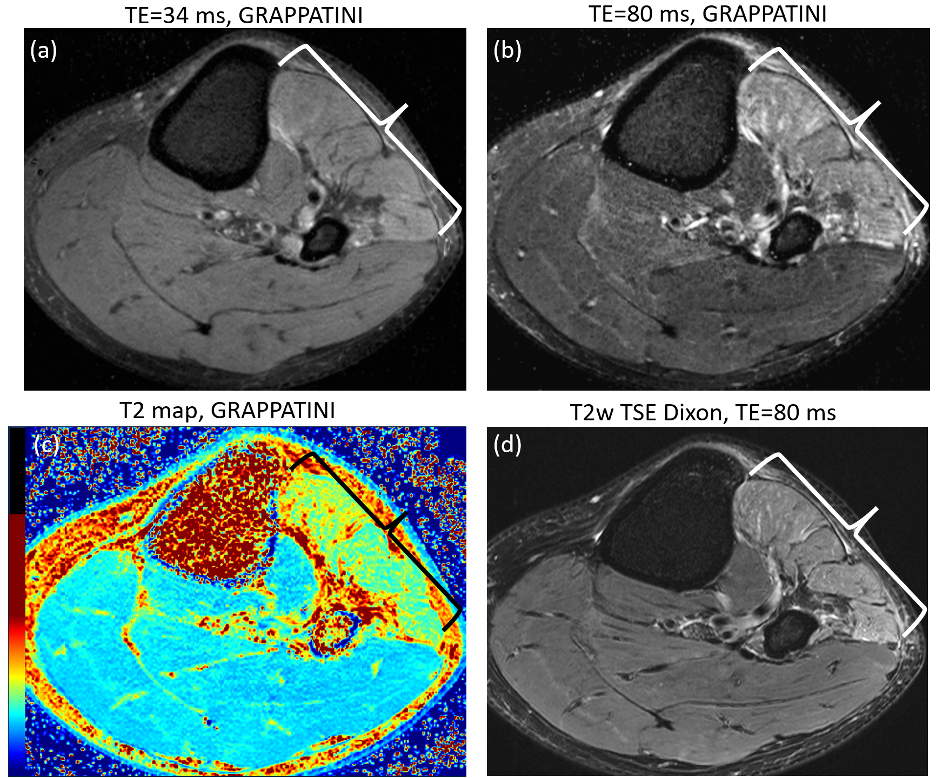
Subjects – This was a prospective, cross-sectional study approved by the Institutional Review Board (IRB #2021-1573). The study included 7 patients (8 exams, one bilateral) undergoing MRN evaluation at the knee, the majority for foot drop (Table 1).MR Acquisition – GRAPPATINI is a model-based approach for rapid T2 quantification based on undersampling of the k-space (MARTINI), extended by parallel imaging (GRAPPA), and provides synthetic T2-weighted images at arbitrary echo times. An axial GRAPPATINI research sequence was acquired (TR=2020 msec, echoes=10, GRAPPA=2, MARTINI=3, scan time=3-5 min) centered at the tibialis anterior (the muscle responsible for ankle dorsiflexion). Synthetic T2-weighted images (TE=34 ms and 80 ms) were obtained, with the TE=80 ms images selected for comparison against routine T2-weighted, fat-suppressed MRN images with similar scan times and TR/TE (T2w-turbo-spin-echo (T2w-TSE) with Dixon).
Qualitative Evaluation – Comparisons between the T2w-TSE and GRAPPATINI TE=80 ms images for image quality and diagnostic features were performed by a musculoskeletal radiologist with 5 years of experience and blinded to the sequence type. These included: visualization of nerve fascicular architecture and muscle architecture (0: poor, 1: average, 2: good), diagnostic confidence (0: non-diagnostic, 1: low, 2: high), nerve hyperintensity, nerve enlargement, and muscle edema (0: no, 1: yes).
Quantitative T2 – Muscle segmentation was performed by a medical student (with radiologist supervision) nerve segmentation was performed by a radiologist with 5 years of experience using ITK-SNAP (11). For each subject, abnormal and normal muscles, based on the clinical MRI report, were selected for analysis on 3 image slices. For each subject, nerve segmentation was performed on the common peroneal nerve, whether normal or abnormal, alongside another normal nerve in the field of view for comparison.
Statistics – Interquartile ranges were determined, and non-parametric paired comparisons were performed between the sequences for image quality. Agreement (in %) was determined for diagnostic features. A two-sample t-test was performed between abnormal and normal muscle T2. A p-value <0.05 was deemed statistically significant.
Results
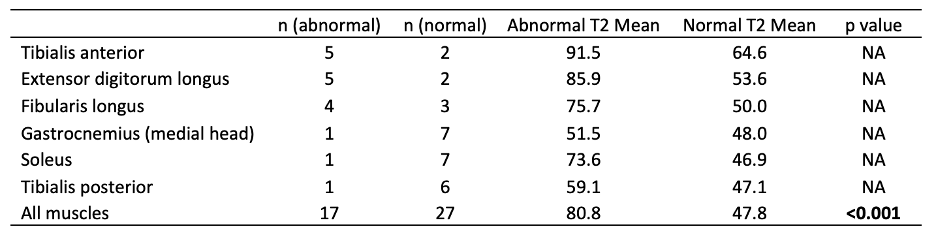
Qualitative Analysis – Scores were not significantly different for nerve visualization (p=0.57), muscle visualization (p=1), or diagnostic confidence (p=0.32) between the T2w-Dixon and GRAPPATINI TE=80 sequences (Table 2). There were 4 cases of nerve hyperintensity, 1 case of nerve enlargement, and 7 cases of muscle edema, with 100% diagnostic agreement between both sequences.Quantitative Analysis – GRAPPATINI T2 values for abnormal and normal tibialis anterior, extensor digitorum longus, peroneus longus, gastrocnemius (medial head), soleus, and the tibialis posterior muscles were compared, demonstrating significantly higher T2 values (80.8 ms vs 47.8 ms, p<0.001) than normal muscles (Table 3). Mean T2 values of abnormal nerves were higher than normal nerves (70.2 ms vs 60.6 ms), with no statistical comparisons made due to the small sample size (n=4 for abnormal nerves).
Discussion
The GRAPPATINI technique provided adequate qualitative assessment of nerve visualization, muscle visualization, diagnostic confidence, and similar diagnostic interpretation to a conventional MRN sequence in assessing patients with foot drop. Additionally, GRAPPATINI provided quantitative T2 values that differentiated abnormal from normal muscles and may potentially apply to nerves as well.This preliminary study was limited by the small sample size and interpretation of imaging data by a single radiologist, which limits the generalizability of the findings. These are preliminary results of an ongoing prospective study targeting n=30 foot drop patients.
Acknowledgements
No acknowledgement found.References
1. Filler AG, Maravilla KR, Tsuruda JS. MR neurography and muscle MR imaging for image diagnosis of disorders affecting the peripheral nerves and musculature. Neurol Clin. Aug 2004;22(3):643-82, vi-vii. doi:10.1016/j.ncl.2004.03.005
2. Kamath S, Venkatanarasimha N, Walsh MA, Hughes PM. MRI appearance of muscle denervation. Skeletal Radiol. May 2008;37(5):397-404. doi:10.1007/s00256-007-0409-0
3. Chhabra A, Faridian-Aragh N, Chalian M, et al. High-resolution 3-T MR neurography of peroneal neuropathy. Skeletal Radiol. Mar 2012;41(3):257-71. doi:10.1007/s00256-011-1146-y
4. Chhabra A, Chalian M, Soldatos T, et al. 3-T high-resolution MR neurography of sciatic neuropathy. AJR Am J Roentgenol. Apr 2012;198(4):W357-64. doi:10.2214/ajr.11.6981
5. Kalia V, Leung DG, Sneag DB, Del Grande F, Carrino JA. Advanced MRI Techniques for Muscle Imaging. Semin Musculoskelet Radiol. Sep 2017;21(4):459-469. doi:10.1055/s-0037-1604007
6. Kim HS, Yoon YC, Choi BO, Jin W, Cha JG. Muscle fat quantification using magnetic resonance imaging: case-control study of Charcot-Marie-Tooth disease patients and volunteers. J Cachexia Sarcopenia Muscle. Jun 2019;10(3):574-585. doi:10.1002/jcsm.12415
7. Argentieri EC, Tan ET, Whang JS, et al. Quantitative T(2) -mapping magnetic resonance imaging for assessment of muscle motor unit recruitment patterns. Muscle Nerve. May 2021;63(5):703-709. doi:10.1002/mus.27186
8. Sveinsson B, Rowe OE, Stockmann JP, et al. Feasibility of simultaneous high-resolution anatomical and quantitative magnetic resonance imaging of sciatic nerves in patients with Charcot-Marie-Tooth type 1A (CMT1A) at 7T. Muscle Nerve. Aug 2022;66(2):206-211. doi:10.1002/mus.27647
9. Griswold MA, Jakob PM, Heidemann RM, et al. Generalized autocalibrating partially parallel acquisitions (GRAPPA). Magn Reson Med. Jun 2002;47(6):1202-10. doi:10.1002/mrm.10171
10. Hilbert T, Sumpf TJ, Weiland E, et al. Accelerated T(2) mapping combining parallel MRI and model-based reconstruction: GRAPPATINI. J Magn Reson Imaging. Aug 2018;48(2):359-368. doi:10.1002/jmri.25972
11. Riff AJ, Chalmers PN, Sgroi T, et al. Epidemiologic Comparison of Pitching Mechanics, Pitch Type, and Pitch Counts Among Healthy Pitchers at Various Levels of Youth Competition. Arthroscopy. Aug 2016;32(8):1559-68. doi:10.1016/j.arthro.2016.01.048
Figures