1704
Integrated CrCEST MRI and Downfield MR Spectroscopy to Achieve Muscle Specific OXPHOS Measurement with Personalized Exercise Regimes1Department of Bioengineering, University of Pennsylvania, Philadelphia, PA, United States, 2Department of Radiology, University of Pennsylvania, Philadelphia, PA, United States, 3Department of Biostatistics, University of Pennsylvania, Philadelphia, PA, United States, 4Department of Nutrition and Science, Cornell University, Ithaca, NY, United States, 5Division of Endocrinology and Diabetes, Children's Hospital of Philadelphia, Philadelphia, PA, United States
Synopsis
Keywords: CEST / APT / NOE, CEST & MT
Motivation: CrCEST measurements are sensitive to the changes in muscle pH, which confound the measurement and interpretation of τCr. Our motivation was to develop a technique that removed acidic bias from CrCEST measurements to ensure OXPHOS measurement.
Goal(s): Develop a personalized mild exercise technique that limits acidosis in the calf to ensure measurement of OXPHOS using CrCEST.
Approach: To test the dependence of CrCEST recovery time on pH with different exercise regimes.
Results: Carnosine 1HMRS can be used to quickly measure pH change induced by a prescribed exercise regime and can facilitate an unbiased measurement of personalized muscle group specific OXPHOS capacity with CrCEST.
Impact: Carnosine 1HMRS can be used to quickly measure pH change induced by a prescribed exercise regime and can facilitate an unbiased measurement of personalized muscle group specific OXPHOS capacity with CrCEST.
Introduction
CrCEST is an emerging high resolution and noninvasive method for measuring muscle specific oxidative phosphorylation (OXPHOS) via the creatine recovery time(τCr). It has been shown that increased τCr is characteristic of less efficient OXPHOS.1 However, as CrCEST is sensitive to pH changes, intracellular pH changes due to exercise can bias τCr measurements. To combat this issue, a method to measure pH pre- and post-exercise recovery and its impact on CrCEST MRI is clearly needed. Traditionally, approaches to reduce this effect have been to employ mild exercise or measure pH shift using 31P magnetic resonance spectroscopy (MRS). Yet, variations in individual exercise capacity lead to differing pH levels and 31P-MRS necessitates additional coils as well as increased prep and scan time. Alternatively, downfield 1H-MRS (DFMRS) can detect chemical shifts in carnosine induced by pH change.2,3 In this study, we define a mild and moderate/intense exercise by using maximum voluntary contraction (MVC) and integrating 1H-MR carnosine spectroscopy with 3D CrCEST.Methods
Twenty-seven healthy subjects (14M; age range 21-42) were enrolled in an approved institutional review board protocol, and written informed consent was obtained. Two different types of plantar-flexion exercise, mild and moderate/intense, were performed in-magnet. Ten subjects performed mild exercise and seventeen participants performed both mild and moderate/intense exercise. Mild exercise was defined to be 10% MVC, 20 beats-per-minute (BPM) for two minutes, and having a pH shift ≤ 0.1 units. Moderate/intense exercise was 20% MVC, 30 BPM, exercise until exhaustion, and a pH shift > 0.1 units.All scans were performed on a 7T MRI scanner (MAGNETOM Terra, Siemens Healthcare, Erlangen, Germany) with a 28-channel phased-array knee coil (Quality Electrodynamics, Mayfield Village, USA). In each session, baseline carnosine was measured in the medial gastrocnemius (MG) and lateral gastrocnemius (LG) followed by mild exercise, and then post-exercise measurements were acquired to assess pH shift in each calf region. A ten-minute break was given to allow for pH recovery before beginning CrCEST. Then baseline B0 map4, B1+ map5, and four averages of CrCEST were acquired. Subsequently, mild exercise was repeated and then sixteen CrCEST averages, B0 map, and B1+ map were acquired. Subjects participating in intense exercise then performed the in-magnet intense exercise. Following exercise, CrCEST and carnosine spectroscopy were acquired in an interleaved fashion. First three averages of CrCEST(90s) were acquired, followed by a carnosine spectrum(22s) in the calf region that exhibited the greatest pH shift during the mild exercise. Thereafter, 12 more averages of CrCEST were acquired as well as a B0map and B1+ map.
The same parameters and calculation of CrCEST, WASSR, and B1+ map are the same as in our previous work.6,7 No B1+ correction was performed; instead, placement of a dielectric pad on the LG helped to improve relative B1+inhomogeneity.8,9
The DFMRS pulse sequence and optimal reference voltage calibration are the same as in previous work. 10,11 The spectrally selective 90° E-BURP pulse12 was centered at 7.7 ppm with the following parameters: TR/TE: 1400/18ms, 16 averages, BW: 2kHz.
Spearman correlation coefficients were used to calculate the strength and direction of association between recovery rate and change in pH.
Results
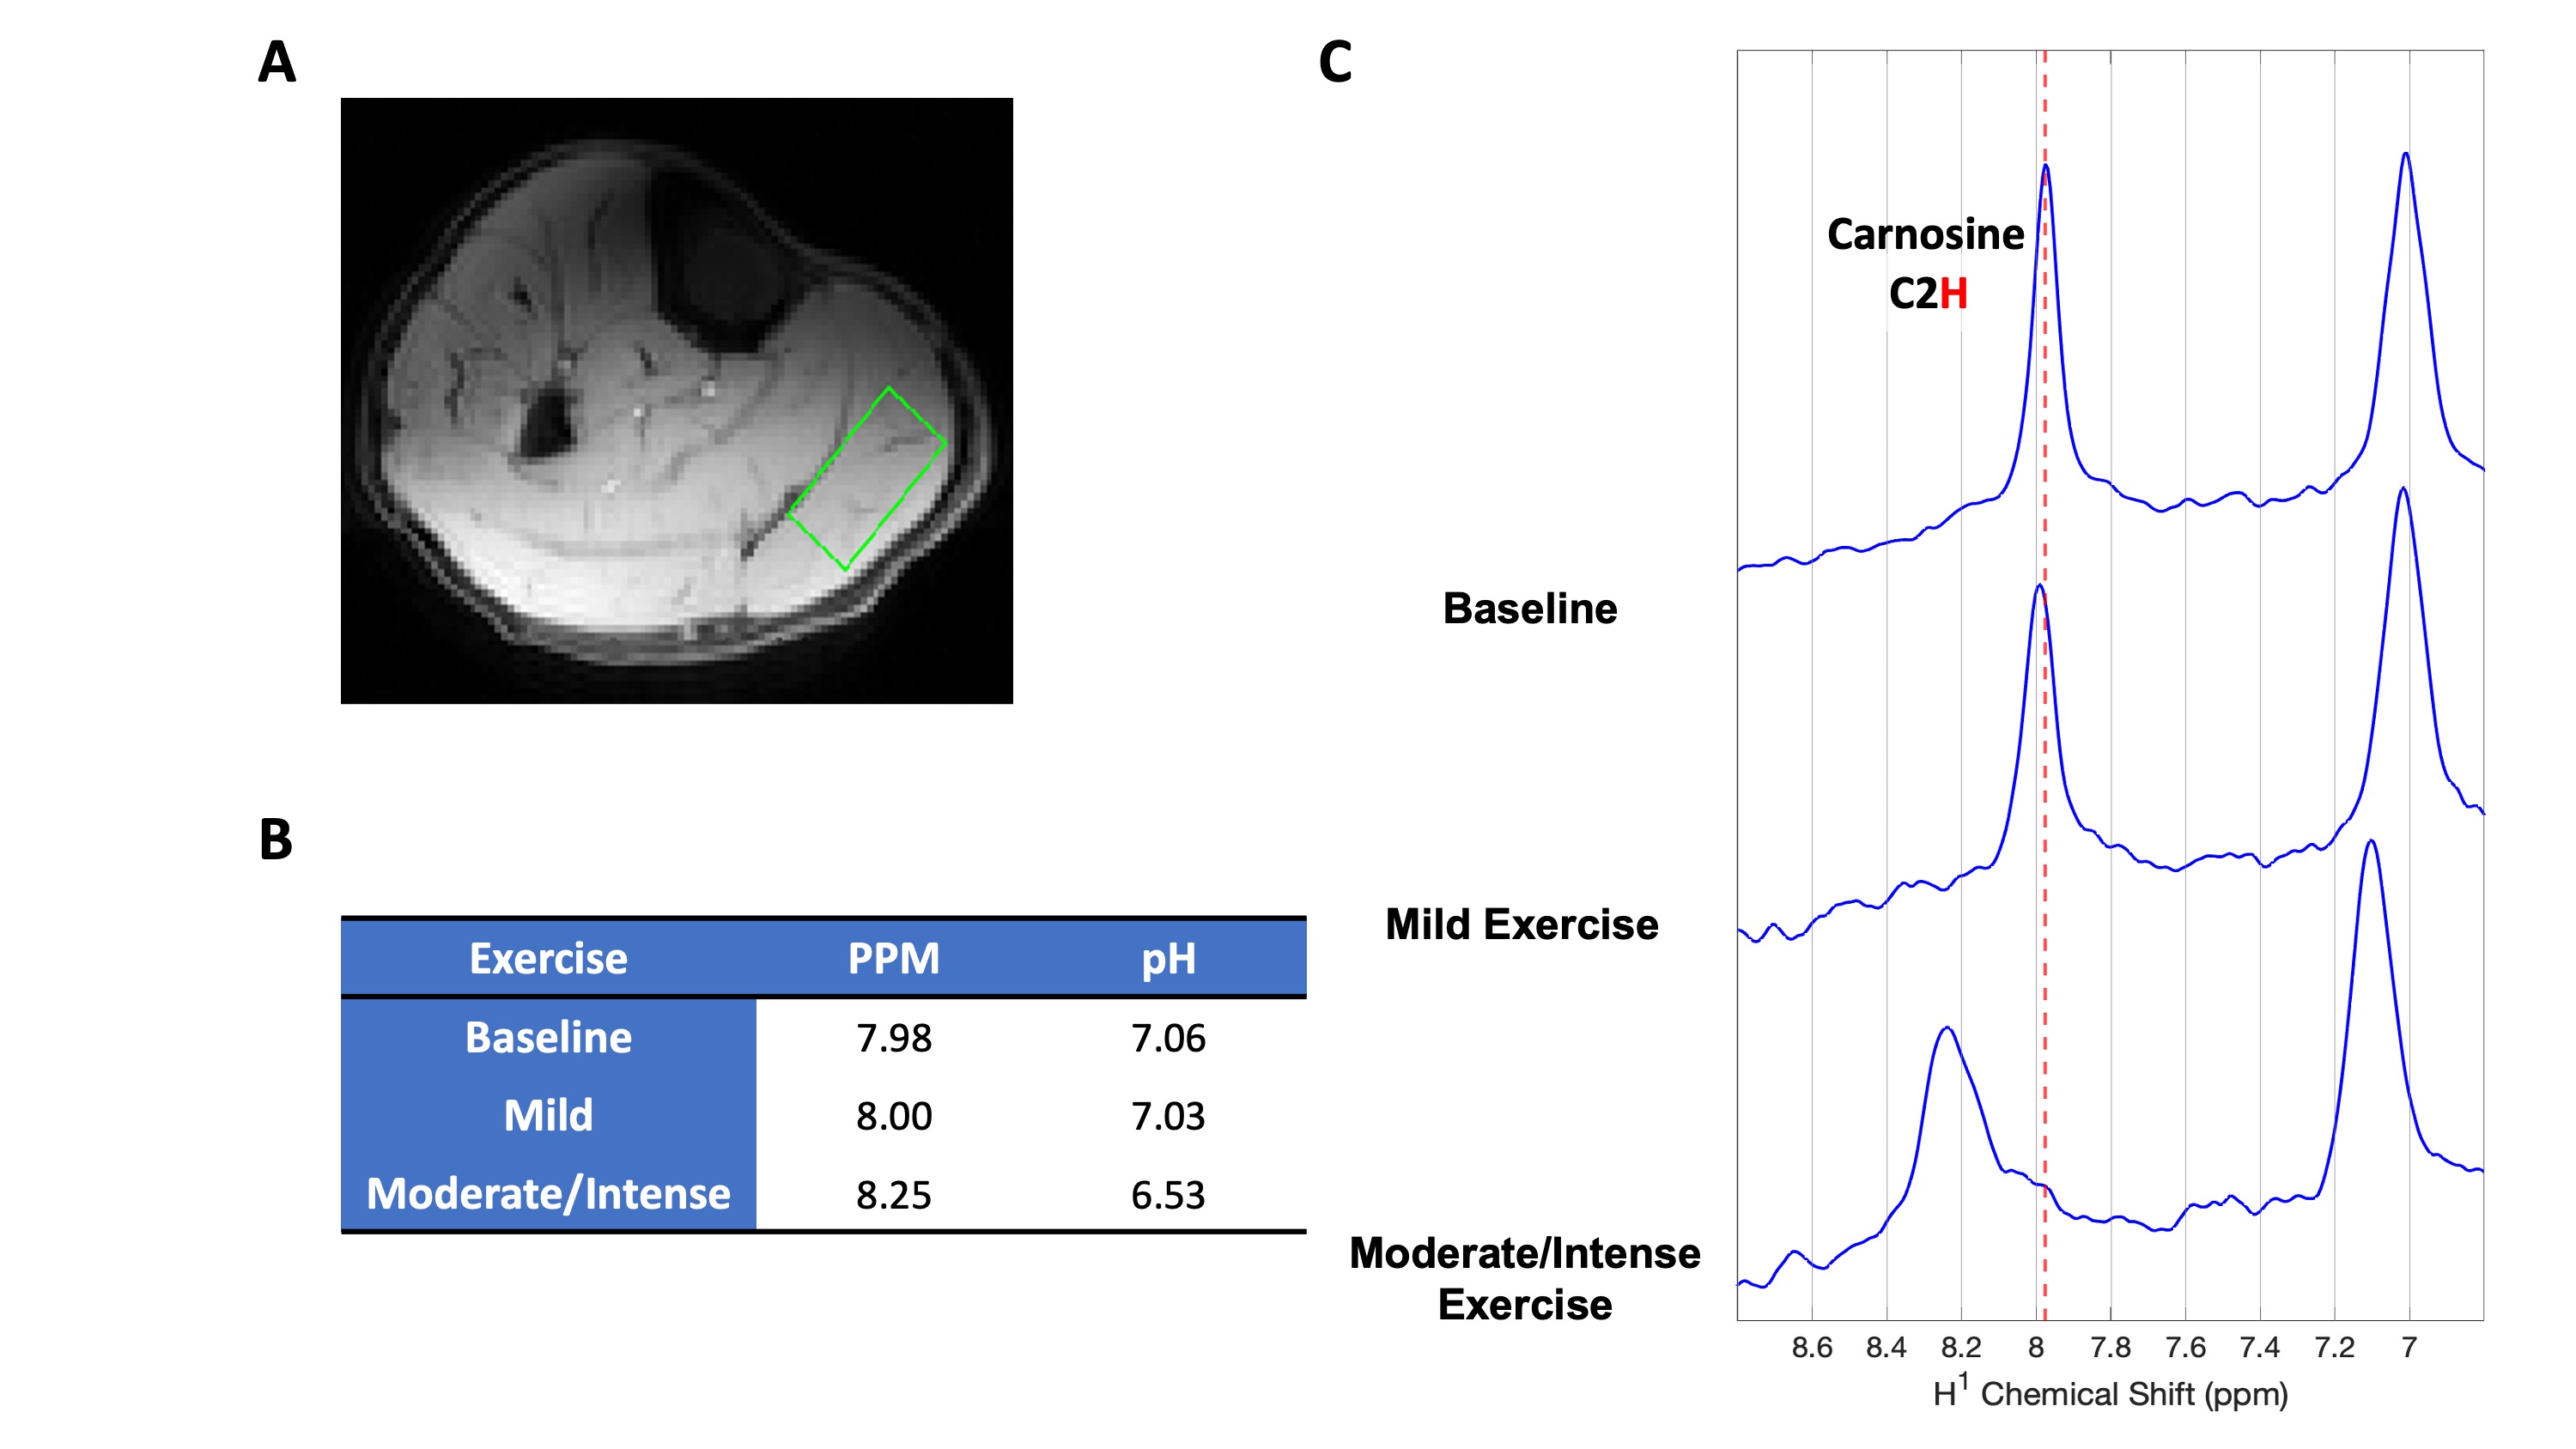
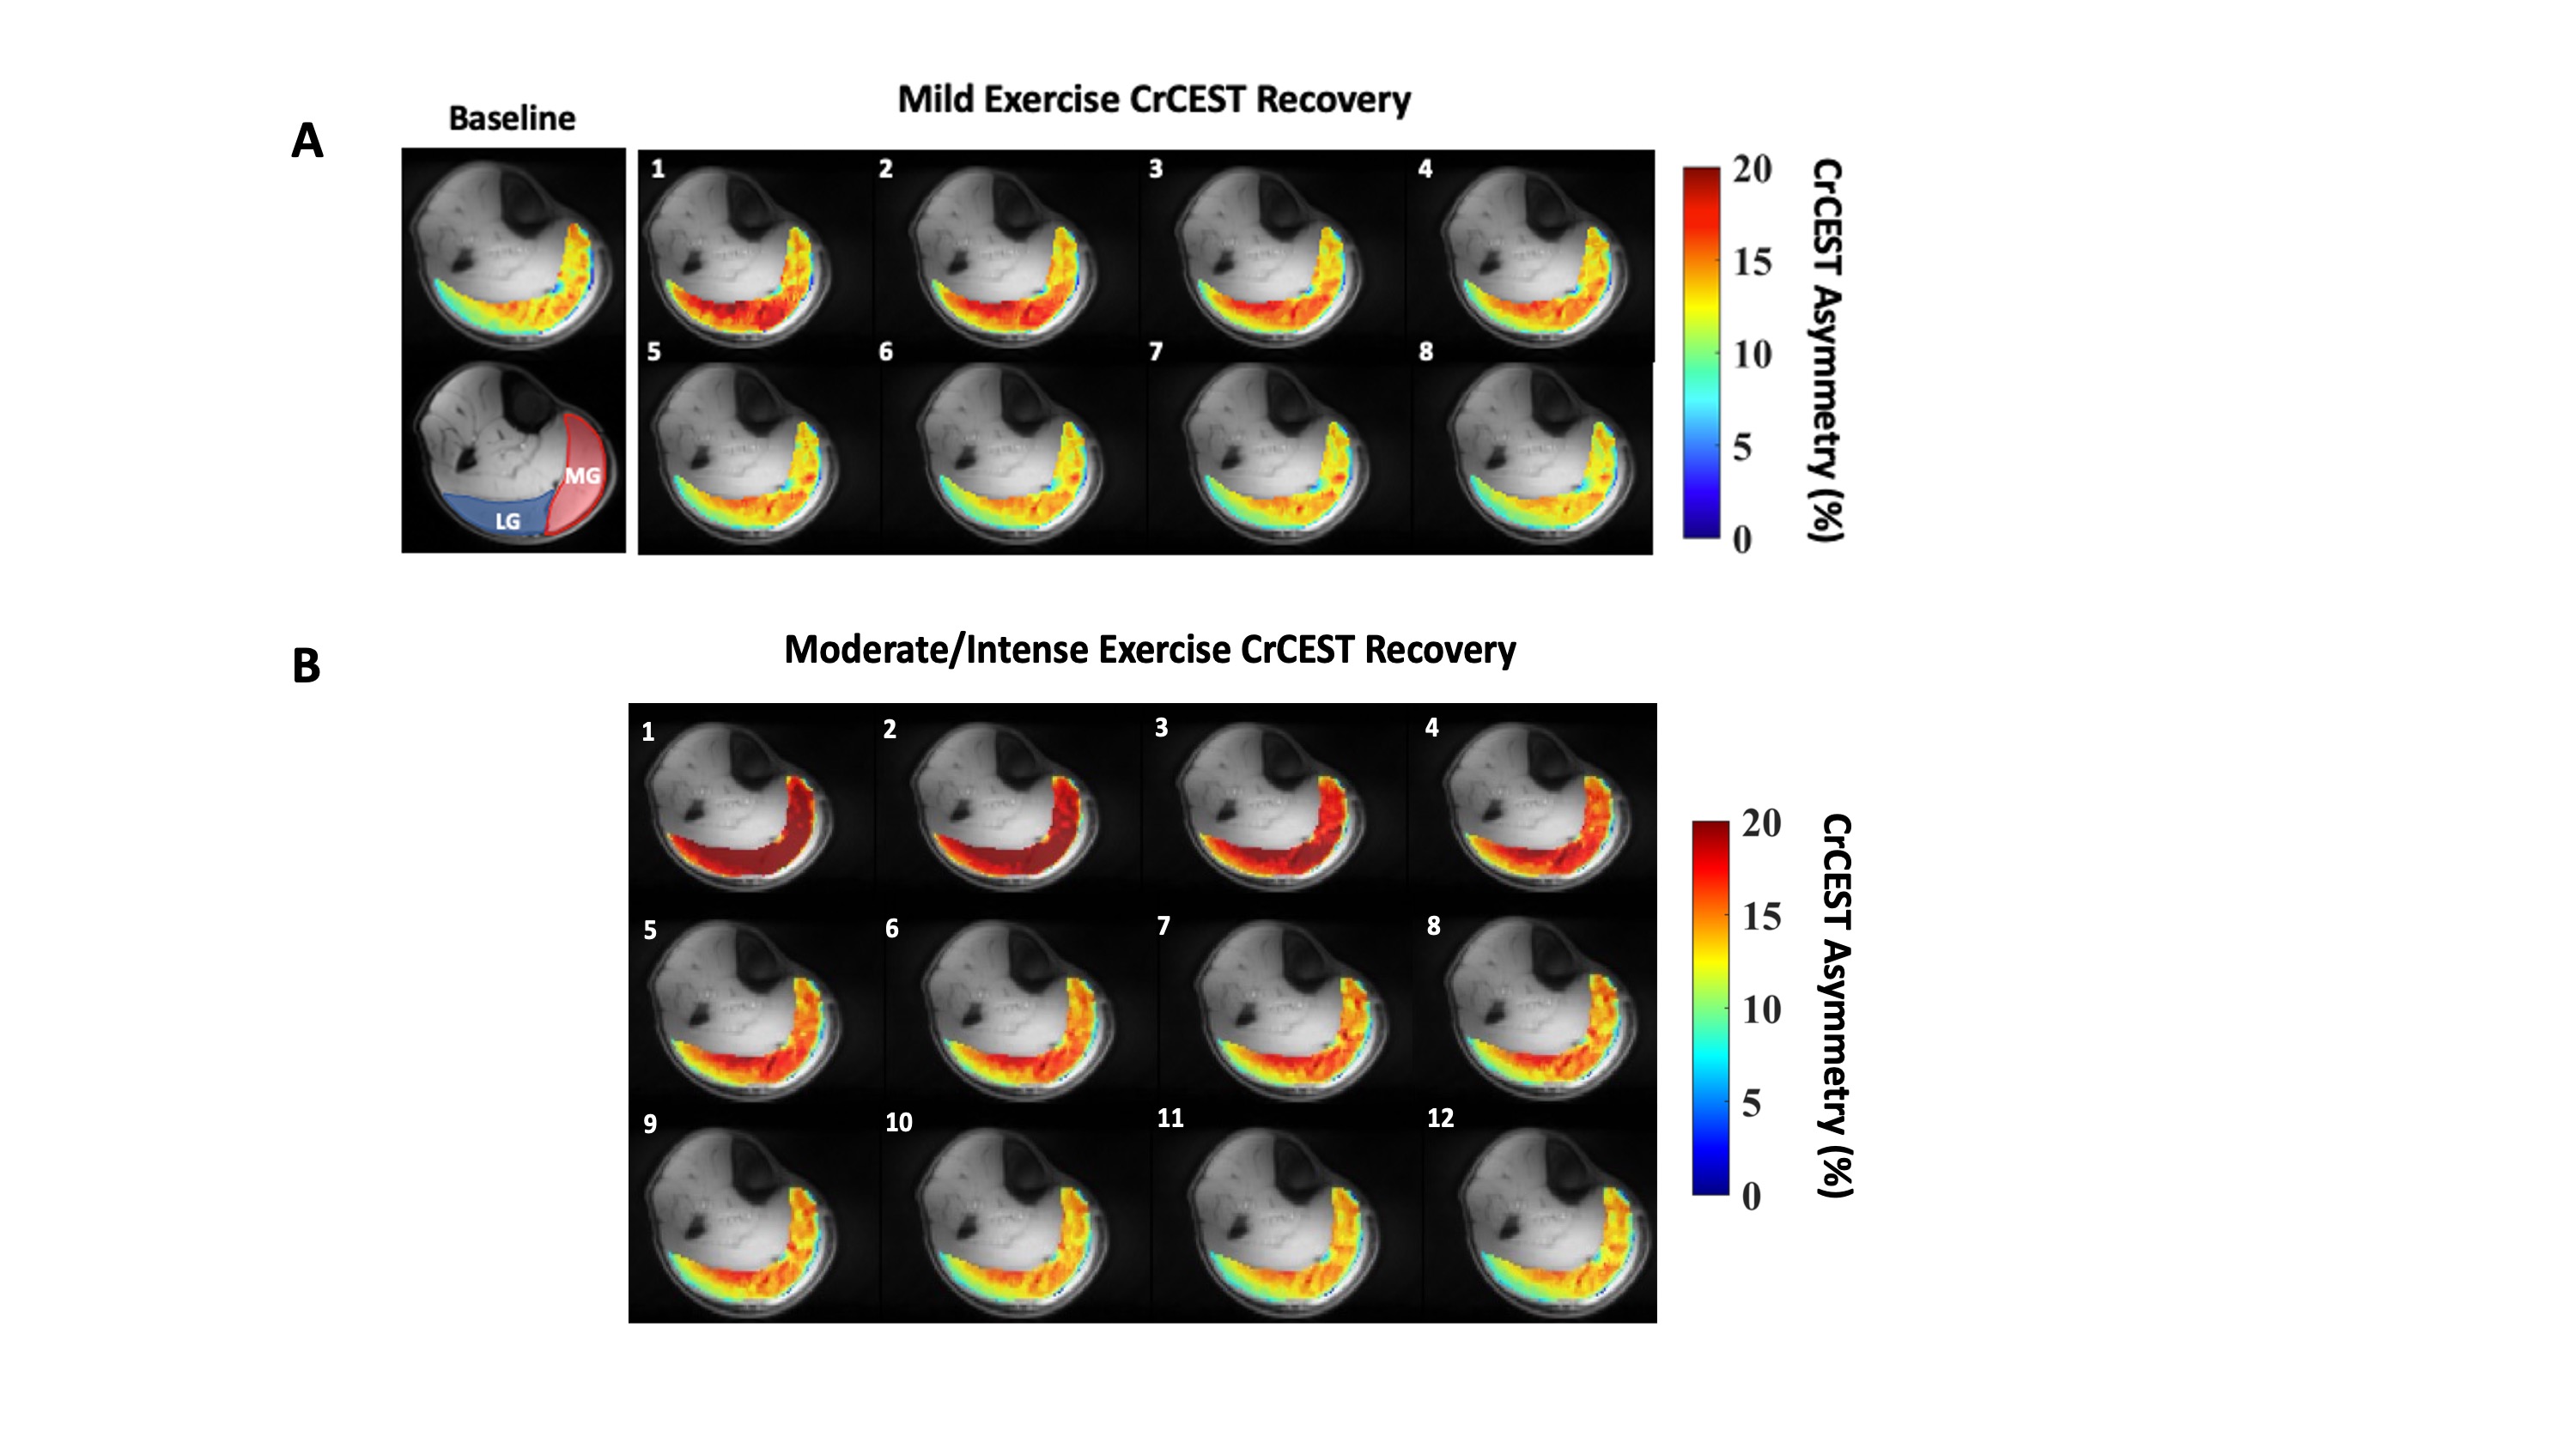
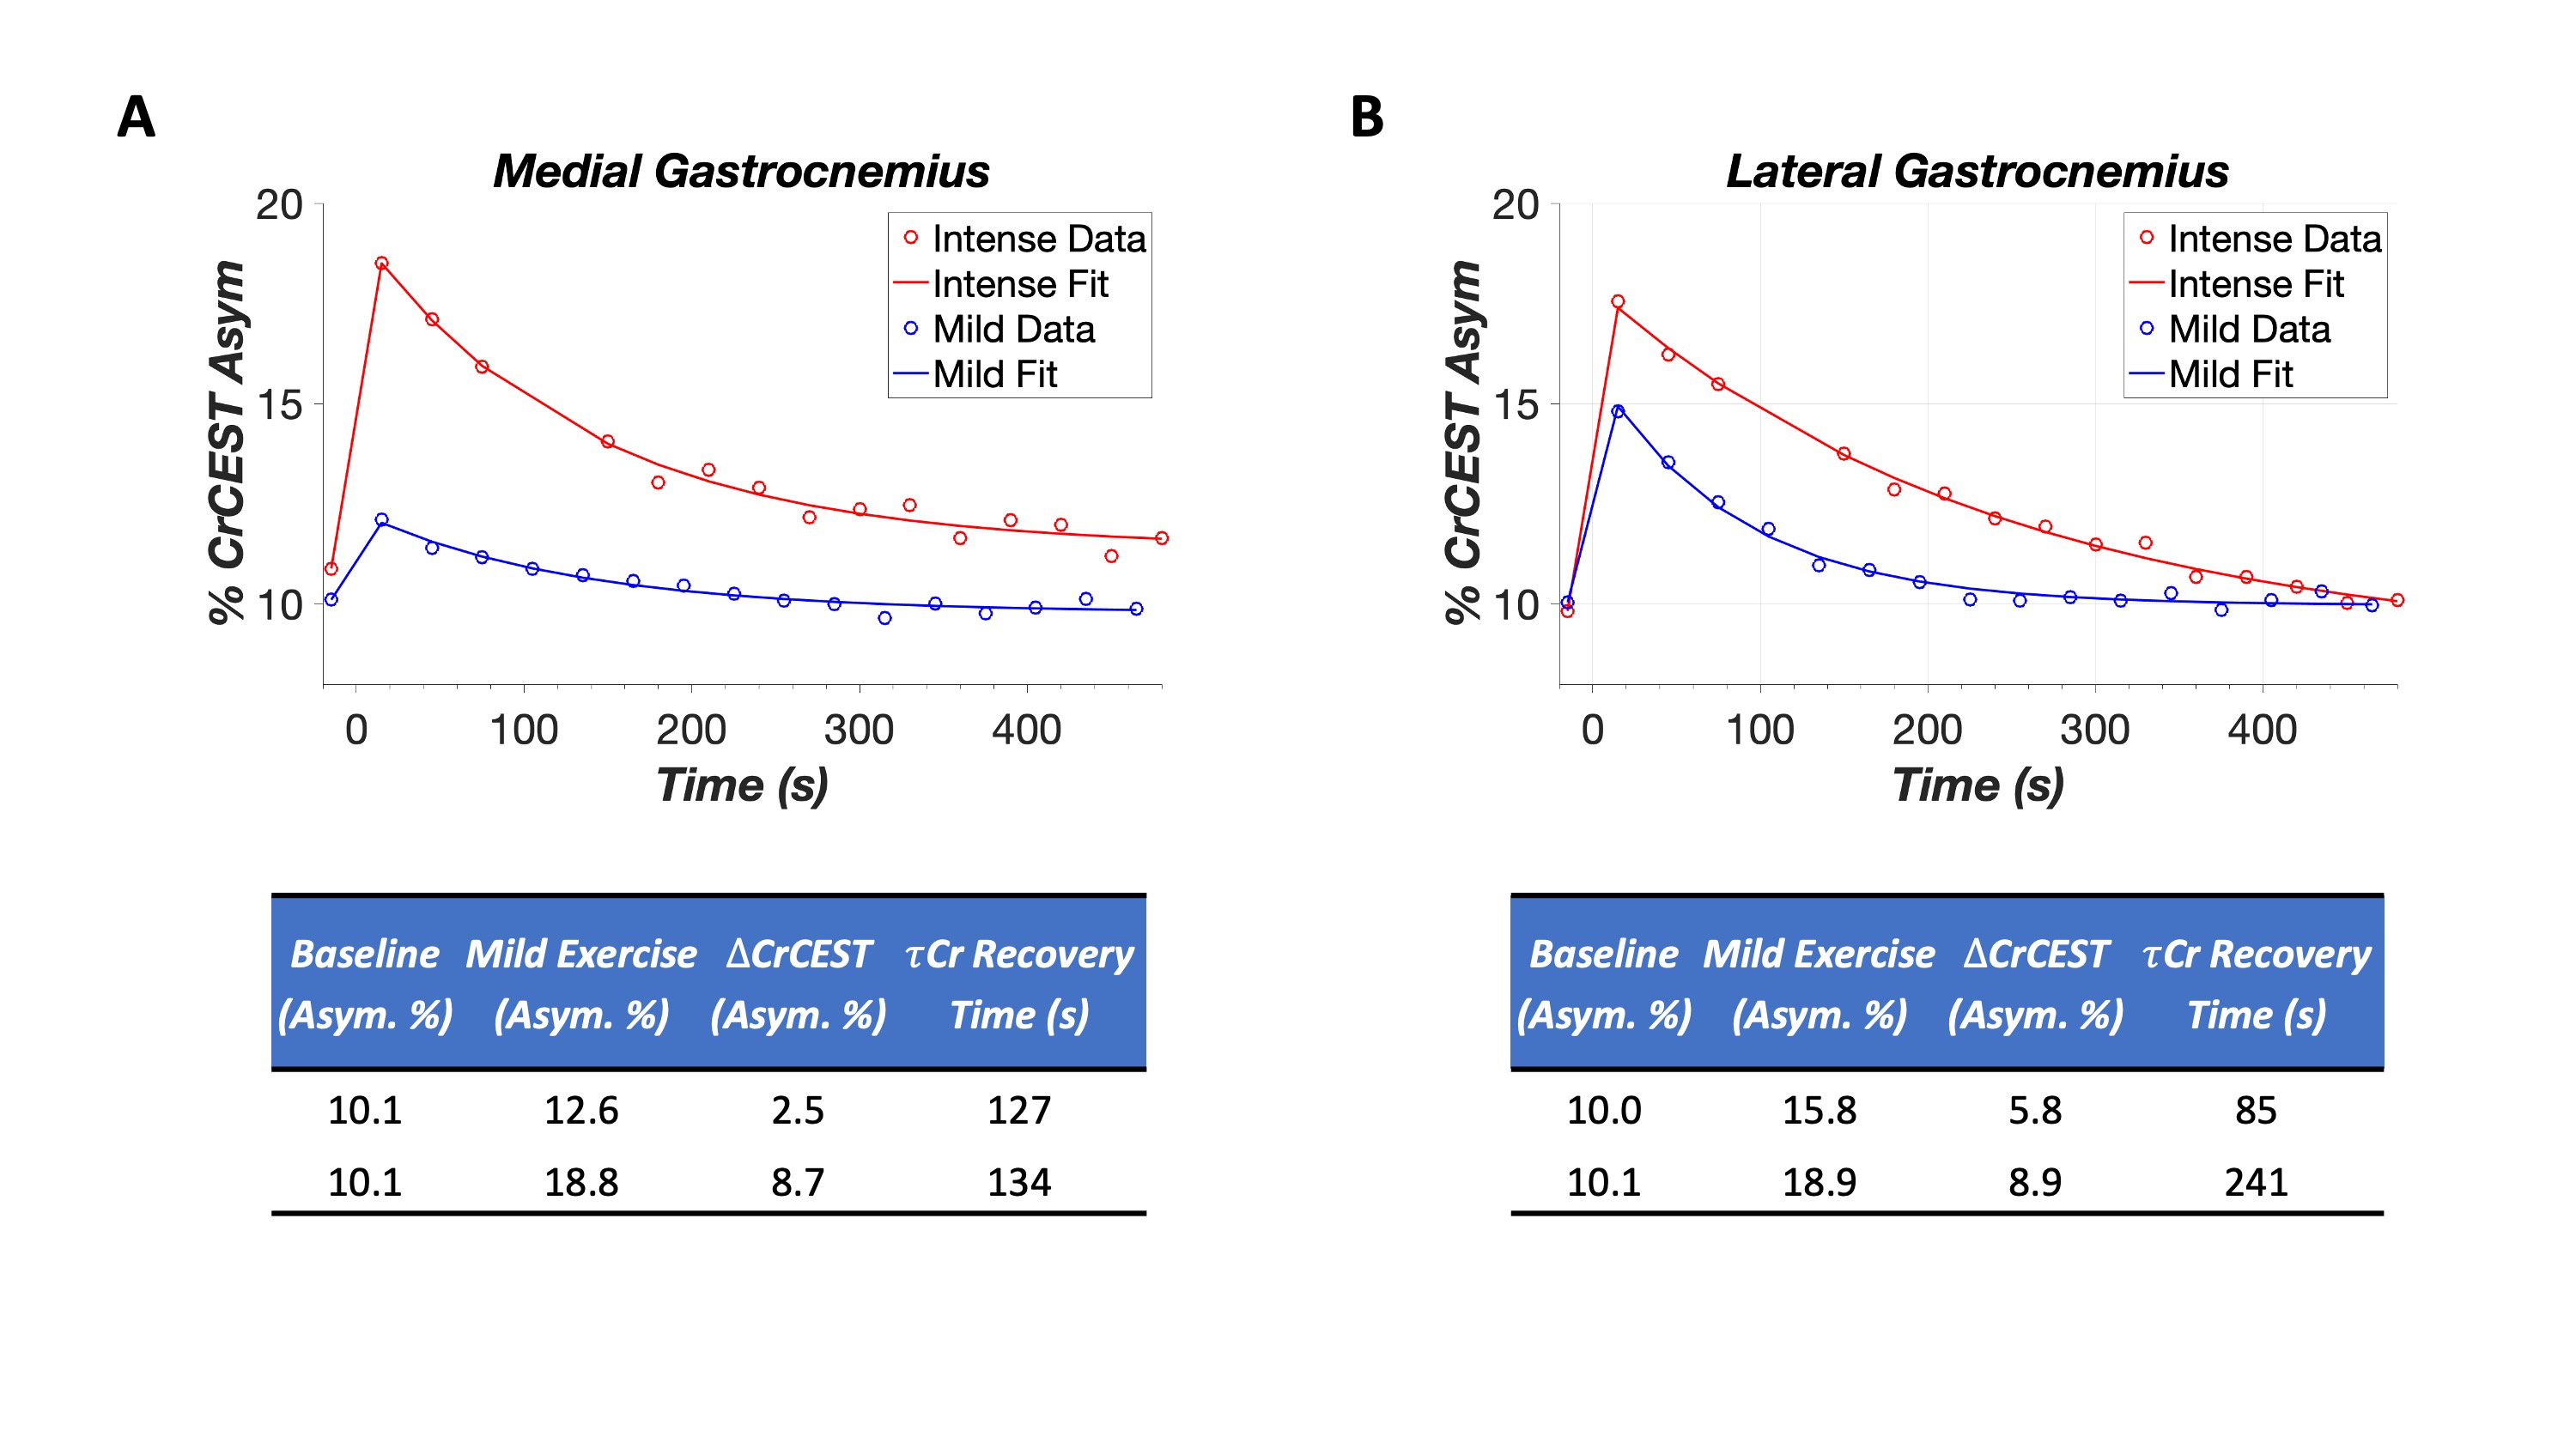
Calf pH measurements at baseline, post-mild, and post-moderate/intense exercise are depicted in Figure 1 A-C. 21 of 27 participants had mild-exercise which yielded pH shifts ≤ 0.1 units. Figures 2 A and 2B show CrCEST maps for mild and moderate/intense exercise conditions. The recovery curves and their tabulated vales are displayed for each muscle in Figure 3A and 3B. Across all participants, mild exercise had a median τCr of 62s[range:18-229s] and 51s[range:11-187s] in the LG and MG, respectively. Whereas moderate/intense exercise τCr in the LG and MG were 128s[range:53-750s] and 109s[39-548s], with a change in pH ranging from 0.1-0.7 units. For mild exercise Spearman’s correlation coefficient showed no significant correlation; however for moderate/intense exercise a significant and strong correlation(ρ=0.67, p=0.001) was found between pH change and with τCr.Conclusion
Conventionally, pH shift and mild exercise have been measured and prescribed using 31P-MRS and MVC, respectively. We show that carnosine DFMRS paired with MVC can quickly and optimally prescribe a mild-exercise. Our research findings indicate that the occurrence of intracellular acidosis results in delayed recovery of τCr with a significant and strong positive monotonic relationship. With the prescribed mild exercise stimulus, when a pH change of less than or equal to 0.1 units was achieved, the post-exercise CrCEST elevation was sufficiently high and the recovery time constant sufficiently long to be detected by our CrCEST MRI protocol, thus enabling measurement of OXPHOS.Acknowledgements
- “Research reported in this publication was supported by the National Institute of Biomedical Imaging and Bioengineering of the National Institutes of Health under award Number P41EB029460.”
- “Research reported in this publication was supported by the National Institute of Aging of the National Institutes of Health under award Number R56AG062665.”
- “Research reported in this publication was supported by the National Institute of Aging of the National Institutes of Health under award Number R01AG071725.”
- “Research reported in this publication was supported by the National Institute of Biomedical Imaging and Bioengineering of the National Institutes of Health under award Number T32EB020087.”
References
1. DeBrosse, C. et al. Muscle oxidative phosphorylation quantitation using creatine chemical exchange saturation transfer (CrCEST) MRI in mitochondrial disorders. JCI Insight (2016) doi:10.1172/jci.insight.88207.
2. Pan, J. W., Hamm, J. R., Rothman, D. L. & Shulman, R. G. Intracellular pH in human skeletal muscle by 1H NMR. Proc Natl Acad Sci U S A 85, 7836–7839 (1988).
3. Pan, J. W., Hamm, J. R., Hetherington, H. P., Rothman, D. L. & Shulman, R. G. Correlation of lactate and pH in human skeletal muscle after exercise by 1H NMR. Magn Reson Med 20, 57–65 (1991).
4. Kim, M., Gillen, J., Landman, B. A., Zhou, J. & van Zijl, P. C. M. WAter Saturation Shift Referencing (WASSR) for chemical exchange saturation transfer experiments. Magn Reson Med. 61, 1441–1450 (2009).
5. Stollberger, R. & Wach, P. Imaging of the active B1 field in vivo. Magnetic Resonance in Medicine 35, 246–251 (1996).
6. Kumar, D. et al. Recovery kinetics of creatine in mild plantar flexion exercise using 3D creatine CEST imaging at 7 Tesla. Magnetic Resonance in Medicine 85, 802–817 (2021).
7. Cai, K. et al. Magnetic resonance imaging of glutamate. Nature Medicine 18, 302–306 (2012).
8. Jacobs, P. S. et al. Repeatability of B1+ inhomogeneity correction of volumetric (3D) glutamate CEST via High-permittivity dielectric padding at 7T. Magnetic Resonance in Medicine 88, 2475–2484 (2022).
9. Jacobs, P. S. et al. B1+\ \mathrmB_1^+ \ inhomogeneity correction of volumetric brain NOEMTR via high permittivity dielectric padding at 7 T. Magnetic Resonance in Medicine 90, 1537–1546 (2023).
10. Nanga, R. P. R. et al. Identification of new resonances in downfield 1 H MRS of human calf muscle in vivo: Potentially metabolite precursors for skeletal muscle NAD +. Magnetic Resonance in Med mrm.29687 (2023) doi:10.1002/mrm.29687.
11. Bagga, P. et al. Single-Voxel 1H MR spectroscopy of cerebral nicotinamide adenine dinucleotide (NAD+) in humans at 7T using a 32-channel volume coil. Magnetic Resonance in Medicine 83, 806–814 (2020).
12. Geen, H. & Freeman, R. Band-selective radiofrequency pulses. Journal of Magnetic Resonance (1969) 93, 93–141 (1991).
Figures