1703
One-year longitudinal assessment of CMT1A patients using Quantitative MRI1Neurology, APHM, MARSEILLE, France, 2CRMBM, marseille, France, 3CRMBM, MARSEILLE, France, 4APHM, MARSEILLE, France, 5LIS, MARSEILLE, France, 6APHM, Marseille, France
Synopsis
Keywords: Muscle, Quantitative Imaging, Neuropathy, Follow-up
Motivation: Intramuscular fat fraction (FF) quantified using MRI has emerged as one of the few responsive outcome measures in neuropathic patients.
Goal(s): In the present one-year follow-up study we tracked changes in multiple qMRI biomarkers for CMT1A patients.
Approach: We assessed correlations between MRI and clinical parameters and compared 2D vs 3D segmentation analysis.
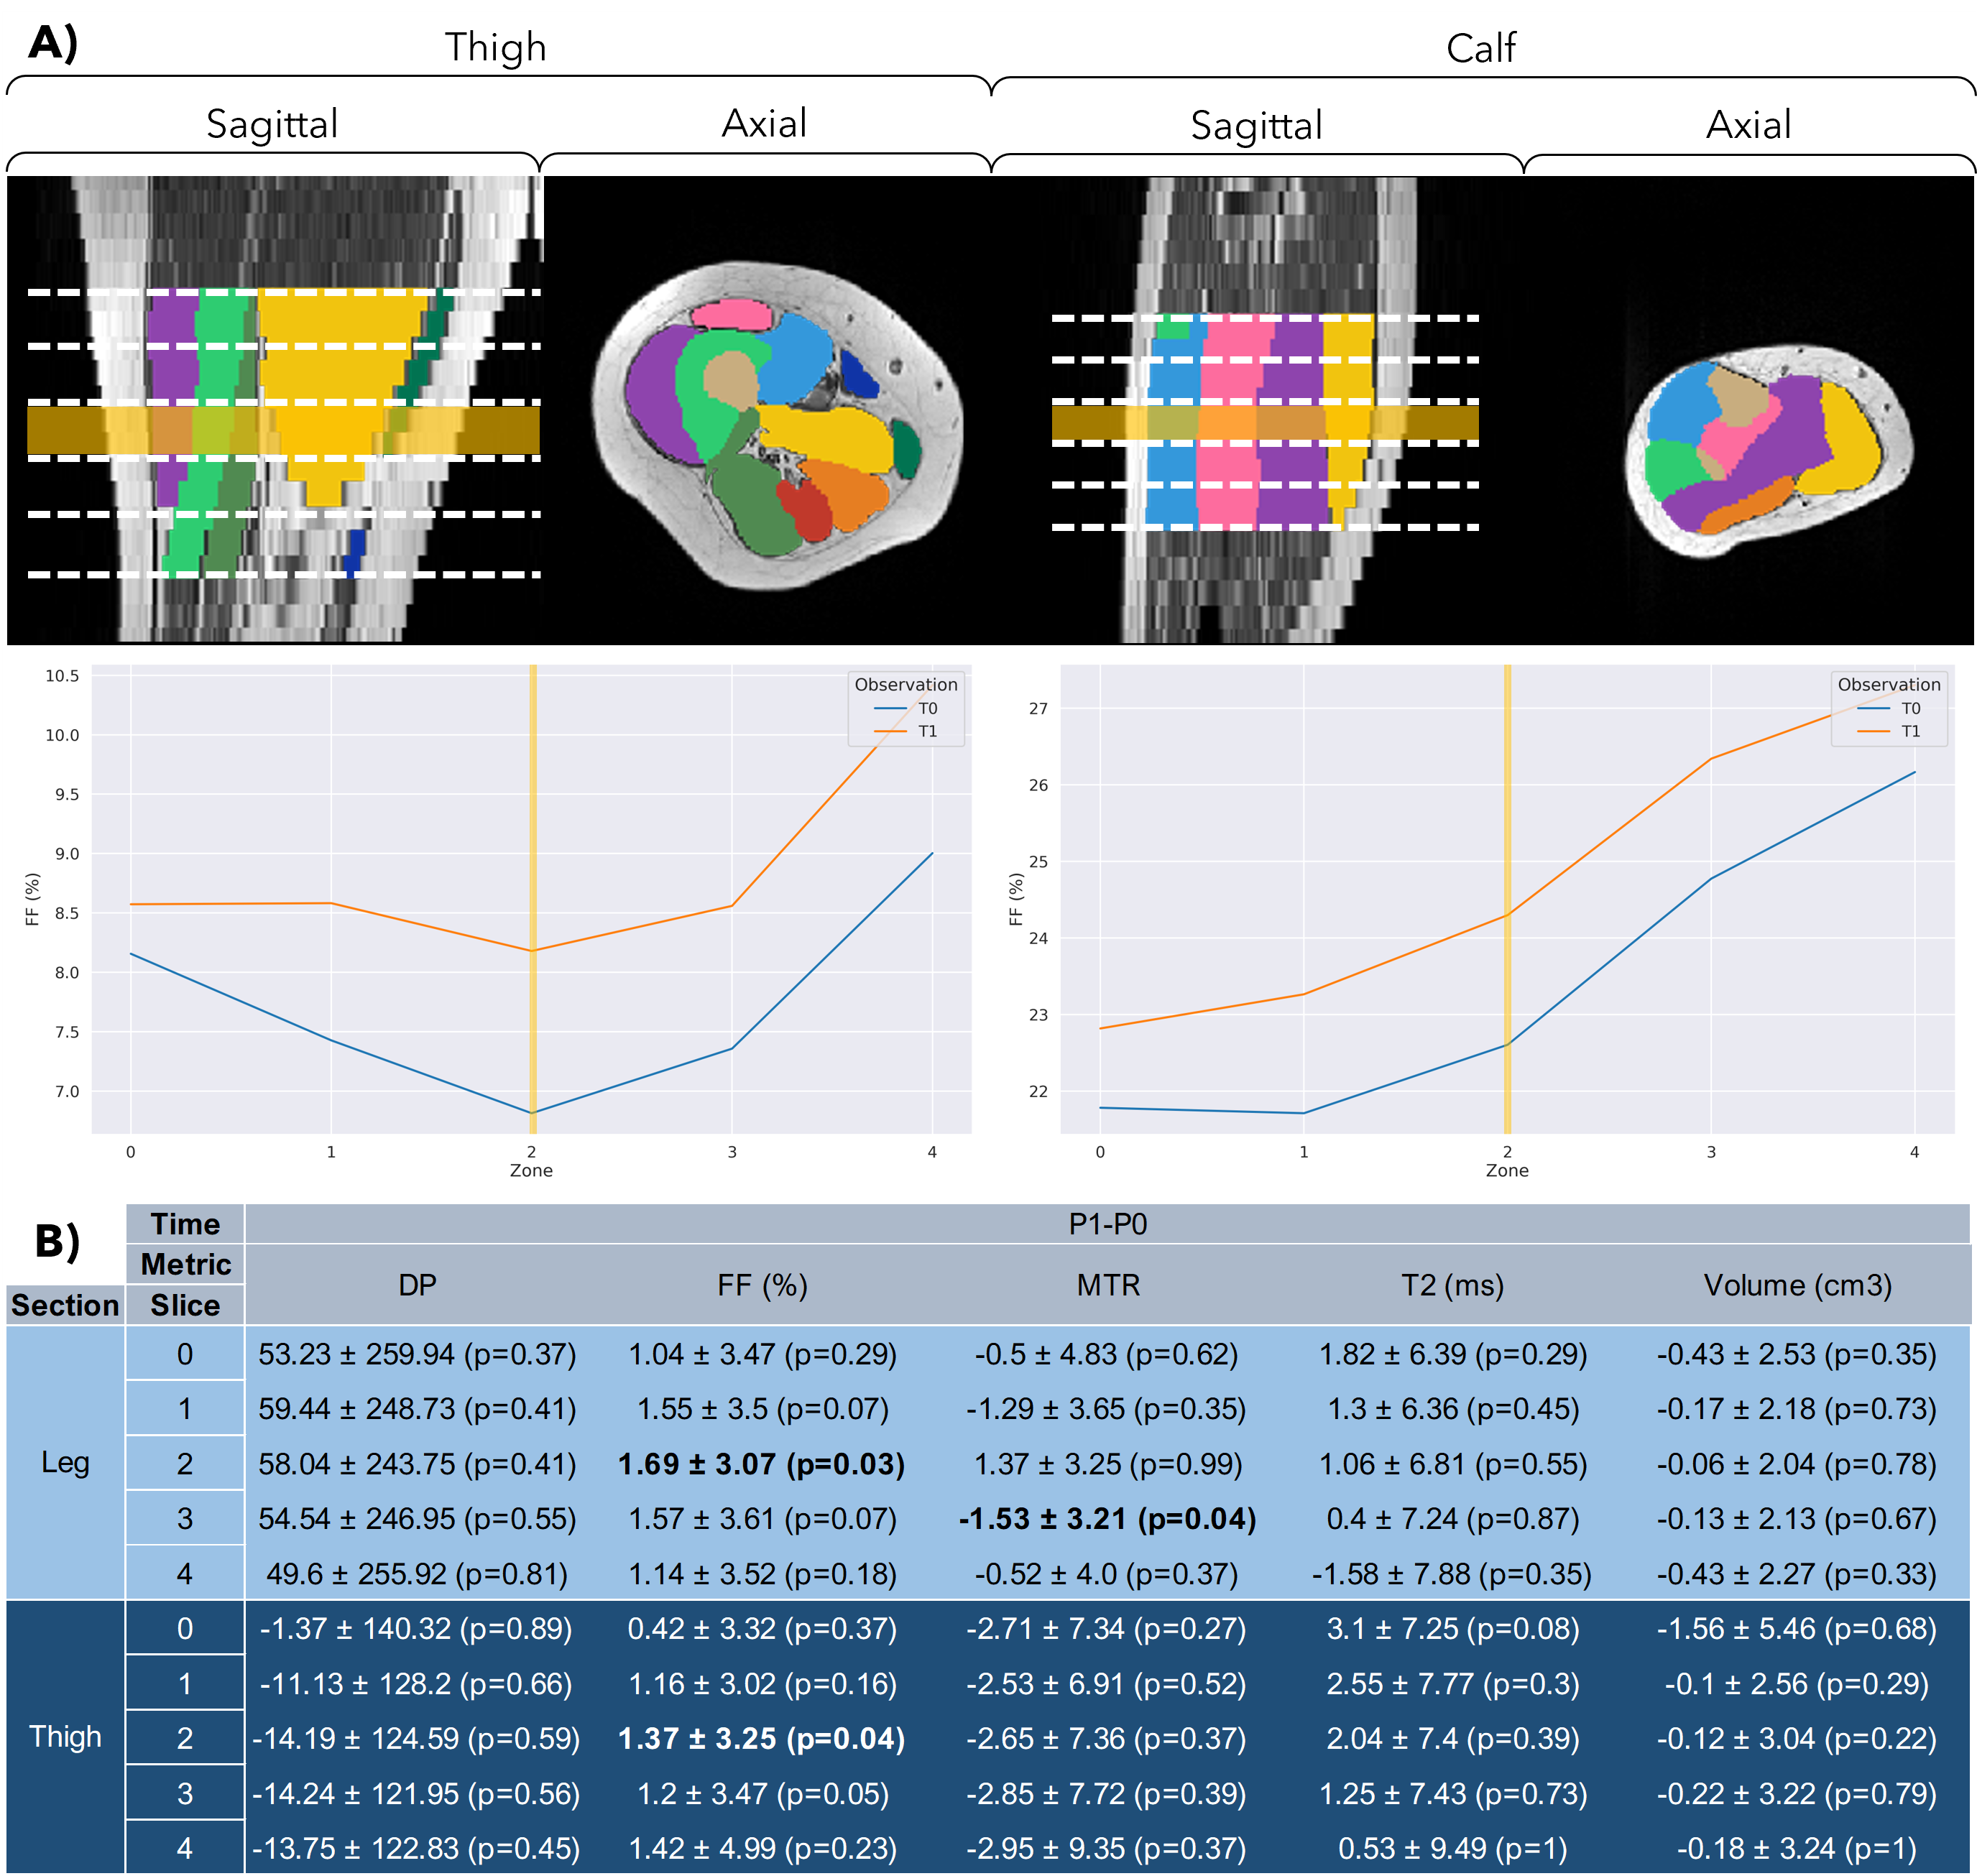
Results: As expected, we quantified a significant FF rise in both thigh and leg muscles and a length-dependent gradient in leg muscles. Given the varied FF distribution, the existence of a length-dependent gradient, and the differential fatty involution across muscles, 3D volume analysis appeared more faithful than single slice analysis.
Impact: Our longitudinal study further supports FF as a outcome of interest in neuropathic patients. The complexity of fat infiltration in terms of distribution among muscles and heterogeneity along the proximo-distal axis can be identified using a 3D volume analysis.
Introduction
Charcot-Marie-Tooth disease (CMT) is an inherited neuromuscular disorder with an estimated prevalence of 1 in 2500 (1). The predominant variant, CMT1A, is associated with PMP22 mutations, which represent over half of all CMT diagnoses (2). As new clinical trials are emerging (3), the significant challenge is related to the identification of sensitive biomarkers for effective longitudinal evaluation. In slowly progressive conditions such as CMT neuropathies, there is a notable gap in the discovery of biomarkers capable of gauging therapeutic impacts (4). Intramuscular fat fraction (FF) assessed using quantitative MRI (qMRI) has emerged as one of the few responsive outcome measures in CMT1A that could be suitable for future clinical trials. In a one-year longitudinal study conducted in CMT1A patients, a modest (1.7%) but significant fat infiltration rate has been reported within calf muscles. As these results were based on the analysis of a single central slice (5, 6) and given the known length-dependence characteristic of the disease (9), a comprehensive 3D series might be expected to offer richer insights. In the present study, we aimed to identify the relevance of multiple qMRI biomarkers for tracking longitudinal changes in CMT1A patients over a year and to assess clinical correlations between MRI metrics and clinical parameters. We also compared a 3D to a 2D analysis regarding individual muscles segmentation in both leg and thigh.Patients and Methods
Patients and Methods: Adult patients (N = 22) with genetically confirmed CMT1A (PMP22 mutation) from the Reference Center for Neuromuscular Disease and ALS (Marseille-France) volunteered to participate in this study. They were clinically assessed twice within a 12-month interval (T0 and T1), using the Medical Research Council (MRC) scale (7) to assess muscle strength in the lower limbs and the CMTNSv2 (8), CMTES and ONLS (9) for assessing the disease severity. Based on 3T-qMRI measurements performed in the lower limb, various metrics were extracted from three-dimensional volumes of interest. A semi-automated technique was used to analyze central slices as well as a larger 3D muscle volume. Metrics examined included: proton density (PD), magnetization transfer ratio (MTR) and intramuscular fat fraction (FF).Results
FF significantly rose in the 3D volume in both leg (+1.36 ± 1.87%, p=0.045) and thigh (+1.04 ± 2.19%, p=0.041). As illustrated in figure 1, the 3D analyses unveiled a length-dependent gradient in FF, ranging from 22.61 ± 16.17% to 26.17 ± 14.79% at the leg level. There was noticeable variance in longitudinal changes between muscles: +3.17 ± 6.86% in the tibialis anterior compared to 0.37 ± 4.97% in the gastrocnemius medialis. For the leg, analysis of the central slice disclosed a similar rise (+1.54 ± 2.12%, p=0.046). Among the other metrics investigated, only the MTR across the entire thigh volume showed a significant decline between the two time-points: -2.75 ± 6.58 (p=0.049), whereas no significant differences were noted for the 3D muscle volume and PD. Potent correlations were identified between muscle FF and primary clinical measures: CMTNSv2 (rho=0.656; p=0.001) and MRC in the lower limbs (rho=-0.877; p<0.001).Discussion
Our results further support that qMRI is a promising tool for following up longitudinal changes in CMT1A patients, FF being the paramount MRI metric for both thigh and leg regions. We mainly found a significant increase in overall FF for the 3D volume analysis: +1.36 ± 1.87% (p=0.048) and confirmed a similar increase (+1.54 ± 2.12%, p=0.032) in the central region of the leg. Of interest, the 3D analysis also indicated in our cohort a FF increase at the thigh level (+1.04 ± 2.19% p=0.041) which has not been described in previous studies. More specifically, FF progression was slightly more pronounced in the central part of both thigh and leg regions. This non-uniformity in fat replacement has been described in other neuromuscular pathologies such as the Duchenne muscular dystrophy (10). These results would support a 3D analysis of qMRI datasets in neuromuscular disorders. Of interest, our comparative analysis between 3D and 2D volumes indicated slight differences. The FF 3D gradient and the heterogeneity of FF infiltration across different muscles have to be taken into account. It's crucial to scrutinize the post-imaging data extraction methods given that annual changes are minimal (around +1.5%). Given the varied FF distribution, the existence of a length-dependent gradient, and the differential fatty involution across muscles, 3D volume analysis appeared more faithful than single slice analysis.Acknowledgements
This work has been supported by CNRS (UMR 7339).References
1. Barreto LCLS et al. Epidemiologic Study of Charcot-Marie-Tooth Disease: A Systematic Review. Neuroepidemiology. 2016;46(3):157‑65.
2. Fridman V et al., Inherited Neuropathies Consortium. CMT subtypes and disease burden in patients enrolled in the Inherited Neuropathies Consortium natural history study: a cross-sectional analysis. J Neurol Neurosurg Psychiatry. 2015 Aug;86(8):873-8.
3. Morena J et al. From Molecules to Therapy. IJMS. 12 juill 2019;20(14):3419.
4. Rossor AM et al. Are we prepared for clinical trials in Charcot-Marie-Tooth disease? Brain Research. feb 2020;1729:146625.
5. Morrow JM et al. . MRI biomarker assessment of neuromuscular disease progression: a prospective observational cohort study. Lancet Neurol. 2016 Jan;15(1):65-77.
6. Morrow JM et al. . Validation of MRC Centre MRI calf muscle fat fraction protocol as an outcome measure in CMT1A. Neurology. 2018 Sep 18;91(12):e1125-e1129.
7. Compston A. Aids to the investigation of peripheral nerve injuries. Medical Research Council: Nerve Injuries Research Committee. Brain. 2010 Oct;133(10):2838-44.
8. Murphy SM et al. . Reliability of the CMT neuropathy score (second version) in Charcot-Marie-Tooth disease. Journal of the peripheral nervous system : JPNS. 2011;16(3):191-8
9. Graham RC et al. A modified peripheral neuropathy scale: the Overall Neuropathy Limitations Scale. Journal of neurology, neurosurgery, and psychiatry. 2006;77(8):973-6.
10. Hooijmans M et al. Non-uniform muscle fat replacement along the proximodistal axis in Duchenne muscular dystrophy. Neuromuscul Disord 2017; 27(5): 458-464.Figures