1702
Single-shot Trace Diffusion Weighted Radial Spectroscopic Imaging of Human Calf Muscle: Intra-/Extra-myocellular Lipids and Metabolites1Radiological Sciences, UCLA Geffen School of Medicine, Los Angeles, CA, United States, 2College of Health and Human Sciences, Purdue University, West Lafayette, IN, United States, 3Medicine, UCLA Geffen School of Medicine, Los Angeles, CA, United States
Synopsis
Keywords: Muscle, Diffusion/other diffusion imaging techniques, Magnetic Resonance Spectroscopic Imaging, Radial trajectories
Motivation: To investigate the diffusion of calf muscle intra-myocellular droplets in diabetes and obesity.
Goal(s): To validate diffusion-weighted radial echo-planar spectroscopic imaging (DW-REPSI) in calf muscle.
Approach: We acquired DW-REPSI spectra using 2 different b-values in 3 young healthy subjects and one type2 diabetic patient; regional variations of intra- and extra- myocellular lipids (IMCL and EMCL), creatine and trimethylamines (TMA) and their diffusivities were quantified.
Results: Decreased TMA was recorded in the tibialis anterior muscle compared to that of soleus and gastronomic muscles. ADCs of IMCL and EMCL and metabolites were quantified. Lower ADCs of IMCL indicated restricted motion. Shifts in EMCL was observed.
Impact: A diffusion-weighted spectroscopic
imaging sequence was evaluated to investigate the diffusion characteristics and
regional variations of IMCL, EMCL and metabolites in calf muscle. The outcome may provide new biophysical insights in the investigation
of lipid metabolism in diabetes.
Introduction
In skeletal muscle tissues, two pools of lipids are found: intramyocellular lipids (IMCL) and extramyocellular lipids (EMCL)1-3. In sedentary and diabetic subjects, an inverse correlation was found between the IMCL and insulin sensitivity4-6. In addition to IMCL and EMCL in leg muscles, metabolite resonances of creatine/phosphocreatine (Cr/PCr), choline or trimethylamines (TMA) and carnosine (Car) have also been detected in calf muscle earlier7. Varying IMCL and EMCL levels in different muscle regions using MR spectroscopic Imaging (MRSI) have also been reported7-10. It has been known previously that the magnetic field deviations experienced by EMCL compartments were between 0.6 to -0.2 ppm with respect to the resonance of IMCL in the soleus muscle11-12. High resolution MRSI of calf muscle was demonstrated by Weis et al. using echo-planar spectroscopic imaging12. Radial k-space sampling techniques have gained widespread use in MRI due to their relatively decreased sensitivity to motion-related artifacts, inherent SNR advantage, and great potential for high acceleration13-14. Feasibility of radial echo-planar spectroscopic imaging (REPSI) to record metabolites in multiple-regions of brain was demonstrated recently15. The goals of the present study were 1) to evaluate a recently implemented single-shot trace DW-REPSI using radial trajectories in human calf muscles and 2) to quantify apparent diffusion coefficients of lipids and metabolites in different calf muscle regions.Materials and Methods
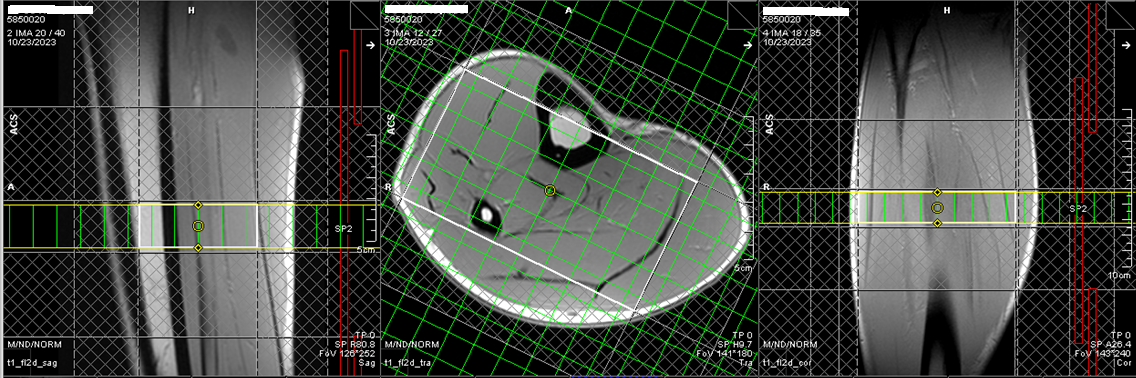
A Siemens 3T Prisma-Fit MRI Scanner with a 15-channel phased-array receive/transmit knee coil was used. The study participants consisted of three young healthy volunteers (mean age 27.7 years), and one 69 years-old type 2 diabetes mellitus (T2DM) subject. A PRESS localization was used for volumetric excitation with an initial 90° RF excitation pulse along the slice (z) direction followed by two Mao 180° RF pulses along the x and y directions to acquire an axial in-plane orientation. Outer volume suppression bands were placed to suppress signals from lipid-dominant outer regions and water suppression was done using a three-pulse WET sequence16. The 20mm slab thickness of the volume-of-interest (VOI) with the matrix size of 32×32 and FOV of 320×320 mm2 resulted in a voxel volume of 2.0 mL. A symmetric bi-polar trapezoidal gradient echo train was used for the spatial-spectral readout with a spectral bandwidth of 1190 Hz (100 kHz ADC bandwidth, ramp durations of 50 μs, and 32×32 k-space points (kx-ky) sampled during the gradient plateaus. To achieve diffusion-trace weighting in only one measurement, we used 12 pairs of bipolar diffusion-sensitizing gradient (DSG) lobes interleaved within the PRESS localization which resulted in: (a) cancellation of signal weighted by off-diagonal terms in the diffusion tensor, and (b) elimination of any cross-terms originating between any static background gradients and the diffusion-sensitizing gradients17. In contrast to a single spin-echo slice selection, the second refocusing pulse in the PRESS sequence is crucial for eliminating cross-term due to static background gradients.Results
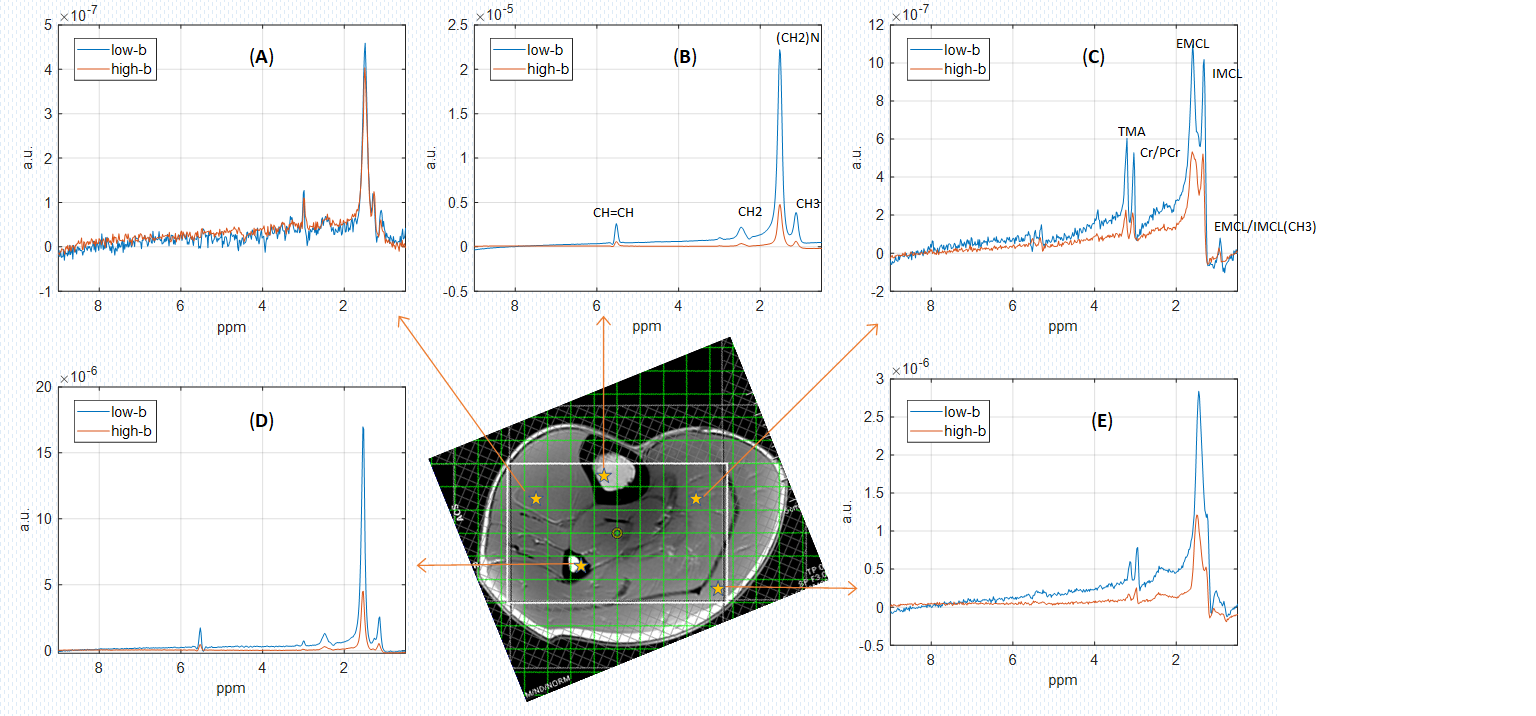
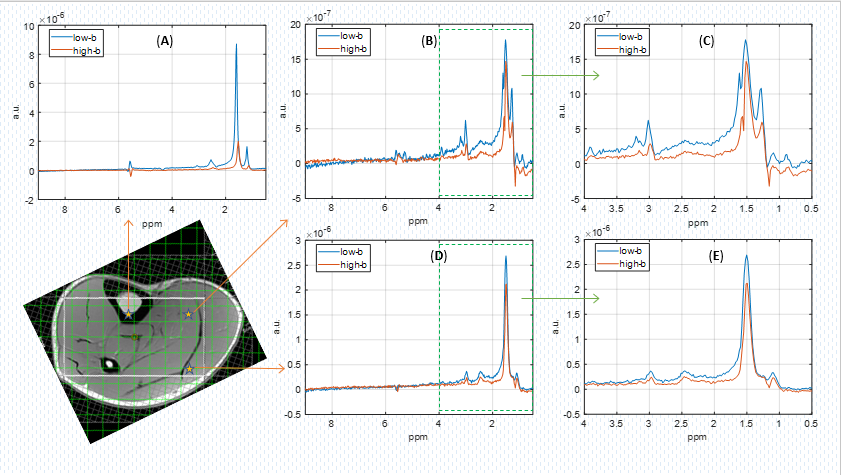
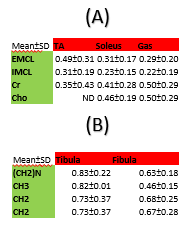
Fig.2 and Fig.3 show spectra from DW-REPSI acquired in 2 young healthy subjects. Regional variations of IMCL, EMCL, TMA, Cr/PCr were evident in different muscle regions: soleus, tibialis anterior (TA) and gastrocnemius (GAS) muscles. Lipid spectra from the tibial marrow and fibula showed resonances due to polymethylene, methyl, methylene and olefinic protons. Table 1 shows the ADC values of lipids and metabolites in the soleus, TA and GAS calculated from the spectra acquired using low and high b-values. The decreased ADC values of IMCL and EMCL in one diabetic calf muscle was observed in different muscles.Two EMCL peaks due to bulk magnetic susceptibility (BMS) shifts were detected as reported earlier12.Discussion
Compared to MRSI using phase-encoding gradients, shorter acquisition was possible using DW-REPSI. Also, the sequence enabled motion robustness due to multiple crossings of k-space origin. Multi-voxel MR spectra using low and high b-values were of excellent quality as evident in Fig.2 and Fig.3. Significant reduction of TMA in the TA muscle was observed compared to that in the soleus and GAS muscles. In agreement with earlier reports, the ADC values of IMCL were smaller than those of EMCL in soleus, with TA and GAS muscles reflecting restricted diffusion of IMCLs compared to EMCL. The high b-value of 1600 s/mm2 is a limitation of the current study and DW acquisition using higher b-values and longer diffusion times needs further investigation18.Conclusions
Regional variations of IMCL and EMCL were detected in different calf muscle regions. The diffusion trace-weighted sequence could provide the trace ADC of the lipid and metabolites in a much shorter scan time compared to conventional diffusion-weighted spectroscopic imaging techniques.Acknowledgements
This research was supported by grants from NIH/NIMH: (1R21MH125349-02) and NIH/NIBIB: (1R21EB02088302).References
1. Boesch C, Slotboom J, Hoppeler H, Kreis R. In vivo determination of intramyocellular lipids in human skeletal muscle by means of localized 1H MR spectroscopy. Magn Reson Med 1997;37:484-493.
2. Steidle G, Machann J, Claussen CD, Schick F. Separation of intra- and extramyocellular lipid signals in proton MR spectra by determination of their magnetic field distribution. J Magn Reson 2002;154:228-235.
3. Torriani M, Thomas BJ, Halpern EF, et al. Intramyocellular lipid quantification: Repeatability with 1H MR Spectroscopy. Radiology 2005;236(2):609-14.
4. Shulman GI. Unraveling the cellular mechanism of insulin resistance in humans: New insights from magnetic resonance spectroscopy. Physiology 2004; 19:183-190.
5. Jacob S, Machann J, Rett K, et al. Association of increased intramyocellular lipid content with insulin resistance in lean nondiabetic offspring of type 2 diabetic subjects. Diabetes.1999;48(5):1113–1119.
6. Sinha S, Misra A, Rathi M, et al. Proton magnetic resonance spectroscopy and biochemical investigation of type 2 diabetes mellitus in Asian Indians: observation of high muscle lipids and C-reactive protein levels. Magn Reson Imaging. 2009;27(1):94-100
7. Boesch C, Machann J, Vermathen P and Schick F. Role of proton MR for the study of muscle lipid metabolism. NMR Biomed 2006;19(7):968-88.
8. Vermathen P, Boesch C, Kreis R. Mapping fiber orientation in human muscle by proton MR Spectroscopic Imaging. Magn Reson Med 2003;49:424-432.
9. Hwang JH, Pan JW, Hydari S, et al. Regional differences in intramyocellular lipids in humans observed by in vivo 1H MR spectroscopic Imaging. J Appl Physiol 2001;90:1267-1274.
10. Shen W, Mao X, Wolper C, et al. Reproducibility of single- and multi-voxel 1H MRS measurements of intramyocellular lipid in overweight and lean subjects under conditions of controlled dietary calorie and fat intake. NMR Biomed 2008; 21: 498-506.
11. Valaparla SK, Gao F, Daniele G, et al. Fiber orientation measurements by diffusion tensor imaging improve hydrogen-1 magnetic resonance spectroscopy of intramyocellular lipids in human leg muscles. J Med Imaging 2015;2:026002.
12. Weis J, Bruvold M, Ortiz-Nieto F, Ahlstrom H. High resolution echo-planar spectroscopic imaging of Human calf. PLOS 2014;9:e87533.
13. Feng L, Grimm R, Block KT, et al. Golden-angle radial sparse parallel MRI: Combination of compressed sensing, parallel imaging, and golden-angle radial sampling for fast and flexible dynamic volumetric MRI. Magn Reson Med 2014;72:707–717.
14. Glover GH, Pauly JM. Projection Reconstruction Techniques for Reduction of Motion Effects in MRI. Magn Reson Med 1992;28:275–289.
15. Saucedo A, Macey PM, Thomas MA. Accelerated radial echo-planar spectroscopic imaging using golden angle view-ordering and compressed-sensing reconstruction with total variation regularization. Magn Reason Med 2021;86:46-61.
16. Ogg RJ, Kingsley PB, Taylor JS. WET, a T1- and B1-insensitive water-suppression method for in vivo localized 1H NMR spectroscopy. J Magn Reson B1994;104(1):1-10.
17. de Graaf RA, Braun KPJ, Nicolay K. Single-shot diffusion trace1H NMR spectroscopy. Magn Reson Med 2001;45(5):741-748.
18. Xiao L, Wu EX. Diffusion-weighted Magnetic
Resonance Spectroscopy: A novel approach to investigate intramyocellular
lipids. Magn Reason Med 2011;66:937-944.
Figures