1701
Quantitative MRI study of skeletal muscle fat deposition in patients with type 2 diabetes1Department of Medical Imaging, The Third Affiliated Hospital of Southern Medical University, Guangzhou, China, 2The Seventh Affiliated Hospital of Sun Yat-sen University, Shenzhen, China, 3Philips Healthcare, Guangzhou, China
Synopsis
Keywords: Muscle, Diabetes
Motivation: Fat deposition in skeletal muscle plays a vital role in type 2 diabetes mellitus (T2DM) but it lacks assessment of muscle fat infiltration in various stages of progression.
Goal(s): Quantitatively detect skeletal muscle fat content in T2DM patients with different courses and severity.
Approach: We measured thigh and paravertebral muscle fat fraction (FF) in T2DM patients using the mDixon-quant sequence and analyzed its association with other ectopic fat and clinical markers.
Results: The FF value of skeletal muscle in T2DM patients was significantly higher than in the healthy group and was correlated with visceral adipose tissue and the course of T2DM.
Impact: Analyzing the variation in muscle fat deposition in diabetes may provide a more accurate assessment of insulin resistance, which can be utilized to guide clinical medication.
Introduction
Type 2 diabetes mellitus (T2DM) is a chronic metabolic disease mainly based on insulin resistance and characterized by long-term hyperglycemia. Skeletal muscle is one of the main sites of glucose uptake by insulin. When the fat content in skeletal muscle increases, the large number of fatty acids produced by lipolysis leads to abnormal glucose metabolism and insulin resistance occurs in skeletal muscle, which leads to muscle cell necrosis and muscle atrophy.1,2 However, there is still a lack of assessment of fat infiltration in T2DM patients with different courses and severity. Multi-echo Dixon water-fat MRI has become an important method for accurately and quantitatively detecting fat deposition in different tissues by calculating the fat fraction (FF). 3,4 This study aimed to use the mDixon-quant sequence to assess the changes in skeletal muscle fat content in patients with T2DM. The relationship between the change of skeletal muscle FF value and age, visceral adipose tissue (VAT), the duration of disease as well as medication situation in T2DM patients was further investigated.Methods
In this study, we prospectively enrolled 42 patients with diabetes and 44 healthy volunteers. MR scans of the upper mid-abdomen and thighs were obtained using a 3.0-T MR scanner (Achieva 3.0T, Philips Medical, Best, the Netherlands). The scanning sequences included turbo spin echo (TSE) T1WI sequence and mDixon-quant sequence. The region of interest (ROI) was manually delineated independently by two radiologists with more than 5 years of diagnostic experience on the FF map (InterlliSpaceTM Portal, Philips) provided by Philips, regarding T1WI anatomy (Figure 1). We used a nonparametric test to compare the muscle fat content between the T2DM group and the healthy control group using SPSS version 25.0. The T2DM group was divided into three groups according to the course of the disease, and the differences among the groups were compared by the Kruskal-Wallis H test. The same method was used to compare diabetic patients with different interquartile ranges (IQR) of triglyceride glucose (TyG) index (an indicator of insulin insistence, calculated by triglyceride and fasting blood glucose).5 We also analyzed the difference in FF value in patients taking different medications and the correlation between FF values of different muscle parts and age, body mass index (BMI), subcutaneous adipose tissue (SAT), and VAT.Results
The demographics of the participants are shown in Table 1. Pearson test analysis showed that FF values of muscles measured by two radiologists were highly correlated (r=0.910, P < 0.001). We compared the FF values of each muscle in the two groups in Figure 2. In the T2DM group, the FF values of thigh and paraspinal muscles were significantly different in different durations and TyG index (Table 2). In addition, the FF values of muscles were also significantly higher in patients taking sitagliptin (P< 0.001). Age, BMI, and VAT have a significant correlation with the FF value in both groups but have the opposite trend. There was a positive association in the healthy group and a negative association in the T2DM group. After controlling for gender, age, and medication, the correlation between SAT and FF value of the posterior thigh muscle in the T2DM group decreased (Table 3).Discussion
The results indicate that the thigh muscle fat content in patients with T2DM is higher than in the health group, but there is heterogeneity in fat deposits in different parts of the muscle. The difference is less pronounced on the paraspinal muscles, which is associated with high BMI in healthy people. Previous research also confirmed that the fat content in skeletal muscle was greatly affected by VAT.6 In the posterior thigh muscle group, the muscle FF values corresponding to the highest quartile of TyG index (IQR4) were higher than the lowest quartile (IQR1), suggesting that muscle FF values can reflect insulin resistance, which corresponds to the previous study that TyG was negatively correlated with muscle mass.7 But the data for the other two subgroups fluctuated, possibly because of the age of the patients and their medication situation. In addition, we found a strong correlation between FF value and VAT, but whether VAT affects fat deposition in thigh muscle and other factors and mechanisms that affect muscle fat deposition need to be further explored.Conclusion
The mDixon-quant sequence has a good ability to evaluate skeletal muscle fat content. T2DM patients have higher skeletal muscle fat content than healthy people. Further analysis of the dynamic changes of skeletal muscle fat content combined with age, BMI, and TyG index is conducive to better analyzing its relationship with T2DM.Acknowledgements
Xiaodong Zhang is the corresponding author.
This study was supported by the President's Fund of the Third Affiliated Hospital of Southern Medical University (grant No. YM2021012)
References
1. BRøNS C and GRUNNET L G. MECHANISMS IN ENDOCRINOLOGY: Skeletal muscle lipotoxicity in insulin resistance and type 2 diabetes: a causal mechanism or an innocent bystander? [J]. Eur J Endocrinol,2017;176(2):R67-r78.
2. D'SOUZA K, MERCER A, MAWHINNEY H, et al. Whey Peptides Stimulate Differentiation and Lipid Metabolism in Adipocytes and Ameliorate Lipotoxicity-Induced Insulin Resistance in Muscle Cells[J]. Nutrients,2020;12(2).
3. YU F, FAN Y, SUN H, et al. Intermuscular adipose tissue in Type 2 diabetes mellitus: Non-invasive quantitative imaging and clinical implications[J]. Diabetes research and clinical practice,2022;187:109881.
4. DIECKMEYER M, INHUBER S, SCHLäGER S, et al. Association of Thigh Muscle Strength with Texture Features Based on Proton Density Fat Fraction Maps Derived from Chemical Shift Encoding-Based Water-Fat MRI[J]. Diagnostics (Basel, Switzerland),2021;11(2).
5. Son DH, Lee HS, Lee YJ, et al. Comparison of triglyceride-glucose index and HOMA-IR for predicting prevalence and incidence of metabolic syndrome[J]. Nutr Metab Cardiovasc Dis. 2022;32(3):596-604.
6. Maltais A, Alméras N, Lemieux I, et al. Trunk muscle quality assessed by computed tomography: Association with adiposity indices and glucose tolerance in men[J]. Metabolism. 2018;85:205-212.
7. Hu W, Ma Y, Xing D. Association of triglyceride-glucose index and the presence of low muscle mass in type 2 diabetes patients[J]. Clin Exp Med. 2023;23(3):943-949.
Figures
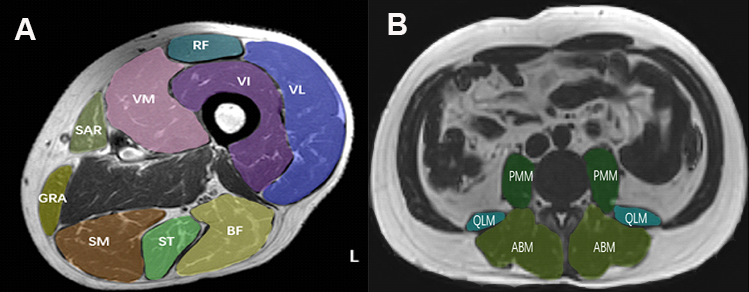
Figure 1: Representative region of interest placement in left midthigh muscles and paraspinal muscles in a 49-year-old man. VL = vastus lateralis, VI = vastus intermedius, VM = vastus medialis, RF = rectus femoris, GRA= gracilis, SM = semimembranosus, ST = semitendinosus, SAR= sartorius, BF = biceps femoris, PMM= psoas major muscle, QLM= quadratus lumborum muscle, ABM= erector spinae muscles.
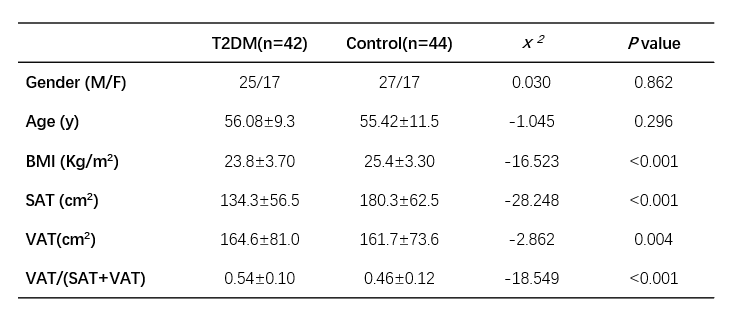
Table 1: Demographics of the population.
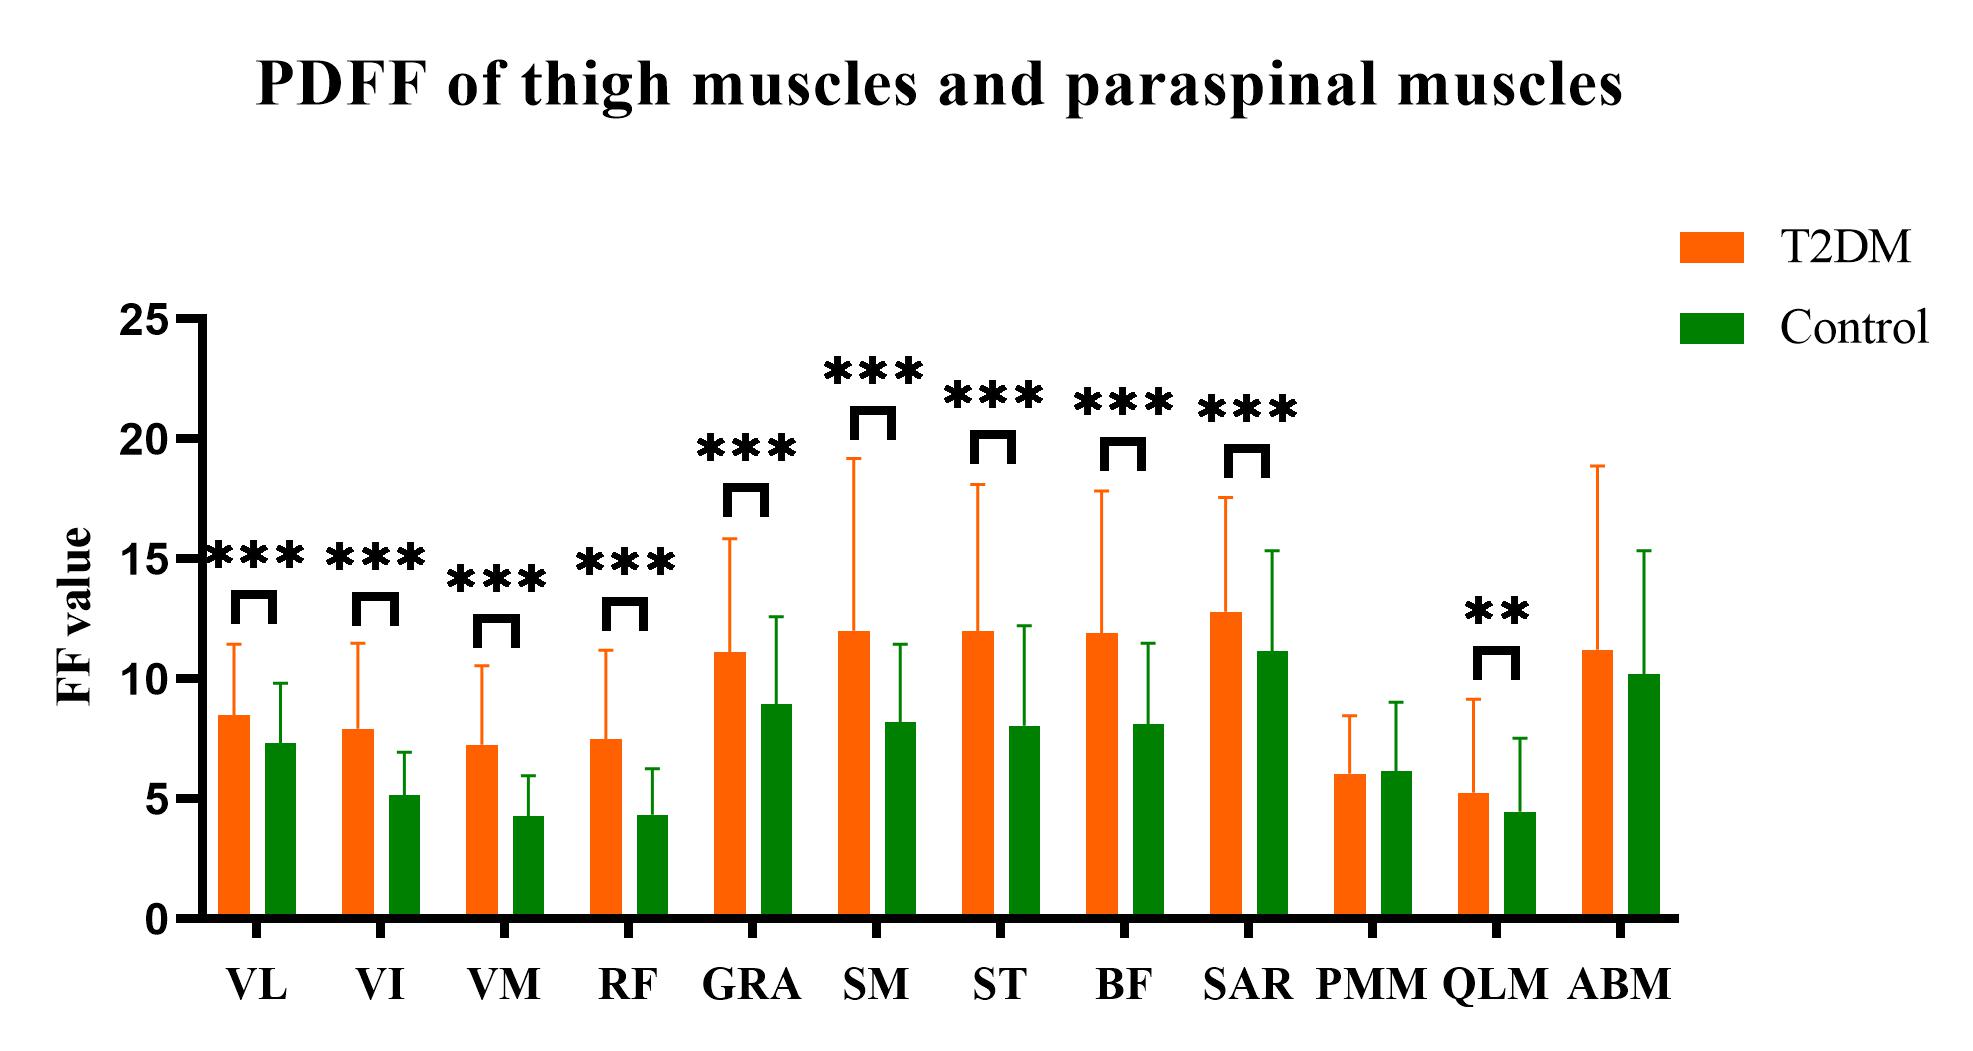
Figure 2: Bar plots of differences in FF values between the two groups for different muscles. The FF value of all thigh muscles was significantly higher than that in the healthy control group (P<0.001) and the FF values of the quadratus lumborum muscle were significantly higher compared to the control group (Z=-3.402, P=0.001). **<0.01, ***<0.001.
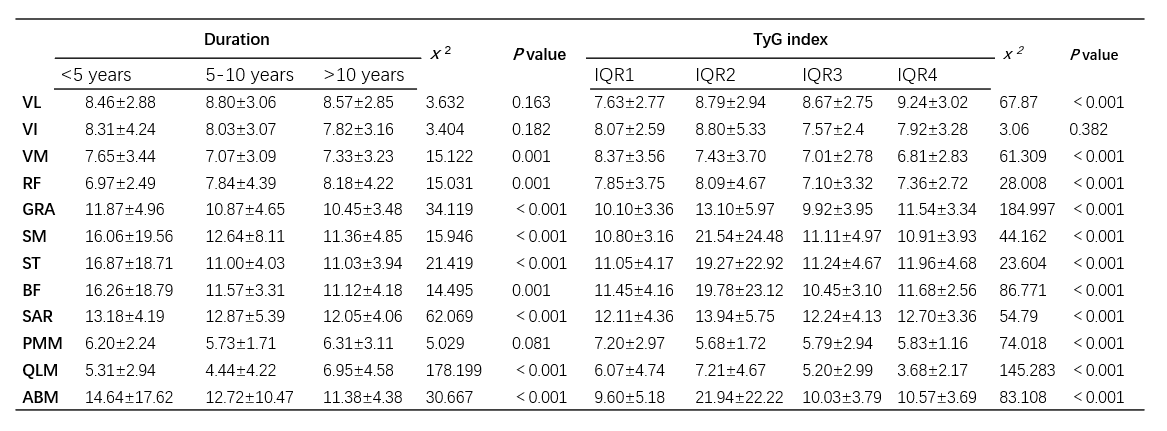
Table 2: The Kruskal-Wallis H test of muscle FF value in patients with different course of disease and different IQR of TyG index.
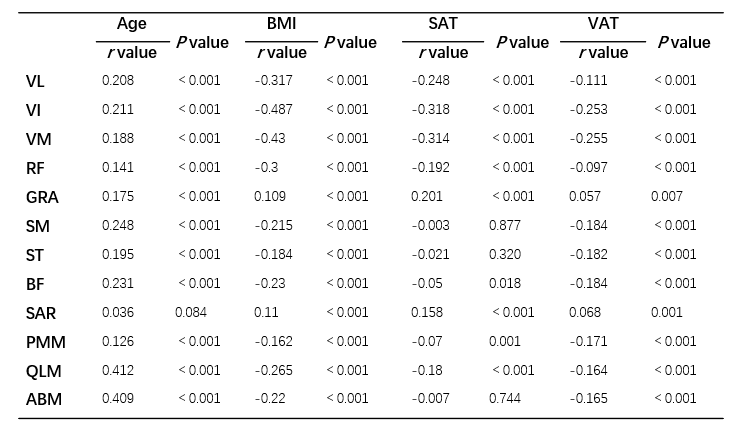
Table 3: Correlation analysis of muscle FF value with age, BMI, SAT, and VAT in T2DM.