1700
Magnetic resonance mDixon-Quant and T2 mapping imaging study of lumbar and paravertebral muscle in patients with ankylosing spondylitis1Department of Radiology, Affiliated Hospital of Guizhou Medical University, Guiyang, China, 2Philips Healthcare, Shanghai, China, 3Philips Healthcare, Xi'an, China
Synopsis
Keywords: Muscle, Bone, lumbar,paravertebral muscle,mDixon-Quant, T2 mapping
Motivation: Ankylosing spondylitis (AS) may cause changes in the patient's lumbar region, so it’s worth investigating whether AS affects the paraspinal muscles.
Goal(s): To examine the changes in both the lumbar region and paraspinal muscles in AS patients, as well as any correlations between them.
Approach: In this study, we utilized mDixon-Quant and T2 mapping to assess the FF and T2 values of the lumbar region and paraspinal muscles.
Results: The AS group showed significantly higher FF and T2 values in the lumbar region and psoas major compared to the healthy controls, and there was a positive correlation between them.
Impact: This investigation has revealed a notable correlation between changes in the paravertebral muscles and the vertebral body. Clinicians will be able to perform thorough assessments of patients with AS and develop effective treatment plans.
Introduction
Ankylosing spondylitis (AS) is a chronic inflammatory disease that affects the entire body1. It has been observed that patients with AS experience osteoporosis in their vertebral bodies, while their paravertebral muscles show varying degrees of atrophy and fatty infiltration2,3. As AS treatment progresses, it has been shown that physical activity can have a positive impact on the severity of the disease3. Therefore, it is clinically important to understand the changes that occur in the vertebral body and paravertebral muscles. The objective of our study was to investigate the potential correlation between microstructural changes in the vertebral body and paravertebral muscles using mDixon-Quant, T2mapping.Methods
Fifty patients with ankylosing spondylitis (AS) (35 male; mean age 28.48±6.19 years) and forty healthy controls (HC) (23 male; mean age 26.82±3.40 years) were included in this study. A 3.0T MRI system (Philips, Elition), equipped with a 32-channel phased array body coil, was used to perform the scanning protocol, which included conventional techniques and mDixon-Quant, T2mapping. The image data was post-processed and analyzed by two experienced radiologists on ISP version V10.1 workstations. The regions of interest (ROIs) were outlined in mDixon-Quant, T2mapping to obtain fat fraction (FF) and T2 values.The variables were tested for normal distribution using the Shapiro-Wilk test. For non-normally distributed data, the Mann-Whitney test was used to compare differences between two independent samples. Spearman's method was applied to analyze the correlation of the FF and T2 values between the vertebrae and the muscles at the corresponding levels. The Intraclass Correlation Coefficient (ICC) was used to assess the agreement of the measurements from two observers.
Results
The ICC for each measure between the two observers was greater than 0.8, indicating a good agreement between them for the same patient. The AS group exhibited significantly higher fat fraction (FF) of the L3 and L4 vertebrae and psoas major (PM) at corresponding levels compared to the HC group (both p<0.01). The T2 values of the L3 and L4 vertebrae in the AS group were also higher than those of the healthy group (both p<0.05). Additionally, the FF and T2 values of the PM at both levels of the L3 and L4 in the AS group were significantly higher compared to those in the healthy group (p<0.01) (Tables 2). Spearman correlation analysis revealed a positive association between the FF and T2 values of L3 and L4 vertebrae as well as the PM at corresponding levels (Figure 2).Discussion
In this research, we employed mDixon-Quant and T2mapping to examine the alterations in FF and T2 values of the vertebral body and paravertebral muscles in AS patients and healthy individuals. We discovered that both FF and T2 values were elevated in the AS group compared to the healthy cohort. AS patients typically show more pronounced bone marrow edema in the initial stages, accompanied by excessive bone trabeculae resorption and an increase in adipocytes during the chronic phase4, as confirmed by prior studies. It has also been reported that AS patients can exhibit diminished bone mineral density2. In this research, the FF and T2 values of L3 and L4 vertebrae were elevated in AS patients, indicating an increase in fatty infiltration of the vertebral body. The reduction in trabeculae and increase in adipocytes can impact bone strength, suggesting that AS patients are more prone to osteoporosis compared to the healthy population.Previous studies have demonstrated that overexpression of TNF- and other pro-inflammatory cytokines, along with inflammation at the vertebral attachment point, lead to fat deposition in the paravertebral muscles and varying degrees of fibrosis in AS patients3. In this research, the rise in FF values was more significant than that of T2 values, which could be attributed to inflammatory edema and fatty infiltration of the paravertebral muscles causing an increase in T2 values, while muscular fibrosis results in decreased T2 values. Existing literature suggests that alterations in vertebral bones can trigger muscle degeneration5,6. In this research, positive correlations were observed between vertebral FF and muscle FF values, as well as between vertebral T2 and muscle T2 values, corroborating previous research. This study implies that clinicians should focus not only on changes in the sacroiliac joints of AS patients, but also on alterations in the spine.
Conclusion
Our research indicates that both FF and T2 values in the lumbar and paravertebral muscles are elevated in patients with AS. These findings imply that the use of mDixon-Quant and T2mapping could offer significant insights and foster a more profound comprehension of the degeneration occurring in the paraspinal muscles in AS.Acknowledgements
noneReferences
1. Hwang MC, Ridley L, Reveille JD. Ankylosing spondylitis risk factors: a systematic literature review. Clin Rheumatol. 2021;40(8):3079-3093.
2. Tsur AM, David P, Watad A, Nissan D, Cohen AD, Amital H. Ankylosing Spondylitis and the Risk of Hip Fractures: a Matched Cohort Study. J Gen Intern Med. 2022;37(13):3283-3288.
3. Ozturk EC, Yagci I. The structural, functional and electrophysiological assessment of paraspinal musculature of patients with ankylosing spondylitis and non-radiographic axial spondyloarthropathy. Rheumatol Int. 2021;41(3):595-603.
4. Liu L, Yuan Y, Zhang S, Xu J, Zou J. Osteoimmunological insights into the pathogenesis of ankylosing spondylitis. Journal Cellular Physiology. 2021;236(9):6090-6100.
5. Huang R, Yang H, Chen L, et al. T2 mapping and fat quantification of lumbar paraspinal muscle in ankylosing spondylitis: a case control study. BMC Musculoskelet Disord. 2022;23(1):614-624.
6. Resorlu H, Savas Y, Aylanc N, Gokmen F. Evaluation of paravertebral muscle atrophy and fatty degeneration in ankylosing spondylitis. Modern Rheumatology. 2017;27(4):683-687.
Figures
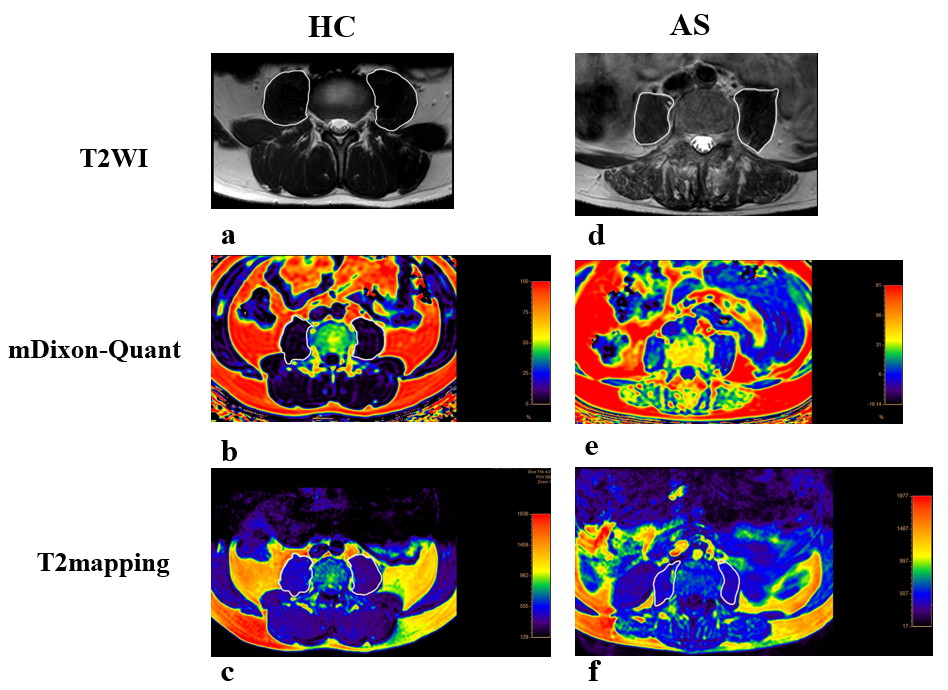
Figure 1 (a-c) L3-level psoas major axial T2WI, mDixon-Quant, and T2mapping maps of healthy control; (d-f) L3-level axial T2WI, mDixon-Quant, and T2mapping maps of AS patients.
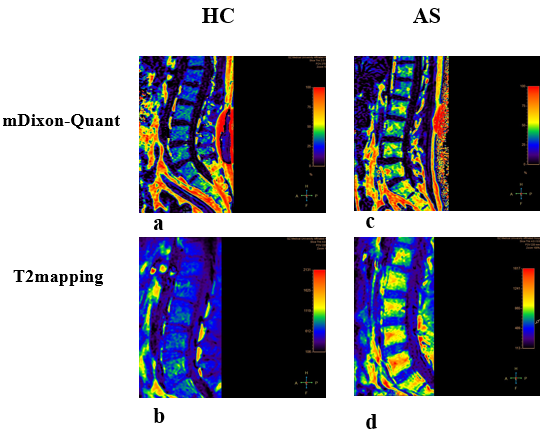
Figure 2 (a, b) Sagittal mDixon-Quant and T2mapping maps of lumbar spine in a healthy male; (c, d) Sagittal mDixon-Quant and T2mapping maps of lumbar spine in AS patients.
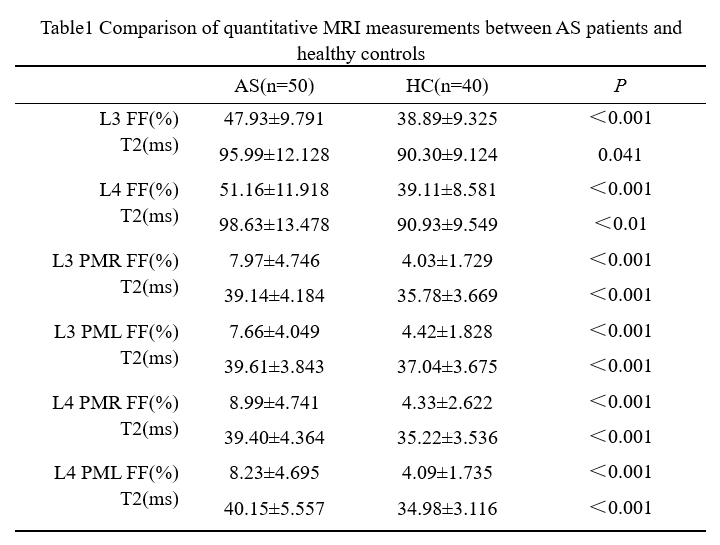
Table1 Comparison of quantitative MRI measurements between AS patients and healthy controls
Note: The values are given as means ± standard deviation; Mann–Whitney U test
AS Ankylosing spondylitis, HC Healthy control, PMR Right psoas major,PML Left psoas major, FF Fat fraction
* P < 0.05, **P < 0.01, ***P < 0.001, versus healthy controls
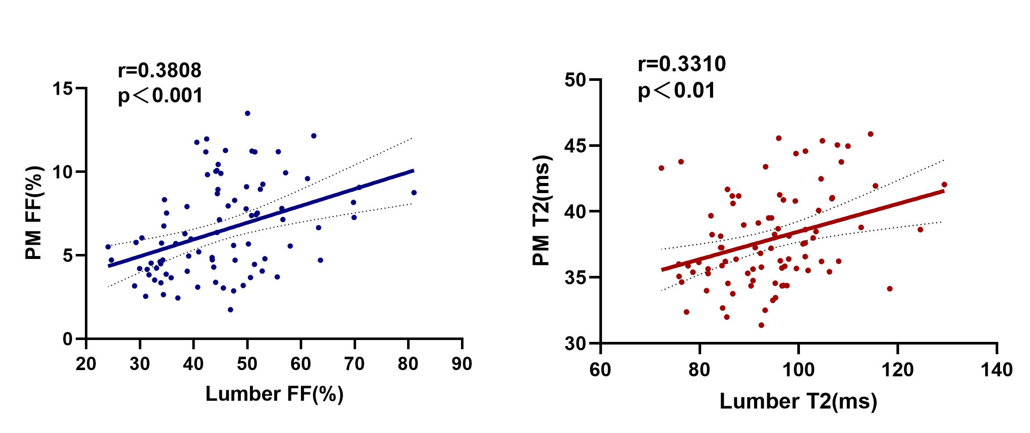
Figure 3 The correlation diagram was drawn to explore the relationship between Fat fraction (FF) of lumbar vertebra and FF of psoas major (PM), and the relationship between T2 value of lumbar vertebra and T2 value of psoas major.