1696
Sensitivity & Repeatability of UTE-T2* Mapping to Tendon Extension and Contraction1Stanford University, Stanford, CA, United States, 2NYU Grossman School of Medicine, New York, NY, United States
Synopsis
Keywords: Tendon/Ligament, Quantitative Imaging, T2*, Bi-exponential, UTE, CONES
Motivation: Tendon laxity, which may cause skeletal maltracking, can lead to pain and increased injury risk. Non-invasive measurement of tendon laxity remains a challenge but Ultrashort echo time (UTE)-T2* mapping may serve as a potential evaluation method.
Goal(s): This study aims to evaluate the sensitivity and repeatability of UTE-T2* mapping to tendon laxity.
Approach: We scanned the Achilles tendons of human subjects under tension and relaxation using UTE sequences.
Results: T2* relaxation times seemed to decrease as tendon load increased, from plantar flexion to dorsiflexion. However, the changes observed were small and intra-subject variability with position did not show any specific trends.
Impact: As the changes in T2* relaxation times were small and showed poor reproducibility, UTE-T2* mapping may not be sensitive enough to changes in tendon tensile loading and laxity.
Introduction
Tendon laxity, which may cause skeletal maltracking, can lead to pain and increased injury risk1. Non-invasive measurement of tendon laxity remains a challenge. Quantitative MRI using Ultrashort echo time (UTE) sequences can detect signals from tissues with short T2* relaxation times, such as tendons and ligaments, and are sensitive to changes in hydration, collagen content and organization. As tendon laxity and loading can lead to the movement of water molecules within the tendon as well as differences in collagen fiber alignment, it has been suggested that laxity can be detected using UTE-T2* relaxation2-4. However, as T2* relaxation times are sensitive to tendon orientation due to magic angle effects and low SNR, the utility of this approach is still unclear. This study aims to evaluate the sensitivity and reproducibility of UTE-T2* mapping to tendon laxity. We utilize the Achilles tendon, which aligns with the main magnetic field under tension (ankle dorsiflexion) and relaxation (ankle plantar flexion).Methods
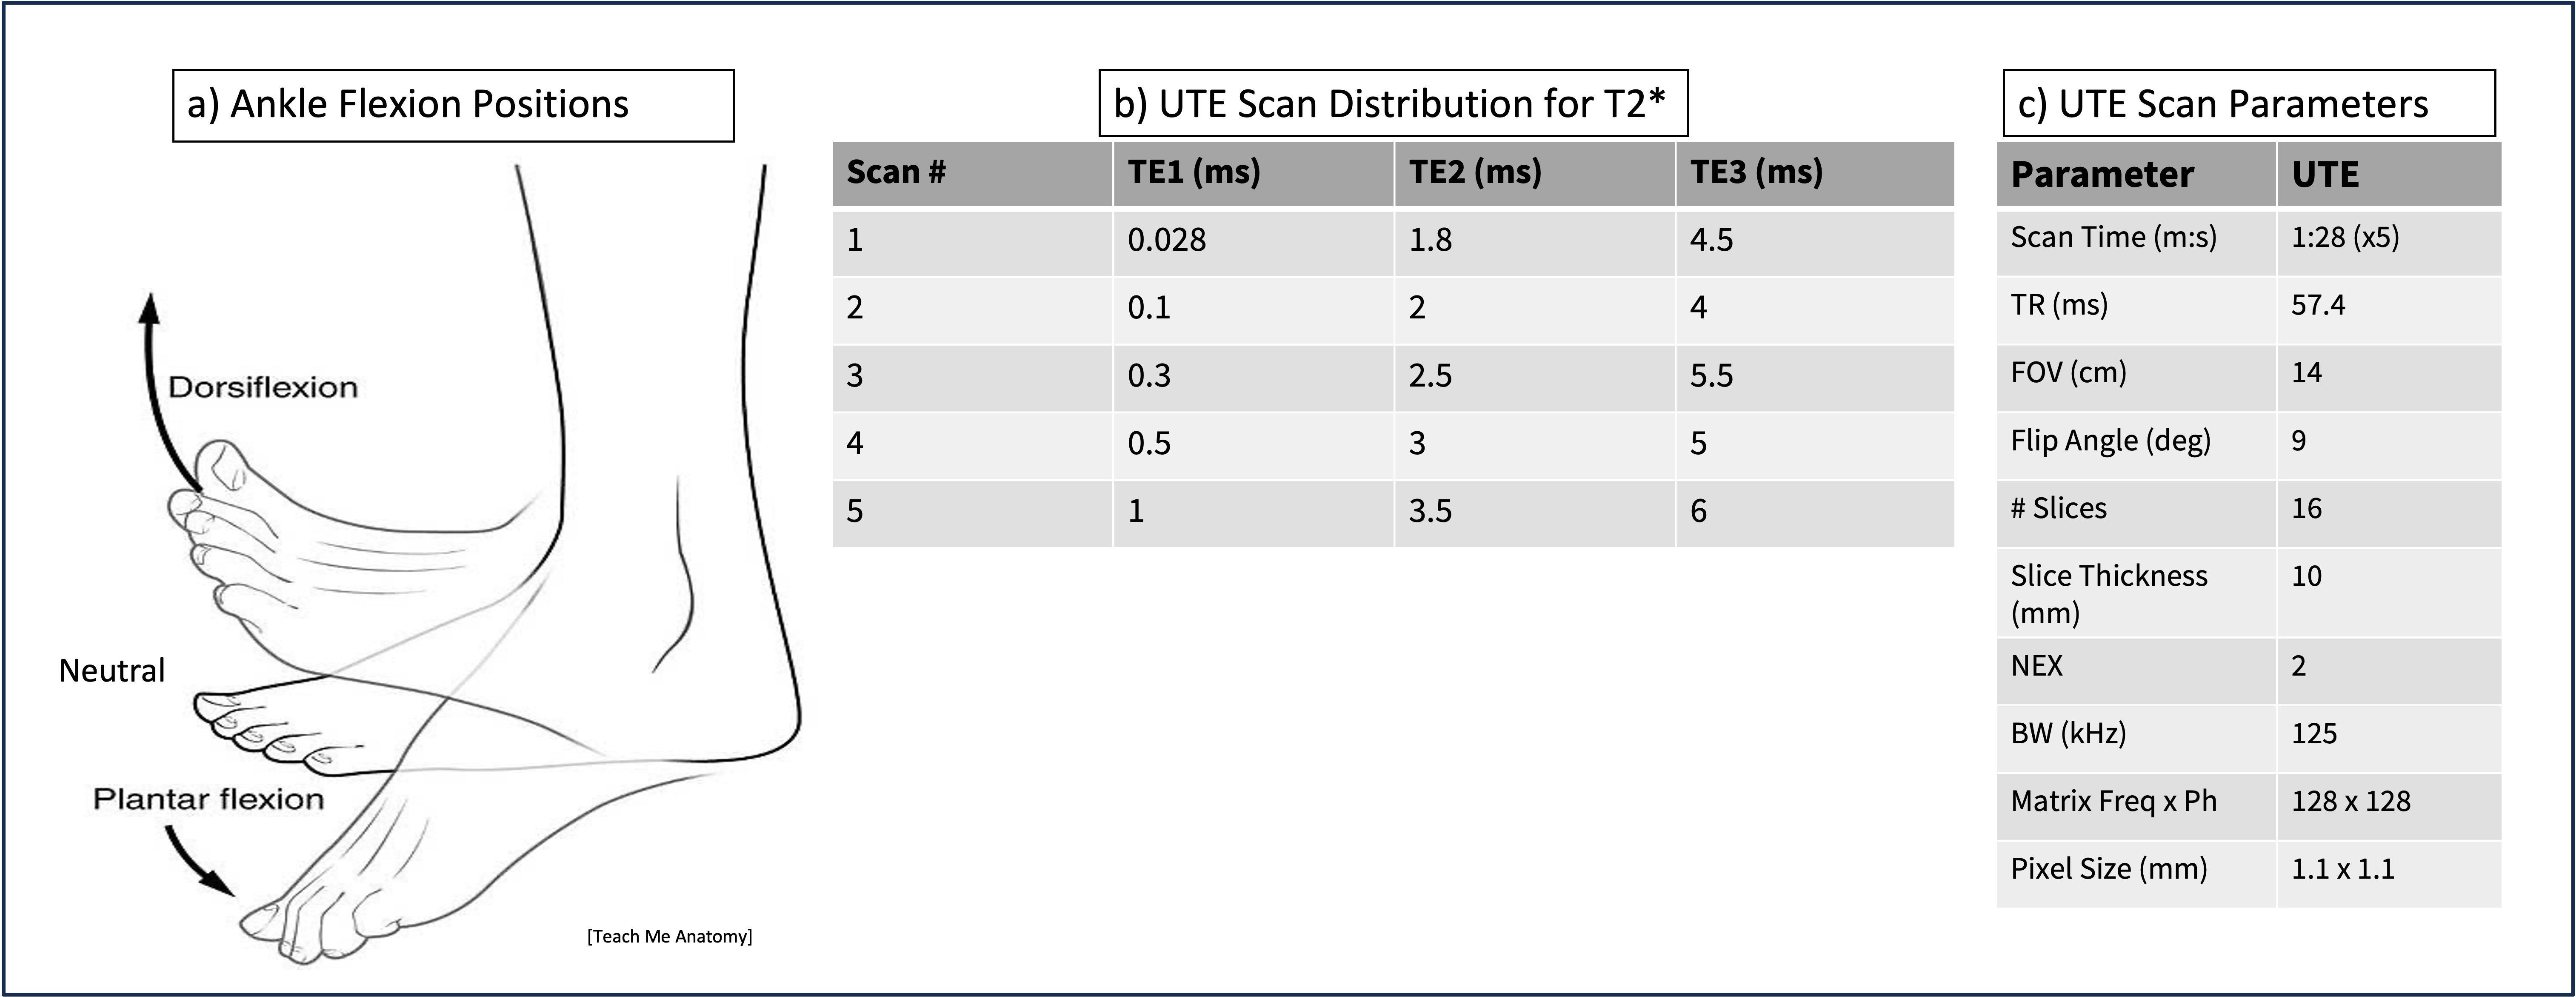
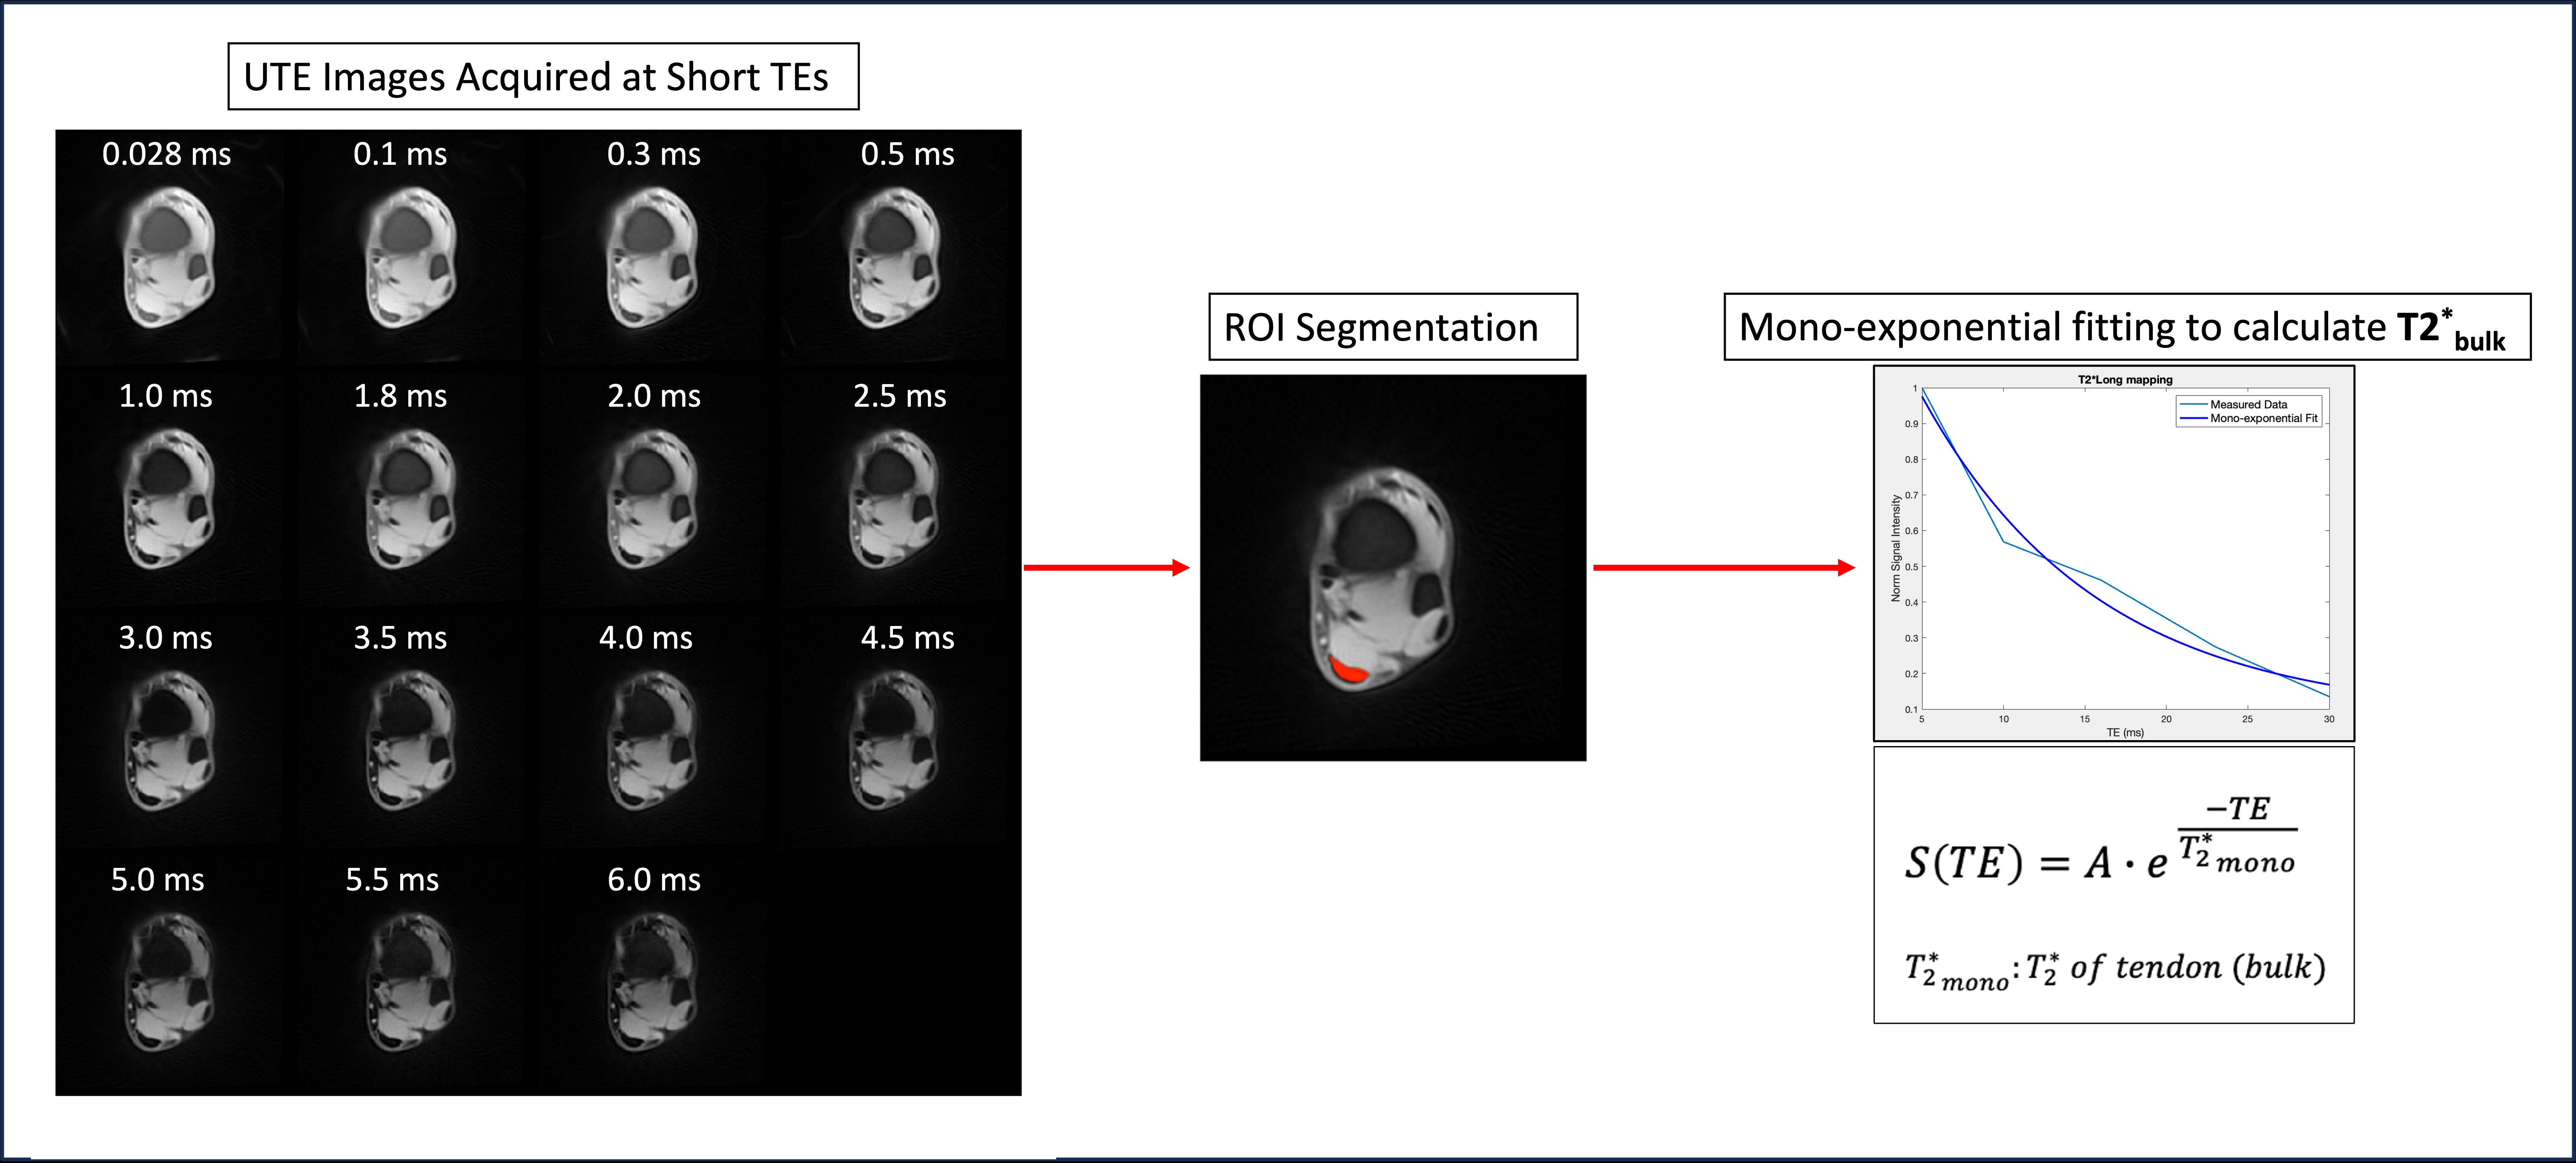
The Achilles tendons of 8 young, healthy subjects(5 females, aged 28 ± 4 yrs) were scanned on a 3T whole-body MRI using a 20-channel Multi-purpose AIR coil(GE Healthcare). Each subject was scanned twice in two separate sessions, seven days apart. In each session, participants repeated the scanning protocol in three positions of isometric ankle flexion: neutral, plantar flexion, and dorsiflexion, supported using an ankle holder. Axial multi-echo fat-saturated UTE-3DPR acquisitions were performed, with sequentially shifted echo times. In total, there were five sets with three echo times each(15 total), spanning from 0.028-6ms (scan parameters in Figure 1). For morphological assessment of the Achilles tendon, an axial spoiled gradient recalled(SPGR) scan was acquired. Manual segmentation of the Achilles tendon was performed to obtain a region of interest(ROI) for analysis. The data was fit to a mono-exponential model for each position, time point, and subject. All the fitting was done using user-defined models in MATLAB(Figure 2). A repeated ANOVA was performed to analyze differences across the three positions. Coefficients of variance (CV) and intraclass correlation coefficients (ICC) were calculated for reproducibility analysis.Results
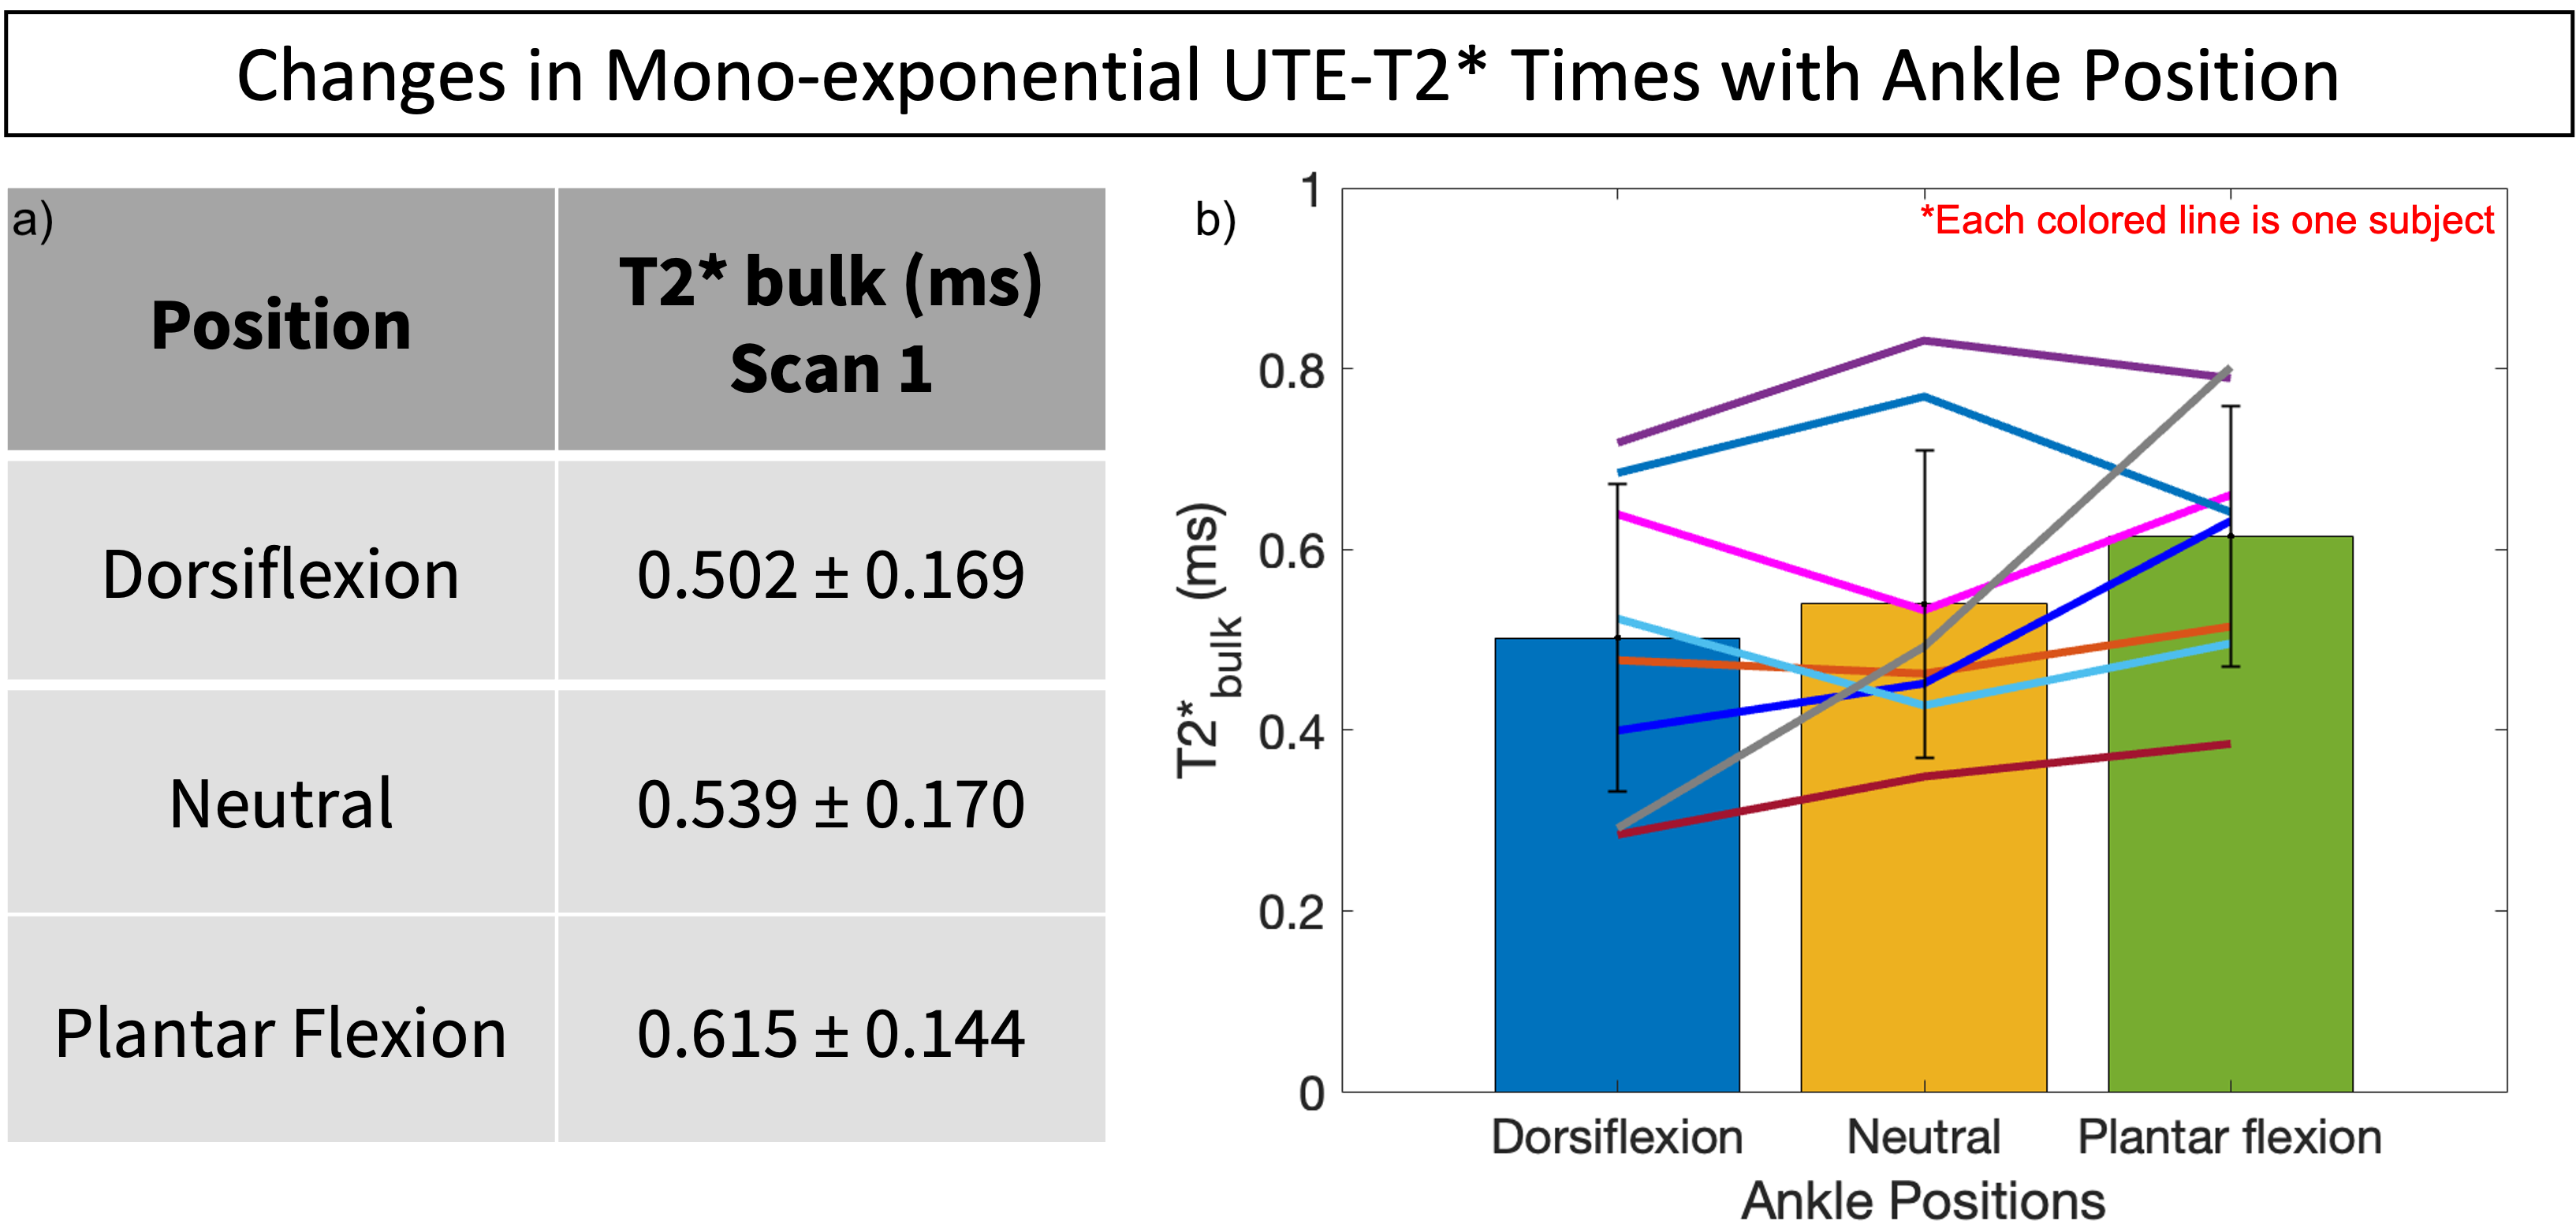
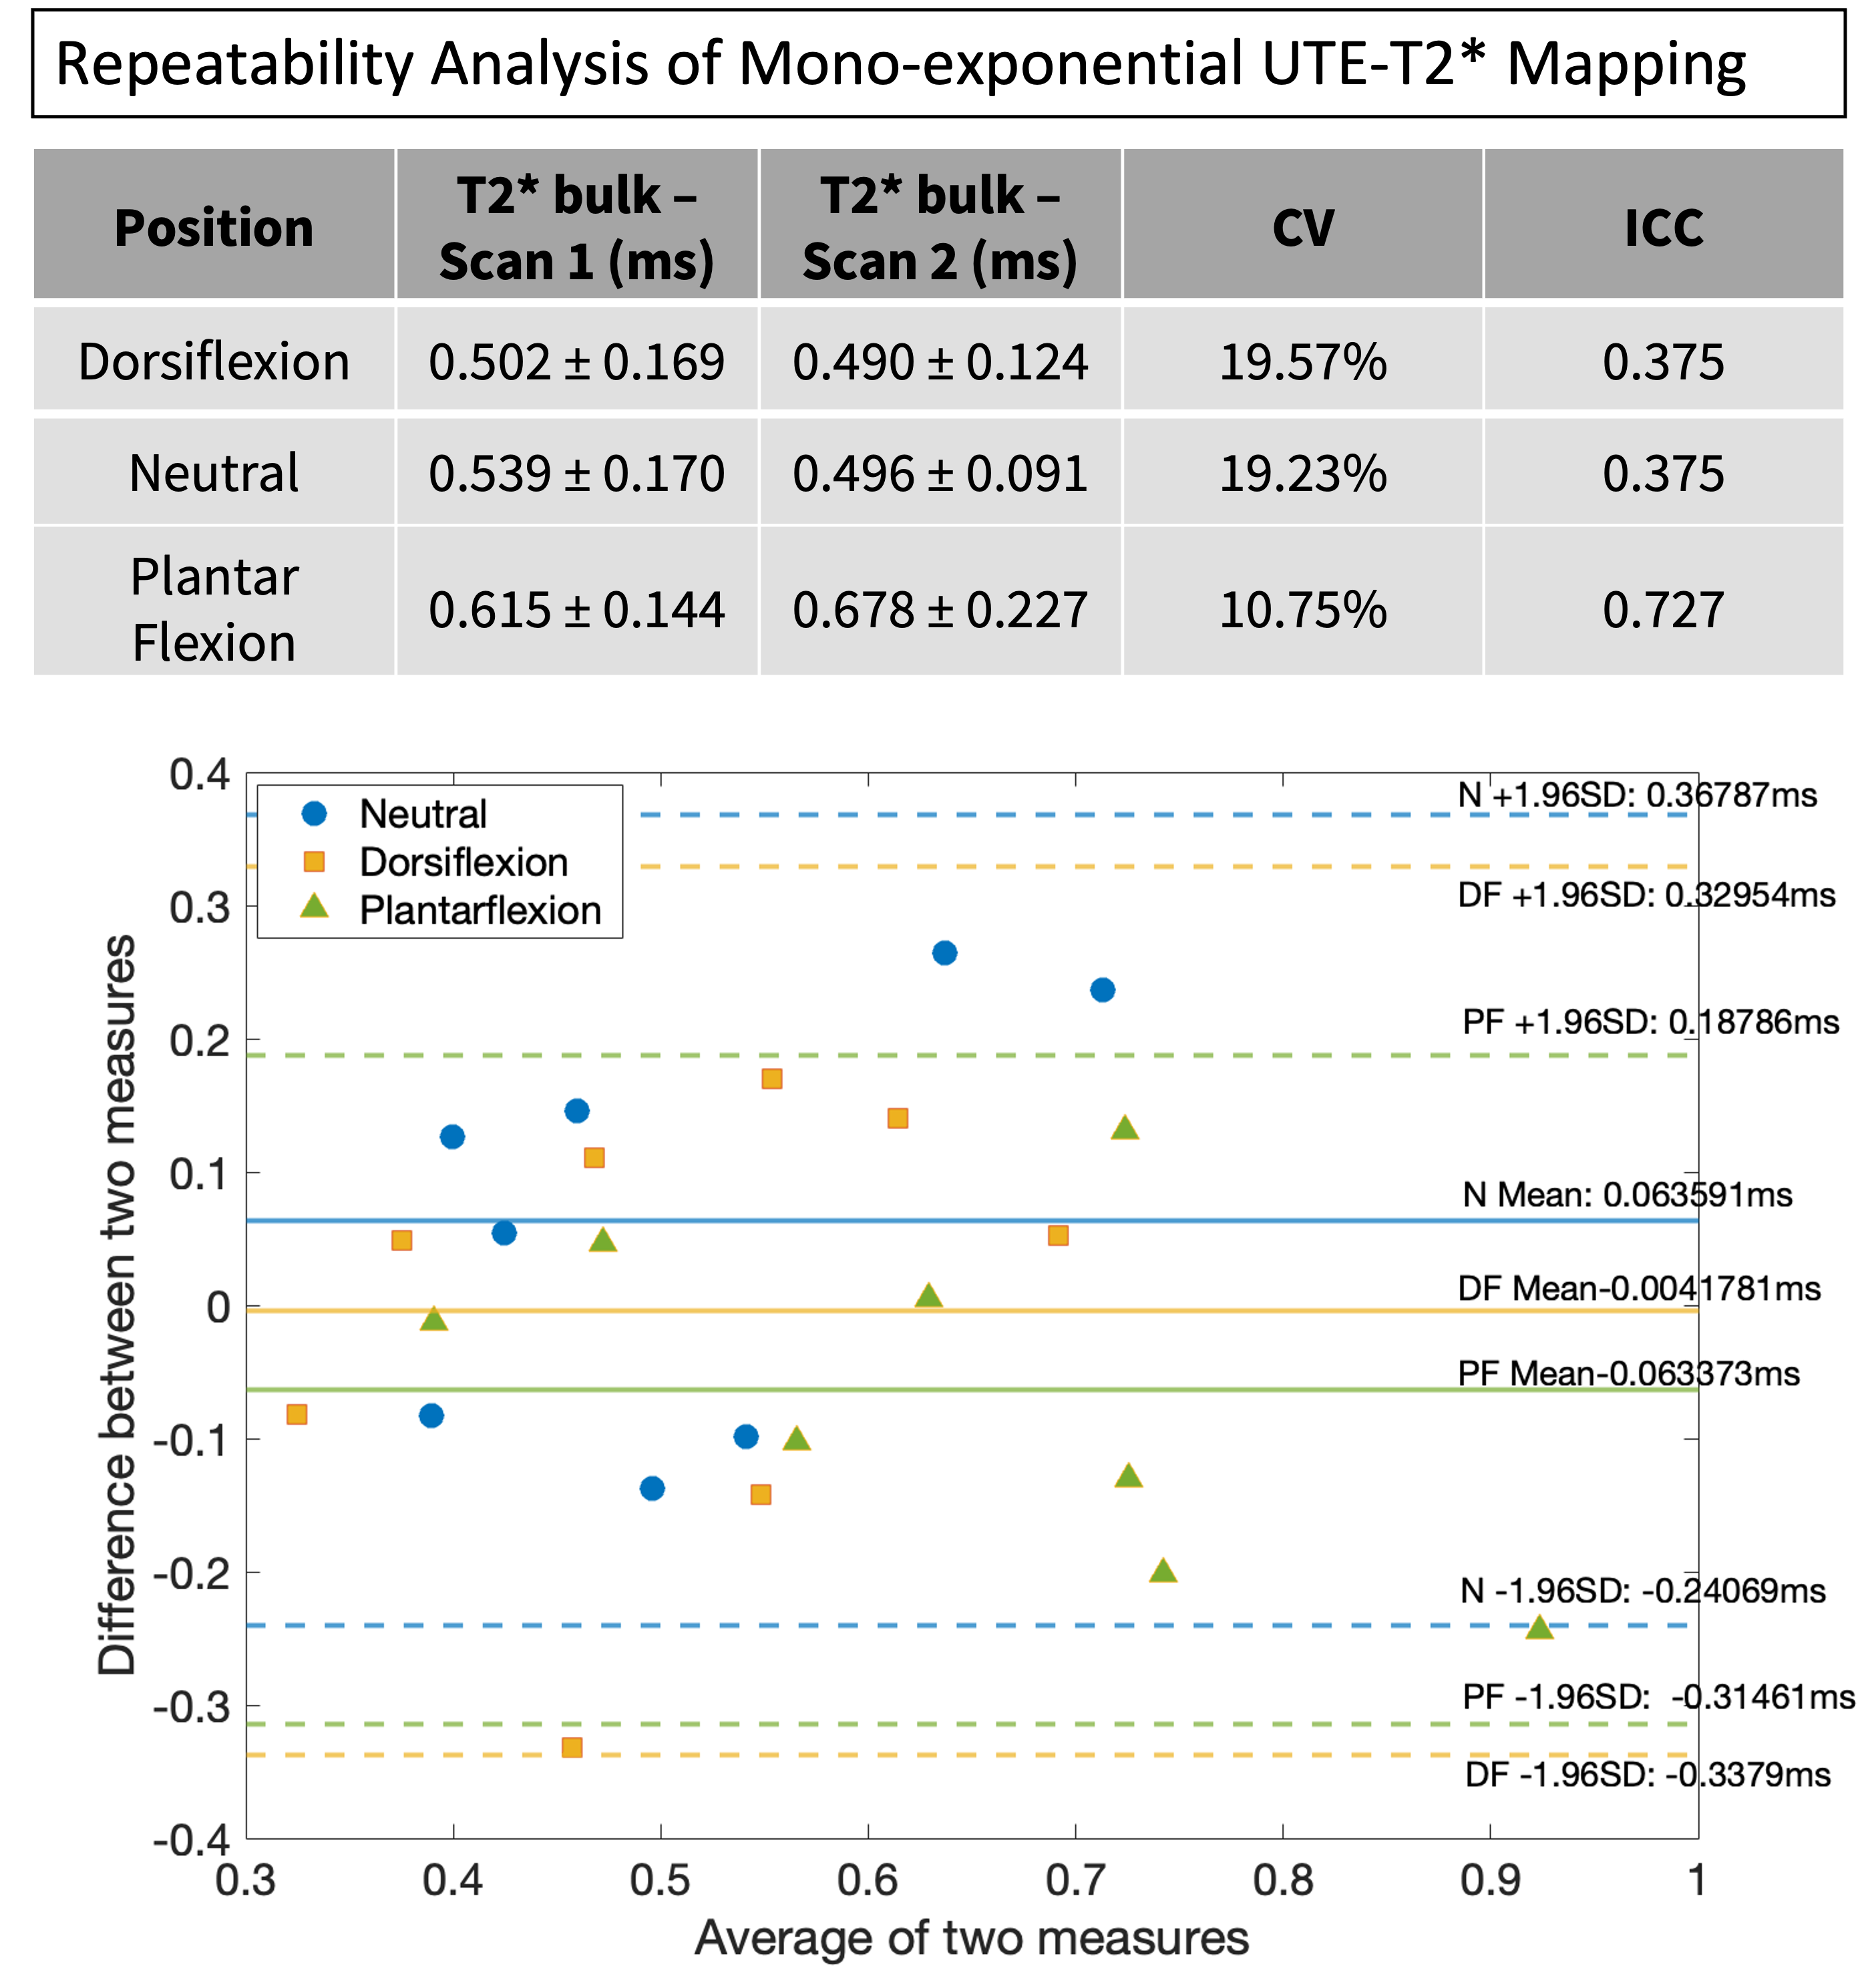
The ROI-based T2* relaxation times for the eight subjects are shown in Figure 3. The mean T2* relaxation times varied slightly between dorsiflexion (0.502±0.169ms), neutral (0.539±0.170ms), and plantar flexion (0.615±0.144ms) positions but did not show statistically significant differences (F(2, 14)=2.555, p=0.113). Further, intra-subject variability with position did not show any specific trends (Fig 3b).For the reproducibility analysis, a Bland-Altman plot shows the differences in measurements between the two time points for all three positions (Figure 4). The CV for the plantar flexion group (10.75%) was less than the neutral (19.23%) and dorsiflexion (19.57%) groups. The ICC values were calculated for each position; we found poor reliability for the neutral and dorsiflexion positions (0.375 for both) and moderate reliability for the plantar flexion position (0.727). The differences were as follows: neutral (average 0.064ms, 95%CI[-0.241,0.368]), dorsiflexion (average -0.004ms, 95%CI[-0.338,0.330]), and plantar flexion (average -0.064ms, 95%CI[-0.315,0.188]).
Discussion
We investigated the sensitivity of UTE-T2* to changes in tendon laxity using flexion and extension of the Achilles tendon as a model. T2* relaxation times seemed to decrease as tendon load increased, from plantar flexion (tendon relaxation) to dorsiflexion (tendon under tension). However, the changes observed were small, and intra-subject variability with position did not show any specific trends.Tensile loading of the tendon may affect T2* relaxation times in multiple ways: (1) movement of water molecules in response to load, (2) changes in water bound to collagen/proteoglycan mobility and binding, and (3) tendon fiber orientation (straight with tension, wavy with contraction) with respect to the main magnetic field (affects dipolar relaxation). As our echo times were acquired from 0.028-6ms, we expect that the computed T2* values are primarily due to the short T2* components in the tendon (water molecules bound to collagen/proteoglycans and their orientation relative to the magnetic field). This may explain the small changes that we observed; T2 increases for plantar flexion, given that tendon fibers may align non-uniformly (in a non-parallel manner) with the main magnetic field due to slacking of the tendon and reduction in length. However, given the variability of results across subjects and poor reproducibility of scans, this suggests applications of UTE-T2* mapping may not be sensitive enough to changes in tendon tensile loading and thus laxity. Further, we believe this result is generalizable as the Achilles tendon is likely the most straightforward tendon to study due to its large size and its insensitivity to its orientation relative to the main magnetic field, which is largely unaffected by ankle rotation or by tensile loading.
Acknowledgements
This work received research support from the Wu Tsai Human Performance Alliance, GE Healthcare, and NIH R01AR079431.References
[1] Sobel M, Geppert MJ, Warren RF. Chronic ankle instability as a cause of peroneal tendon injury. Clinical Orthopaedics and Related Research. 1993 Nov(296):187-191. PMID: 8222423
[2] Wellen J, Helmer KG, Grigg P, Sotak CH. Spatial characterization of T1 and T2 relaxation times and the water apparent diffusion coefficient in rabbit Achilles tendon subjected to tensile loading. Magn Reson Med. 2005;53(3):535-544. doi:10.1002/mrm.20361
[3] Mountain KM, Bjarnason TA, Dunn JF, Matyas JR. The functional microstructure of tendon collagen revealed by high-field MRI. Magn Reson Med. 2011;66(2):520-527. doi:10.1002/mrm.23036
[4] Peto S, Gillis P, Henri VP. Structure and dynamics of water in tendon from NMR relaxation measurements. Biophys J. 1990;57(1):71-84. doi:10.1016/S0006-3495(90)82508-X
[5] Boehm C, Diefenbach MN, Makowski MR, Karampinos DC. Improved body quantitative susceptibility mapping by using a variable-layer single-min-cut graph-cut for field- mapping. Magn Reson Med. 2021;85:1697–1712. https://doi.org/10.1002/mrm.28515
[6] Yu H, Shimakawa A, McKenzie CA, Brodsky E, Brittain JH, Reeder SB. Multiecho water-fat separation and simultaneous R2* estimation with multifrequency fat spectrum modeling. Magn Reson Med. 2008;60:1122-1134
[7]Diefenbach MN, Liu C, Karampinos DC. Generalized parameter estimation in multi-echo gradient-echo- based chemical species separation. Quant Imaging Med Surg 2020;10(3):554-567. doi: 10.21037/qims.2020.02.07
Figures