1695
Prediction of the Degree of Metal Artifact using Localizer sequences of Magnetic Resonance Imaging in Lumbar spine1Radiology, Seoul St.Mary's Hospital, Seoul, Korea, Republic of
Synopsis
Keywords: Bone, Artifacts
Motivation: Metal artifact reduction techniques needs longer scan time and shows incomplete MRI visibility for postoperative spinal evaluation.
Goal(s): We assessed the reliability of localizer sequence image factors for predicting the metal artifact range in MRI.
Approach: Multivariate ordinal logistic regression models were generated using prosthesis information and imaging factors measured on localizer images, to verify the factors correlated to the visibility of spinal canal and neural foramen on MRI.
Results: Metal artifact degree at midline and foramen level of sagittal plane and inter-screw distance of coronal plane in localizer images were significant factors affecting metal artifact range of MRI.
Impact: We found that the metal artifact degree in localizer sequence image can be correlated with the metal artifact range of diagnostic sequence image, and used to screen proper patients to apply metal artifact reduction sequence in postoperative spinal MRI.
Metal artifact on postoperative spine magnetic resonance imaging (MRI) has been a common concern, so several MR techniques to reduce these artifacts have been clinically attempted, including conventional metal artifact reduction (MAR) strategy using high-readout bandwidth, view-angle tilting (VAT) and slice-encoding for metal artifact correction (SEMAC) (1, 2). However, a substantial proportion of metal-induced artifacts persists and disrupts the image interpretation in spinal imaging (3, 4). Localizer sequence of MRI accounts for the small proportion of entire data set, but it can provide adequate information relevant with image findings on diagnostic sequence (5, 6). In this study, we assessed whether localizer sequence image (MR-L) factors can be reliably correlated with metal artifact range in conventional diagnostic sequence MRI (MR-D).
Methods
Patient inclusion
Patients with lumbar spinal fusion surgery and postoperative MRI between January 2019 and April 2022 were included. The clinical information including the type of interbody graft, transpedicular screw diameter and level of rod length were reviewed.
MRI scans
Lumbar spinal MRI was acquired by three 3-Tesla scanners. MR-L was based on gradient-echo (GRE) sequence (TR/TE=8/3.69ms, thickness=6mm, FOV=350x350, matrix=256x205) and composed of less than 5 sagittal and 5 coronal plane images. MR-D was consisted of two-dimensional fast spin-echo (FSE) T2-weighted image in sagittal (TR/TE=3300/99ms, thickness=3mm, FOV=280x280, matrix=320~512, readout bandwidth=200~450) and axial planes (TR/TE=4000/95ms, thickness=3~7mm, FOV=160x160, matrix=256~512, readout bandwidth=180~500).
Imaging evaluation
Two radiologists (R1, R2) evaluated the MR-L and MR-D according to following criteria, respectively. On MR-L, metal artifact degree was evaluated in 3-scale grading system on sagittal plane at midline (sag-midline) and neural foramen (sag-foramen) levels. Also, we measured the distance between bilateral transpedicular screws (cor-distance) and the diameter of unilateral screw-derived artifact (cor-diameter) at foramen level on the coronal plane. Lastly, scoliosis degree was measured using Cobb’s angle. On MR-D, the visibility of spinal canal and neural foramen was graded in 5-scale confidence score at the axial and sagittal image, respectively.
Statistics
Two multivariate ordinal logistic regression models were generated to respectively predict the visibility of spinal canal and neural foramen, after the selection of statistically significant clinical and MR-L factors using univariate ordinal logistic regression. The inter-machine and intra-machine reliability of MR-L factors were evaluated using kappa analysis and intraclass correlation coefficient, using the MRI of the patients who scanned on the same or different MRI scanner more than once.
Results
Total 163 patients were included, and 14 and 26 patients had two follow-up MRIs scanned on same and different MRI scanner, respectively. Also, 6 patients had follow-up MRIs with conventional MAR sequence. The median value of screw diameter and rod level length were 6.5mm and 2 vertebral body levels, respectively. The most frequently inserted interbody graft was TLIF.
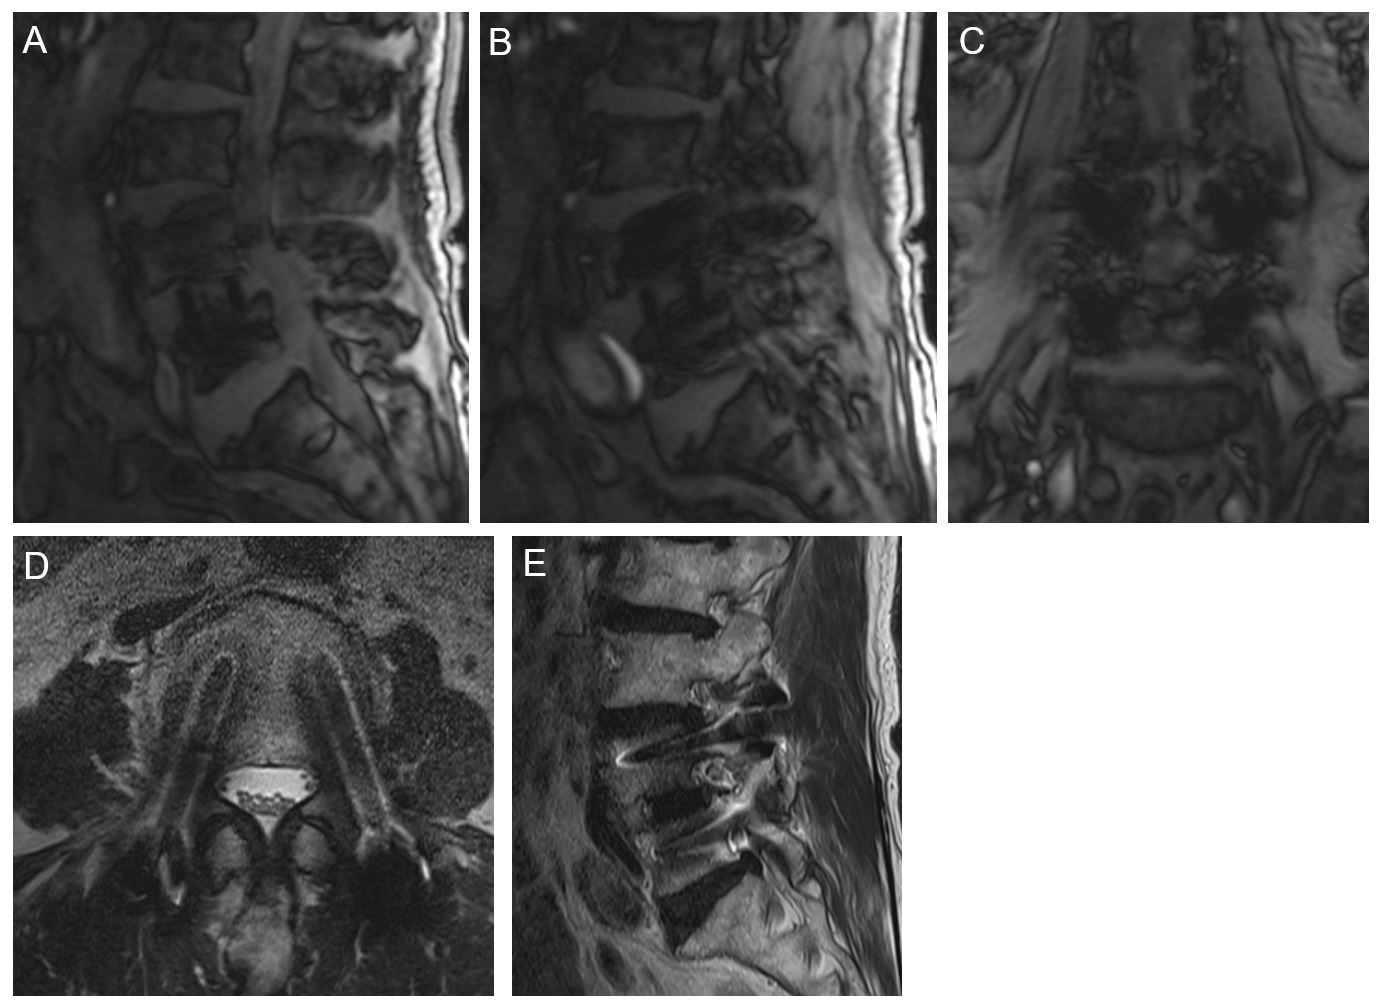
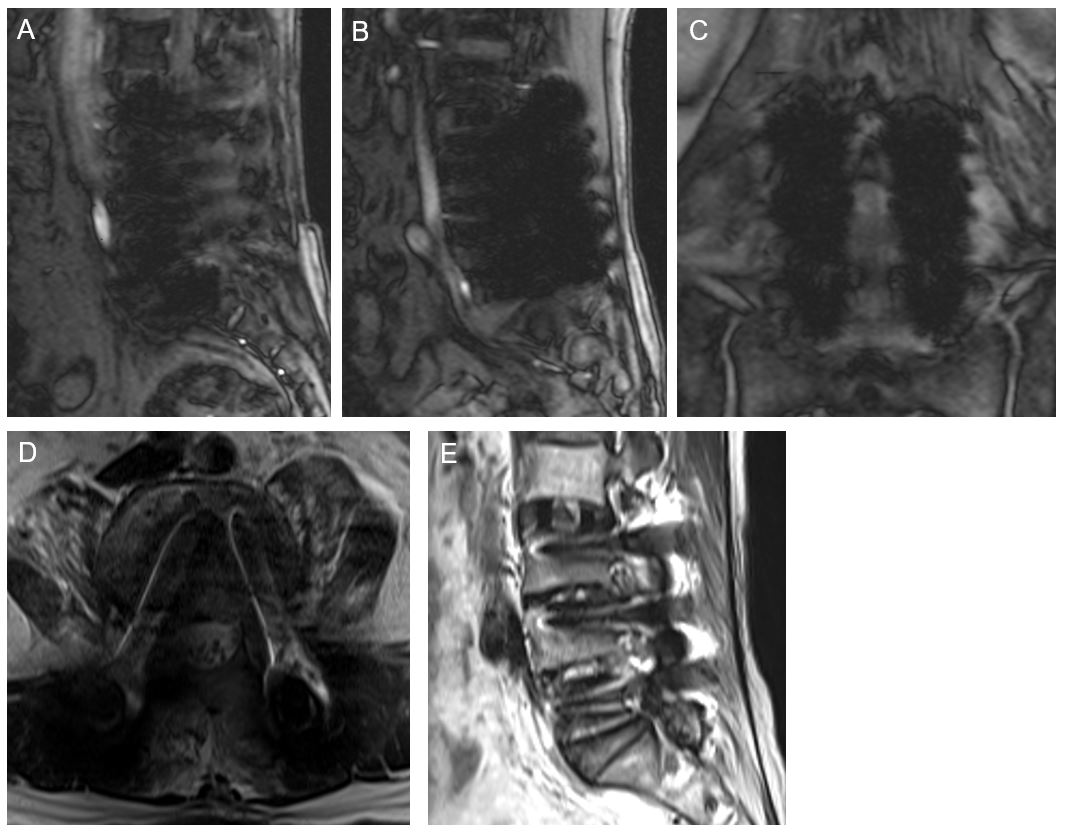
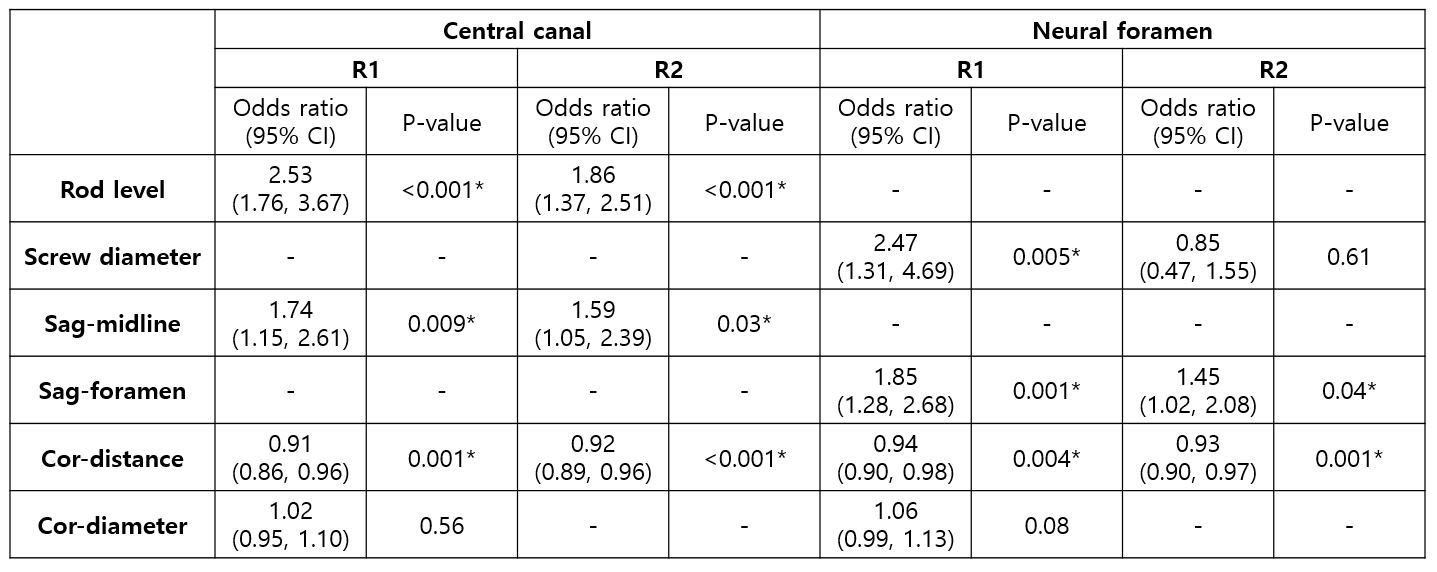
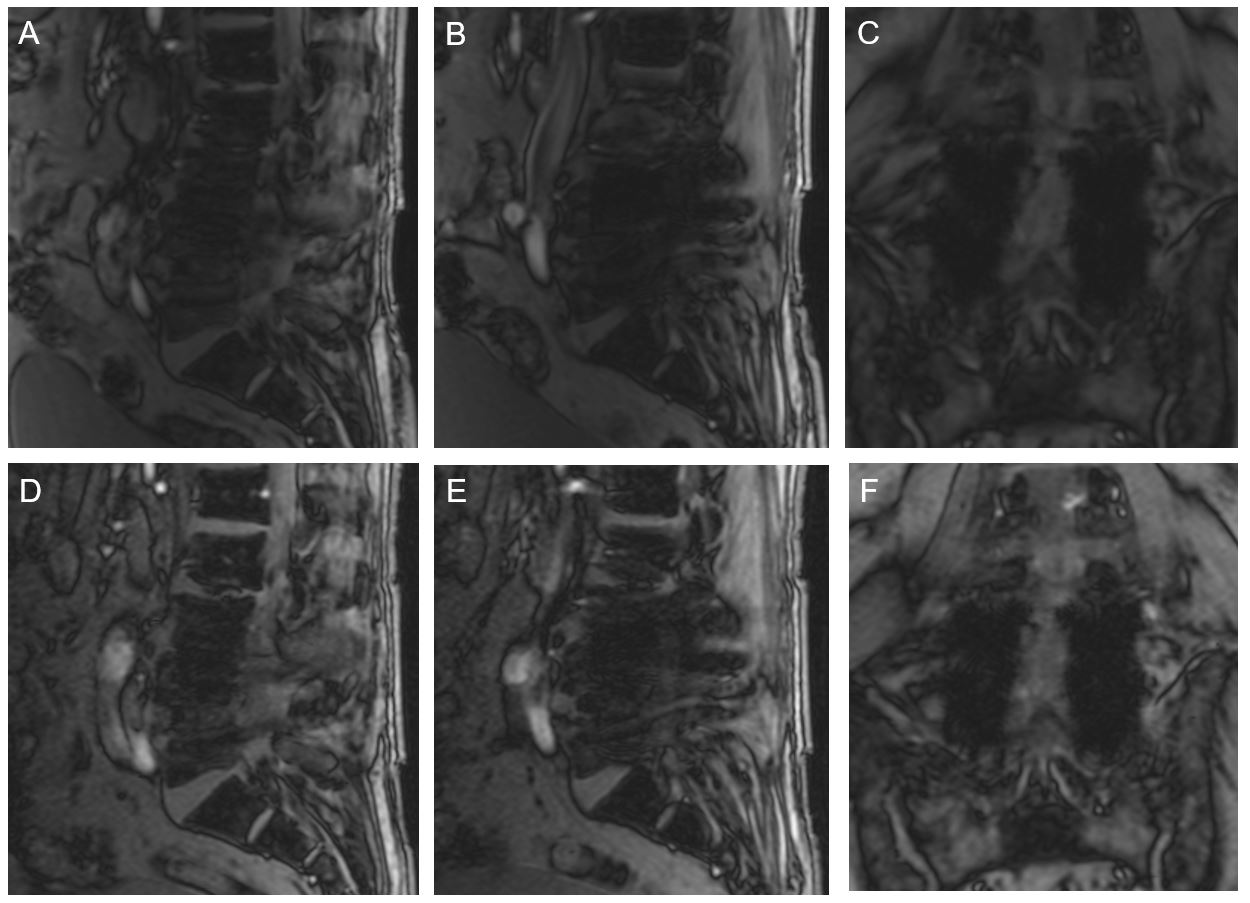
The level of rod length (p<0.001 in R1 and R2), sag-midline score (p=0.009 and 0.03 in R1 and R2) and cor-distance score (p=0.001, p<0.001 in R1 and R2) were significant MR-L factors to predict the visibility of spinal canal on MR-D in both radiologists. Also, transpedicular screw diameter (p=0.005 and 0.6 in R1 and R2), sag-foramen score (p=0.001 and 0.04 in R1 and R2) and cor-distance score (p=.0.004 and 0.001 in R1 and R2) were significant MR-L factors to predict the visibility of neural foramen on MR-D in R1, and the result of R2 analysis was same except for the transpedicular screw diameter (Fig.1 and 2, Table 1).
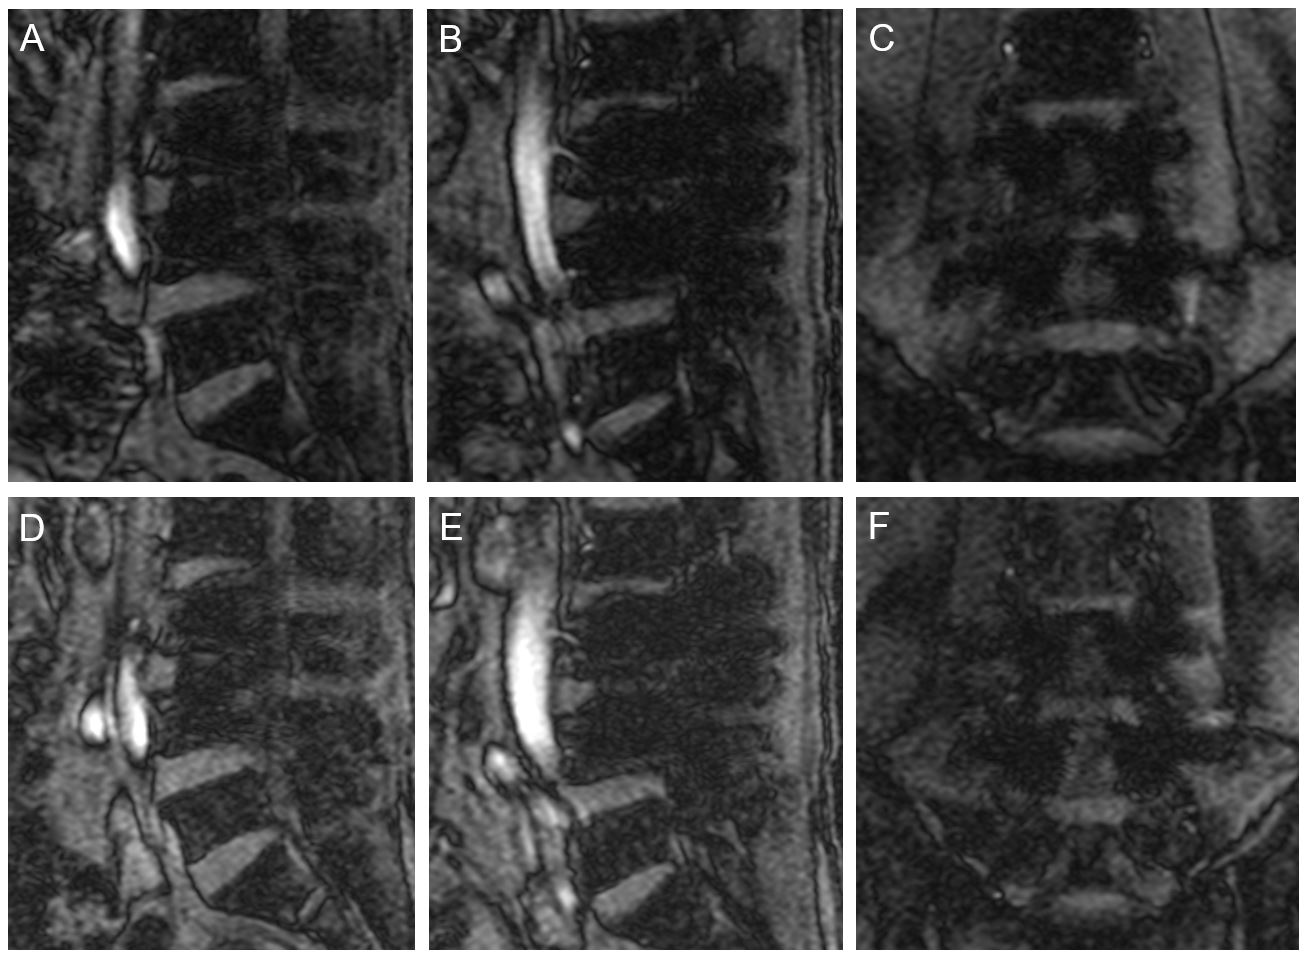
Intra-machine and inter-machine reliability of MR-L factors were moderate and substantial in sag-midline score (κ=0.45, 0.69), moderate and slight in sag-foramen score (κ=0.51, 0.16), and moderate and good in cor-distance score (ICC=0.67, 0.86), respectively (Fig.3 and 4). In 6 MAR sequence MRIs, 2 and 5 patients showed improved visibility in spinal canal (average confidence score from 1.8 to 1.5) and neural foramen (average confidence score from 2.3 to 1.2), respectively.
Discussion
Metal artifact degree on MR-L can be correlated with the metal artifact range on MR-D. Despite the MAR with FSE sequence over GRE sequence, the basic information from GRE sequence image can help predicting the metal artifact degree on FSE sequence image, regardless of the variable MR-D parameter settings. By evaluating several MAR sequence MRIs, we found that adjusting detailed MAR parameters can reduce metal artifact in MR-D. Therefore, evaluation of the metal artifact range on MR-L would be helpful to choose the proper patients to apply the MAR technique and reduce the scanning workload.
Conclusion
Metal artifact degree in sagittal and coronal planes of localizer sequence image can predict the metal artifact range of diagnostic sequence image and screen the proper patients to apply MAR sequence.
Acknowledgements
No acknowledgement found.References
1. Jungmann PM, Agten CA, Pfirrmann CW et al. Advances in MRI around metal. J Magn Reson Imaging 2017;46:972-991.
2. Khodarahmi I, Isaac A, Fishman EK et al. Metal about the hip and artifact reduction techniques: from basic concepts to advanced imaging. Semin Musculoskelet Radiol 2019;23:e68-e81.
3. Chankue Park, Eugene Lee, Yujin Yeo et al. Spine MR images in patients with pedicle screw fixation: Comparison of conventional and SEMAC-VAT sequences at 1.5 T. J Magn Reson Imaging 2018;54:63-70.
4. Han SB, Yoon YC, Kwon JW et al. Comparison Study between Conventional Sequence and Slice-Encoding Metal Artifact Correction (SEMAC) in the Diagnosis of Postoperative Complications in Patients Receiving Lumbar Inter-Body Fusion and Pedicle Screw Fixation Surgery. PLoS ONE 2016;11(10): e0163745.
5. Thaker S, Botchu R, Gupta H et al. Magnetic resonance spine localizers – The “forgotten” treasure. Indian J Musculoskelet Radiol 2022;4:128-33.
6. A. Bazzocchi, G. Garzillo, F. Fuzzi, et al. Localizer sequences of magnetic resonance imaging accurately identify osteoporotic vertebral fractures. Bone 2014;61:158-163.
Figures