1694
MRI relaxometry techniques combined with MAIT cell parameters for the assessment of disease activity in axial spondyloarthritis (axSpA)1Shengli Clinical Medical College of Fujian Medical University; Radiology department of Fujian Provincial Hospital, Fuzhou, China, 2Radiology department of, Fuzhou Second Hospital, Fuzhou, China, 3Shengli Clinical Medical College of Fujian Medical University; Rheumatism department of Fujian Provincial Hospital, Fuzhou, China, 4MR Research Collaboration Team, Siemens Healthineers Ltd., Shanghai, China
Synopsis
Keywords: Bone, Relaxometry, Axial spondyloarthritis, T1 mapping
Motivation: Currently, there is a lack of an objective quantitative measure to comprehensively evaluate the inflammatory activity of axSpA, which poses certain challenges in accurately assessing the disease activity.
Goal(s): To establish a more reliable combined-parameter model for assessing the inflammatory activity of axSpA.
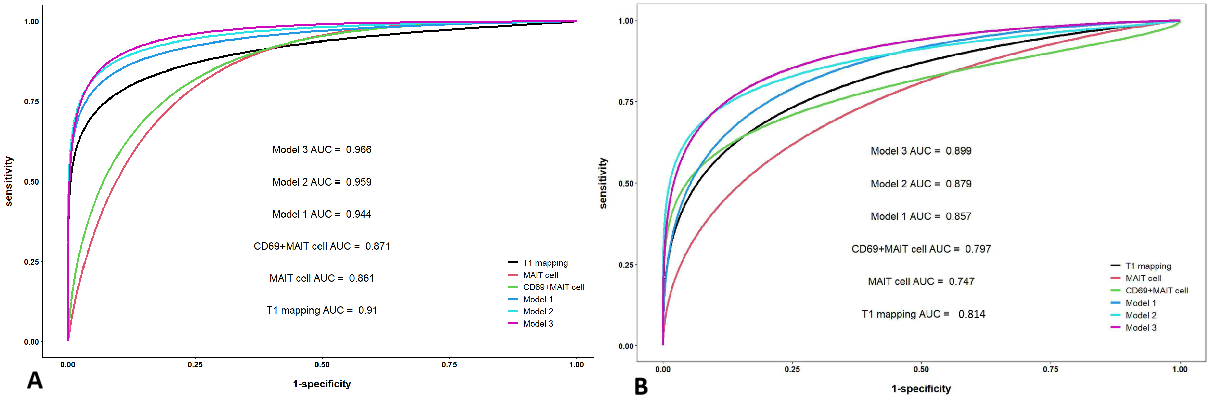
Approach: T1 mapping values, T2* mapping values and the frequency of MAIT cells and CD69+MAIT cells are constructed into single-parameter and combined-parameter models using logistic regression. The diagnostic efficacy was evaluated by employing the ROC curves.
Results: The model combining T1 mapping with CD69+MAIT cells showed relatively superior diagnostic efficacy in differentiating the severity of axSpA disease activity.
Impact: The combined-parameter model incorporating T1 mapping and CD69+MAIT cells provided an effective objective quantitative indicator for evaluating the inflammatory activity of axSpA.
Introduction
Axial Spondyloarthritis (axSpA) is a chronic inflammatory disease primarily affecting the sacroiliac joints (SIJs). Characterized by an early onset and insidious progression 1-2. several studies have highlighted the significant role of persistent inflammation in the SIJs in facilitating the process of structural damage in axSpA 3-4. This is intimately associated with poor prognosis 5. Therefore, early diagnosis and treatment of axSpA to reduce the inflammatory activity is pivotal in halting progressive disease progression and improving the quality of life. Ankylosing Spondylitis Disease Activity Score (ASDAS) is recommended as the preferred indicator in clinical practice 6-8. However, it mainly evaluates the symptoms of patients, making it difficult to avoid subjectivity, and the uniformity and accuracy cannot be ensured. Magnetic relaxometry technique, detecting subtle changes of water molecules in tissue, can quantitatively assess the extent of subchondral bone marrow edema (BME) in the SIJs, which has been applied in early diagnosis and disease activity assessment in axSpA patients 9-11. Despite this, axSpA is a heterogeneous disease, and the presence of BME in the SIJs can vary among individuals. Some patients may exhibit high ASDAS even without BME in the SIJs, suggesting a potential lag or fluctuation in BME during active inflammation 12-13. The secretion of cytokines such as tumor necrosis factor (TNF) and IL-17 by Mucosal-associated invariant T (MAIT) cells has been recognized as an important role in the inflammation occurrence and progression of axSpA, and the treatment strategies targeting TNF and IL-17 have been widely applied in clinical practice 14-16. However, research on the variations in the frequency and activity of MAIT cells in peripheral blood in axSpA patients, as well as in assessing the inflammatory activity level of axSpA, is limited. This study combines MRI relaxometry techniques with the frequency and activity of MAIT cells in peripheral blood in order to explore a more reliable integrated model that reflects the inflammatory activity of axSpA.Methods
This study included 88 axSpA patients (mean age 31.0, 69 male) and 20 controls (mean age 28.0, 12 male). The axSpA group was classified into active (n=50) and inactive (n=38) groups based on ASDAS-CRP. The axSpA group was defined as patients who met the 2019 ASAS criteria for axSpA and (b) had complete clinical and MRI data. The control group met the following criteria: (a) patients who underwent SIJs MRI examination due to chronic lower back pain and (b) absence of positive signs in the subchondral bone. All participants underwent SIJs MRI scans, including T1 mapping and T2* mapping, using a 1.5T MRI scanner (MAGNETOM Aera, SIEMENS Healthcare, Erlangen, Germany) and flow cytometry analysis of peripheral blood MAIT cells by flow cytometer (BD Accuri C6 PLUS). T1 mapping parameters were: TR/TE=11/1.57ms, FOV=240 × 240 mm, scan matrix=256 × 256mm, slice thickness=3mm. T2 mapping parameters were: TR/TE=422/4.18ms, FOV=240 × 240 mm, scan matrix=256 × 256mm, slice thickness=3mm. For data analysis, T1 mapping and T2* mapping values and the frequency of MAIT cells and CD69+MAIT cells were compared between (a) the control group and the axSpA group, (b) the control group and the subgroups. The correlation between ASDAS-CRP and T1 mapping and MAIT cell and CD69+MAIT cell was assessed using a Spearman test. Single-parameter and combined-parameter models were established using logistic regression, and the ROC curves were employed to evaluate the diagnostic efficacy.Results
The axSpA group and its subgroups showed higher T1 mapping values in the SIJs and increased frequency of CD69+MAIT cells in peripheral blood compared to the control group. The active group had higher T1 mapping values and frequency of CD69+MAIT cells than the inactive group. Conversely, the control group had significantly lower frequency of MAIT cells than the axSpA group, inactive group, and active group. The inactive group had lower MAIT cells than the active group. In the axSpA group, there was a positive correlation between ASDAS-CRP and T1 mapping values, as well as the frequency of CD69+MAIT cells, whereas the frequency of MAIT cells showed a negative correlation. The model combining T1 mapping with CD69+MAIT cells demonstrated relatively superior diagnostic efficacy in differentiating the degree of axSpA disease activity.Discussion & Conclusions
This study suggests that T1 mapping values, MAIT cells, and CD69+MAIT cells can be used as quantifiable indicators to assess inflammatory activity in axSpA. Moreover, the combined-parameter model of T1 mapping and CD69+MAIT cells is more effective in evaluating the disease activity of axSpA.Acknowledgements
Thanks to technician Shengmei Lin, Jiawei Su and nurse Fang Huang who helped in the MR examination. Thanks to Fayang Lian who works in the scientific research department of the hospital to provide scientific consultation. Thanks very much to Professor Shaowei Lin for support in statistics.References
1 Sieper J, Poddubnyy D. Axial spondyloarthritis. Lancet. 2017;390(10089):73-84.
2 Dougados M, Baeten D. Spondyloarthritis. Lancet. 2011 Jun 18;377(9783):2127-37.
3 Ramiro S, van der Heijde D, van Tubergen A, et al. Higher disease activity leads to more structural damage in the spine in ankylosing spondylitis: 12-year longitudinal data from the OASIS cohort. Ann Rheum Dis. 2014;73(8):1455-1461.
4 Smolen JS, Schöls M, Braun J, et al. Treating axial spondyloarthritis and peripheral spondyloarthritis, especially psoriatic arthritis, to target: 2017 update of recommendations by an international task force [published correction appears in Ann Rheum Dis. 2018 Mar;77(3):472]. Ann Rheum Dis. 2018;77(1):3-17.
5 Dougados M, d'Agostino MA, Benessiano J, et al. The DESIR cohort: a 10-year follow-up of early inflammatory back pain in France: study design and baseline characteristics of the 708 recruited patients. Joint Bone Spine. 2011;78(6):598-603.
6 Lukas C, Landewé R, Sieper J, et al. Development of an ASAS-endorsed disease activity score (ASDAS) in patients with ankylosing spondylitis. Ann Rheum Dis. 2009;68(1):18-24.
7 Machado P, Landewé R, Lie E, et al. Ankylosing Spondylitis Disease Activity Score (ASDAS): defining cut-off values for disease activity states and improvement scores. Ann Rheum Dis. 2011;70(1):47-53.
8 Navarro-Compán V, Sepriano A, El-Zorkany B, van der Heijde D. Axial spondyloarthritis. Ann Rheum Dis. 2021;80(12):1511-1521.
9 Jiang Y, Li W, Zheng J, Zhang K, Liu C, Hong G. Magnetic resonance image compilation sequence to quantitatively detect active sacroiliitis with axial spondyloarthritis. Quant Imaging Med Surg. 2022;12(7):3666-3678.
10 Zhang K, Liu C, Zhu Y, et al. Synthetic MRI in the detection and quantitative evaluation of sacroiliac joint lesions in axial spondyloarthritis. Front Immunol. 2022 Sep 26;13:1000314.
11Lin M, Chen X, Yu S, Gao F, Ma M. Monitoring the efficacy of tumor necrosis factor alpha antagonists in the treatment of Ankylosing spondylarthritis: a pilot study based on MR relaxometry technique. BMC Med Imaging. 2021;21(1):117. Published 2021 Jul 30.
12 van Onna M, van Tubergen A, Jurik AG, van der Heijde D, Landewé R. Natural course of bone marrow oedema on magnetic resonance imaging of the sacroiliac joints in patients with early inflammatory back pain: a 2-year follow-up study. Scand J Rheumatol. 2015;44(2):129-134.
13 Sengupta R, Marzo-Ortega H, McGonagle D, Wadeley A, Bennett AN; British Society for Spondyloarthritis. Short-term Repeat Magnetic Resonance Imaging Scans in Suspected Early Axial Spondyloarthritis Are Clinically Relevant Only in HLA-B27-positive Male Subjects. J Rheumatol. 2018;45(2):202-205.
14 Gracey E, Qaiyum Z, Almaghlouth I, et al. IL-7 primes IL-17 in mucosal-associated invariant T (MAIT) cells, which contribute to the Th17-axis in ankylosing spondylitis. Ann Rheum Dis. 2016;75(12):2124-2132.
15 Mauro D, Thomas R, Guggino G, Lories R, Brown MA, Ciccia F. Ankylosing spondylitis: an autoimmune or autoinflammatory disease?. Nat Rev Rheumatol. 2021;17(7):387-404.
16 Sieper J, van der Heijde D, Dougados M, et al. Efficacy and safety of adalimumab in patients with non-radiographic axial spondyloarthritis: results of a randomised placebo-controlled trial (ABILITY-1). Ann Rheum Dis. 2013;72(6):815-822.
Figures

Fig. 1, male, 23 years old, HLA-B27: +, CRP:<0.715mg/L, ASDAS-CRP:0.6, belonged to the inactive group. (A) The coronal plane of PDWI-FS showed no obvious high signal intensity in the subchondral bone of bilateral sacroiliac joints. (B) Pseudo-color T1 mapping imaging showed the T1 mapping values of regions of interest is 653.73 ms. (C) Pseudo-color T2* mapping imaging showed the T2* mapping values of regions of interest is 9.3 ms. (D) The frequency of MAIT cells was 4.6%. (E) The frequency of CD69+MAIT cells was 12.3%.

Fig. 2, female, 30 years old, HLA-B27: +, CRP:88.3mg/L, ASDAS-CRP:5.2, belonged to the active group. (A) The coronal plane of PDWI-FS showed obvious high signal intensity in the subchondral bone of right bilateral sacroiliac joints, and the corresponding articular surfaces are rough. (B) Pseudo-color T1 mapping imaging showed the T1 mapping values of regions of interest is 1317.0ms. (C) Pseudo-color T2* mapping imaging showed the T2* mapping values of regions of interest is 14.8ms. (D) The frequency of MAIT cells was 2.3%. (E) The frequency of CD69+MAIT cells was 15.2%.