1688
Radiomic Features Outperform Clinical Metrics in Distinguishing Femoroacetabular Impingement Patients from Healthy Subjects1Bernard and Irene Schwartz Center for Biomedical Imaging, Department of Radiology,, New York University Grossman School of Medicine, New York, New York, USA, new york, NY, United States, 2Center for Advanced Imaging Innovation and Research (CAI2R), Department of Radiology, New York University Grossman School of Medicine, New York, New York, USA, new york, NY, United States, 3Department of Radiology, New York University Grossman School of Medicine, New York, New York, USA, new york, NY, United States, 4Department of Orthopedic Surgery, New York University Grossman School of Medicine, New York, New York, USA, new york, NY, United States
Synopsis
Keywords: Whole Joint, Radiomics, femoroacetabular impingement, Radiomics, machine learning
Motivation: Radiomics could differentiate the symptomatic hip from the asymptomatic contralateral hip in patients with femoroacetabular impingement (FAI). This study investigates its potential in distinguishing FAI patients from healthy subjects.
Goal(s): To compare the diagnostic performance of radiomic features and clinical metrics in FAI diagnosis.
Approach: We used 3D Dixon MRI data (10 healthy subjects and 10 FAI patients). We trained machine learning models on radiomic features extracted from MRI to classify subjects as healthy or FAI. Models were trained also on clinical metrics for comparison.
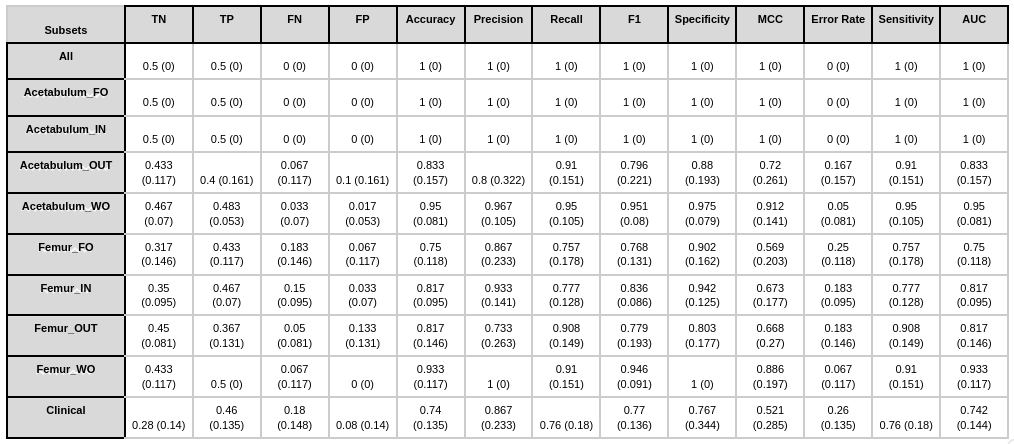
Results: Radiomic features accurately identified FAI patients without errors (100% accuracy). Clinical metrics achieved 74% accuracy.
Impact: Radiomic features exhibited a remarkable diagnostic performance, accurately identifying all FAI patients and healthy subjects. This study shows the promise of radiomics to enable automated FAI diagnosis.
Introduction
Femoroacetabular impingement (FAI) is a common cause of hip and groin pain in young adults. It is caused by abnormal contact between the femoral head and the acetabular rim1,2. Radiologic evaluation of FAI typically includes magnetic resonance imaging (MRI), which can assess bone morphology and identify damage to the cartilage and labrum3. A recent study showed that radiomic features extracted from MRI could distinguish hips with symptomatic FAI from the asymptomatic contralateral hips of the same patients with 97% accuracy4. The goal of this study is to compare the performance of radiomic features vs. standard clinical metrics5 in separating healthy subjects from pathological FAI patients.Material and Methods
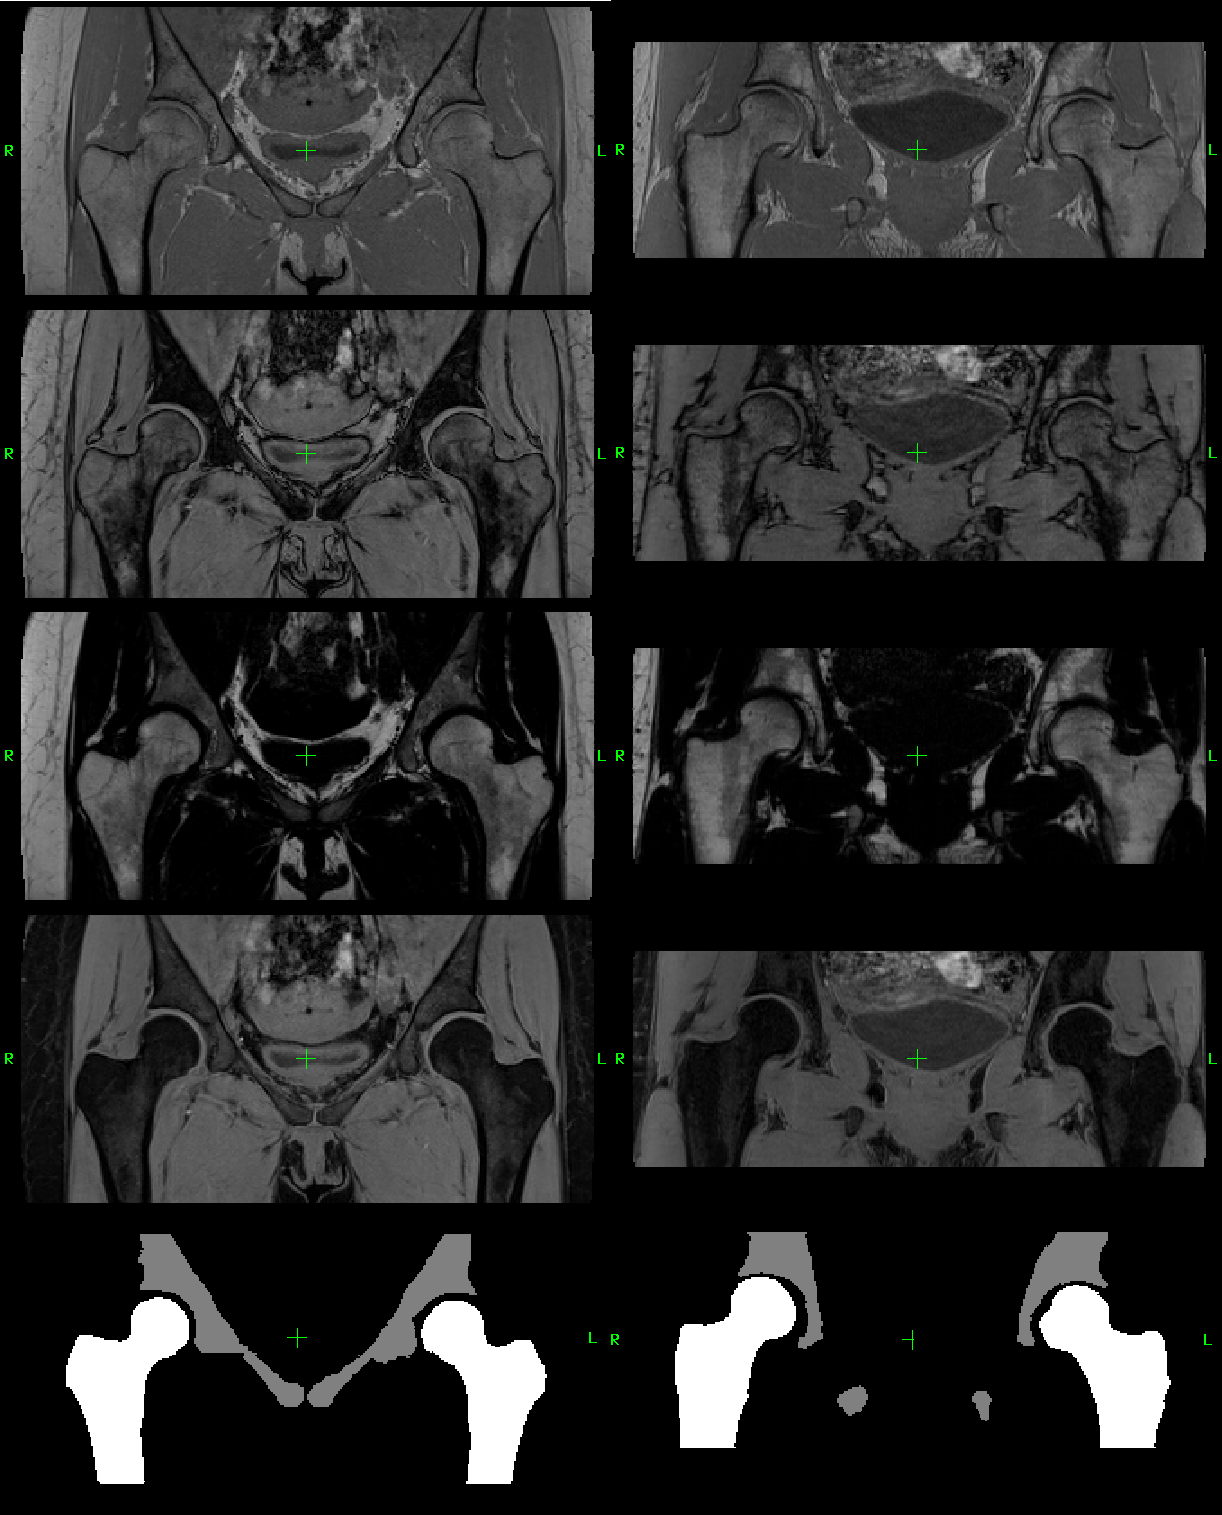
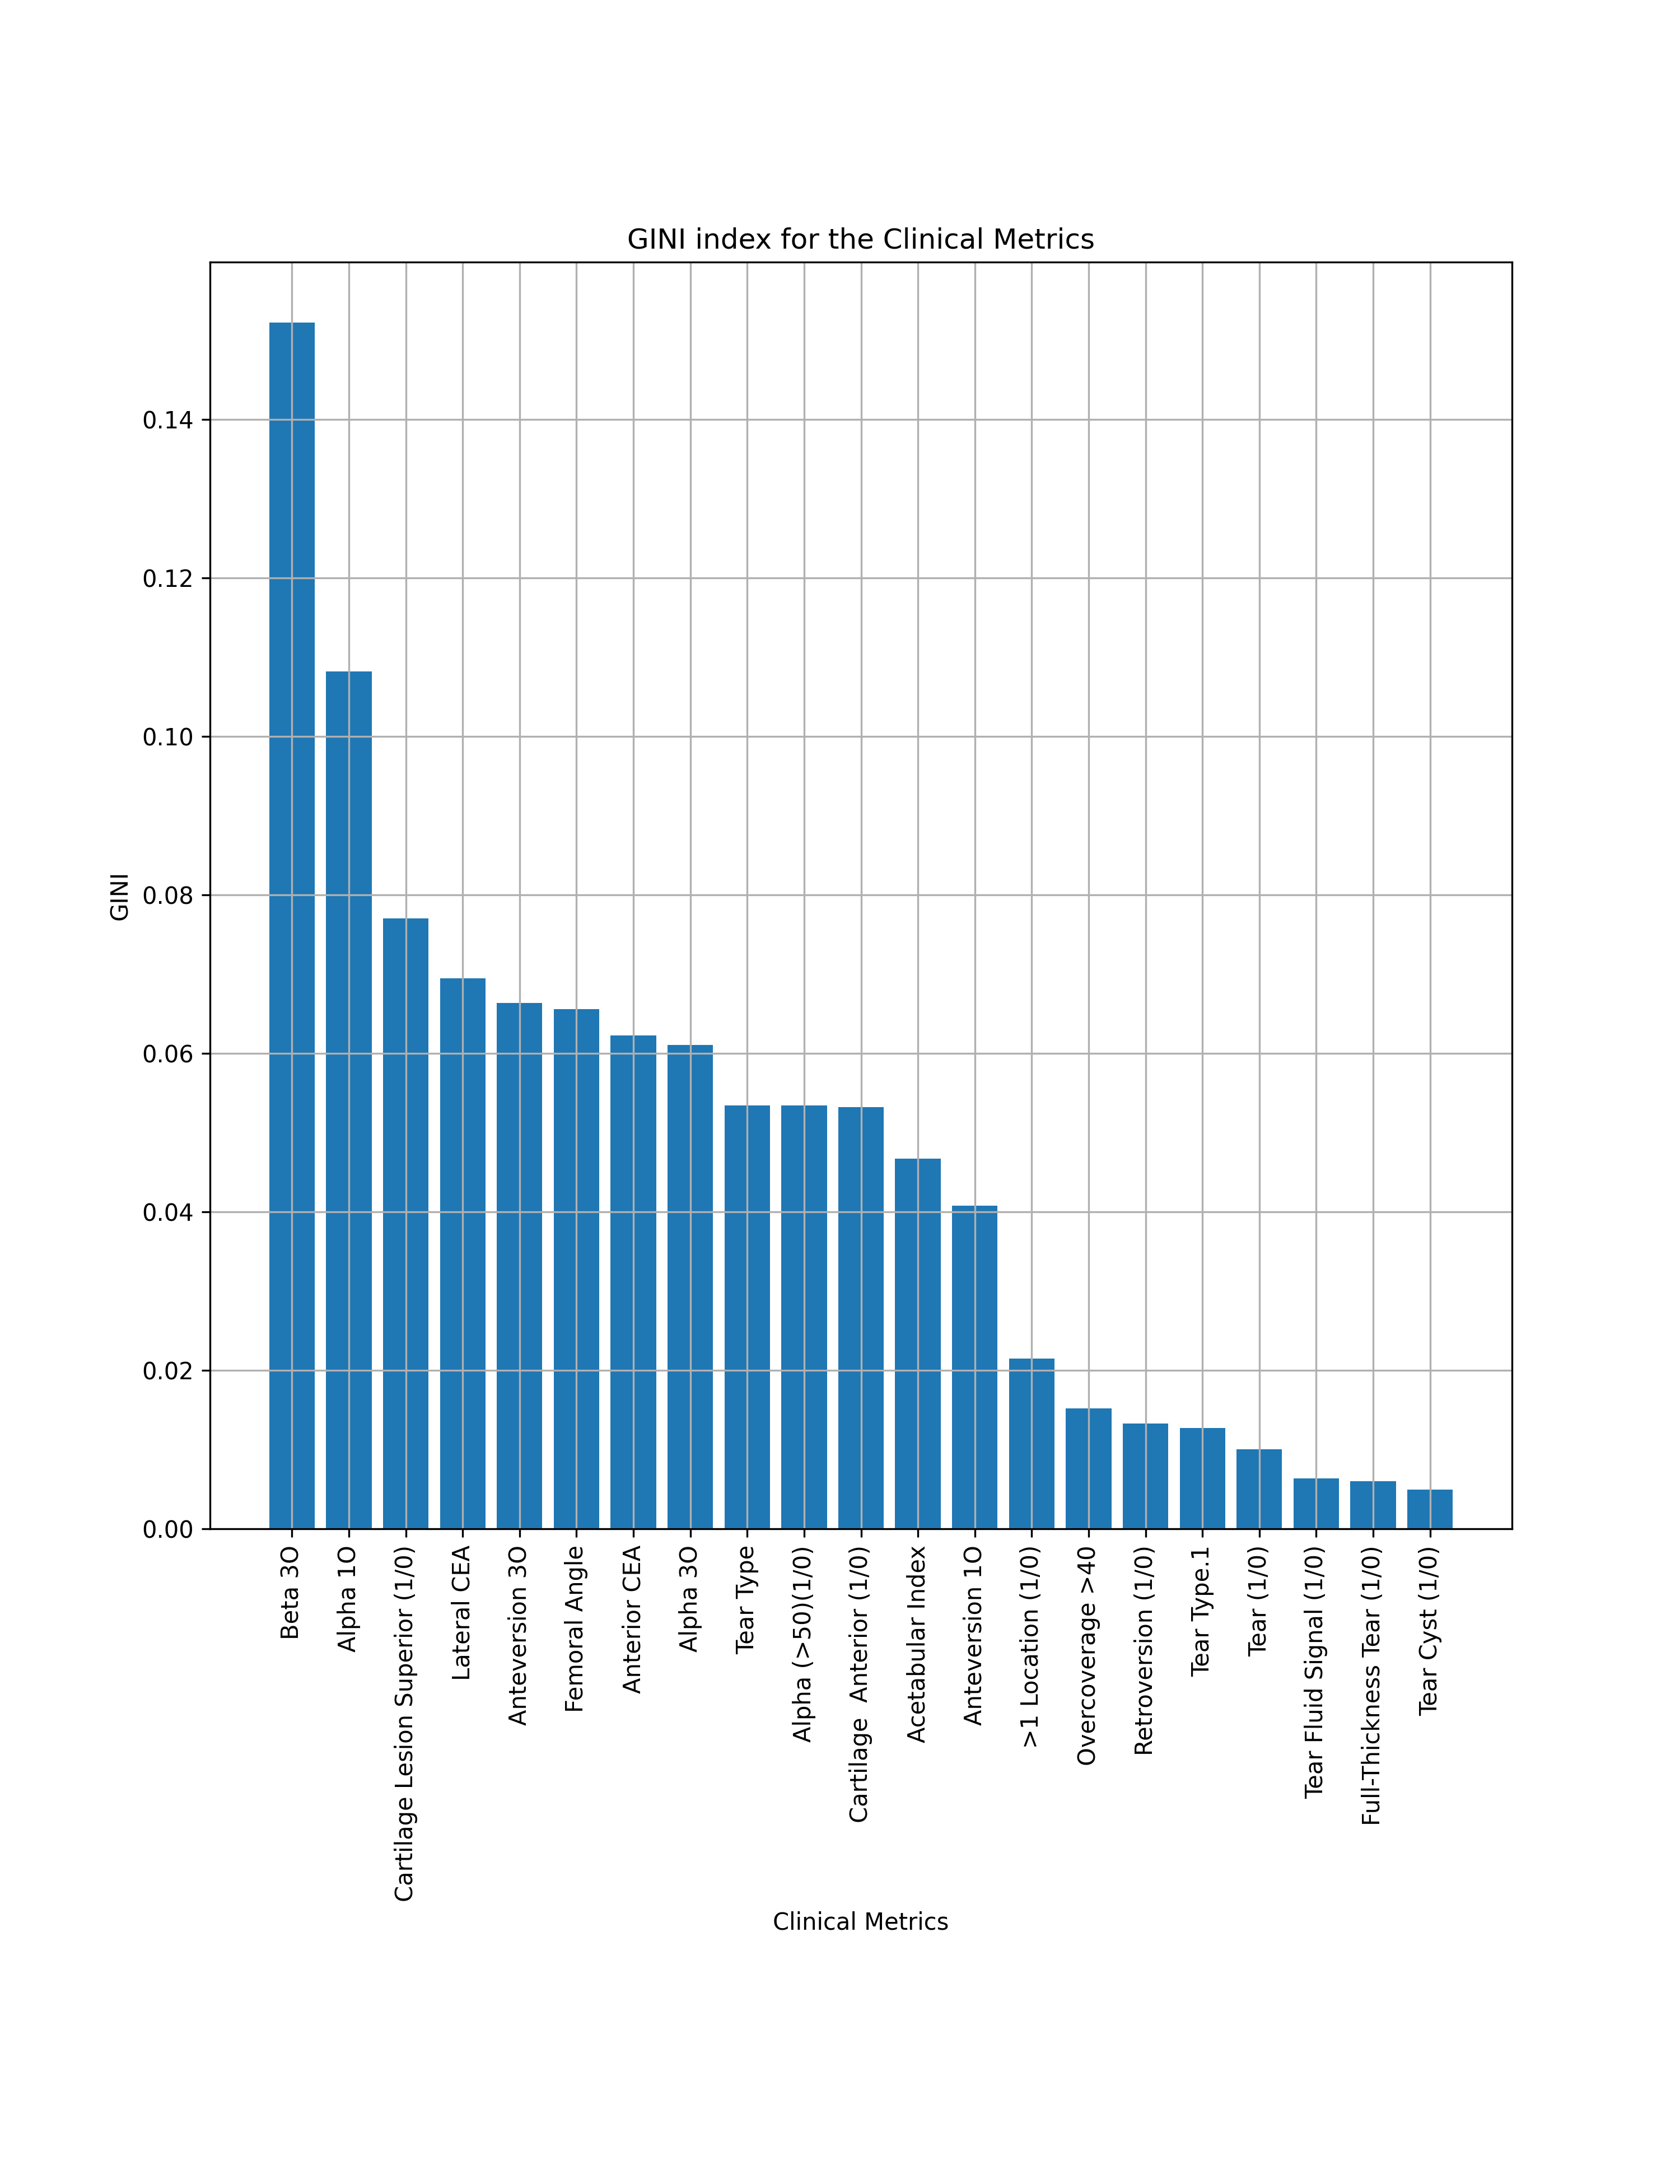
Data: We used preoperative MRI data from 10 healthy subjects (S) (5M/5F, average 32y/o) and 10 patients (P) (4M/6F, average 36.2y/o) with a surgically-confirmed diagnosis of FAI. The MRI included a 3D Dixon sequence of the pelvis, which resulted in four datasets with different contrasts: in-phase (IN), out-of-phase (OUT) water-only (WO), and fat-only (FO) (Figure 1).A musculoskeletal radiologist manually delineated regions of interest (ROIs) for the femur and acetabulum of both hips on each dataset (Figure 1). The same radiologist also recorded 21 clinical metrics normally collected for the diagnosis of FAI (Figure 2).
Radiomic features extraction: For each patient dataset, we extracted 406 radiomic features for each contrast (WO, FO, IN, and OUT), for a total of 1624 features. In particular, for each of the two image-ROI pairs (acetabulum and femur), we extracted 203 features: 61 Shape and Size, 46 GLCM, 22 GLRLM, and 74 FOS6,7. To find the image-ROI pair most informative for the diagnosis of FAI, we organized the radiomic features (combining the four contrasts and the two ROIs) in nine subsets (Table 1), with one subset including all the features.
Features selection: Within each of the ten subsets (nine with radiomic features and one with clinical metrics), we used the Gini Index8 to identify the nine most correlated features/metrics for the prediction of S vs. P.
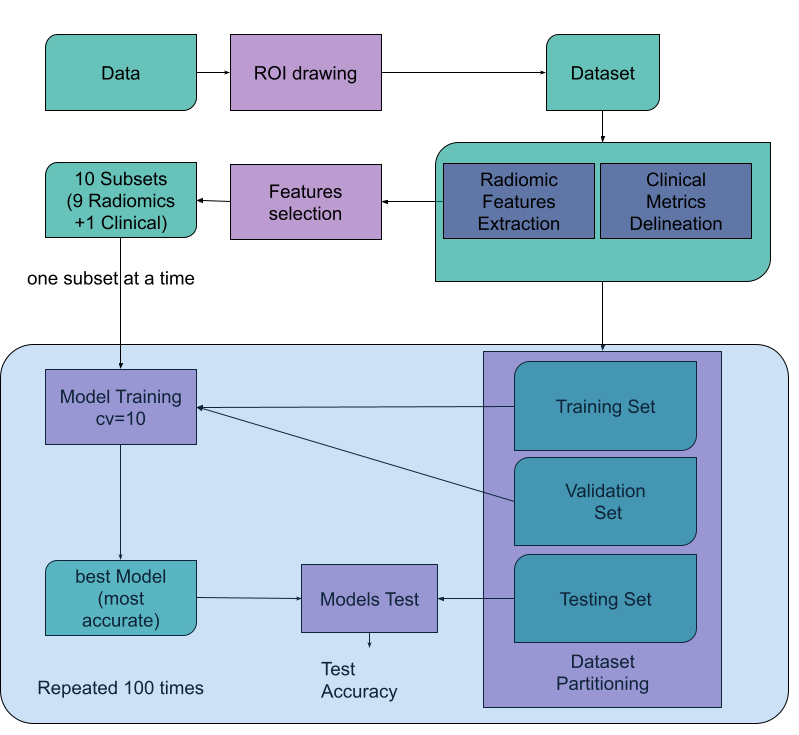
Training and testing: We used random forests (RF)9 as the machine learning algorithm to analyze radiomic features and clinical metrics. To avoid unreliable results due to the small size of our dataset, we employed the approach proposed in Ref10. Specifically, rather than training a single model and evaluating its performance on a single testing set, for each of the 10 subsets, we trained 100 separate models by creating 100 independent combinations with a 60/20/20 (training, validation, testing) split of the 20 MRI datasets (Figure 3), stratified on P and S. Each of the 100 models was independently trained with 10-fold cross-validation, and never exposed to the associated testing set during training. As a result, we trained 10,000 models (10 subsets x 100 RF models x 10 cross-validations), for which the input was either the values of the radiomic features or the clinical metrics depending on the subset, whereas the output was either S or P. For each subset, only the model with the highest prediction accuracy in the 10-fold cross-validation was assessed on its associated testing dataset. Finally, to evaluate the diagnostic performance of each of the nine features/metrics in a specific subset, a Wilcoxon rank-sum test was conducted with p<0.01.
Results
Figure 4 reports the average performance of the 100 models on the testing datasets for each of the ten subsets. The nine most significant radiomic features selected in the ALL subset were all derived from the acetabulum ROI on the fat-only (FO) contrast and yielded a perfect performance in the diagnosis of FAI. Also, the Acetabulum FO and Acetabulum IN subsets achieved perfect performance based on all metrics (100% accuracy, precision, recall, F1 score, specificity, MCC, and AUC). Overall, the nine models using radiomic features had accuracy, precision, recall, F1 score, specificity, and MCC above 80%. The model using the clinical metrics subset had a slightly lower accuracy (74%) and MCC (52.1%).Discussion and Conclusions
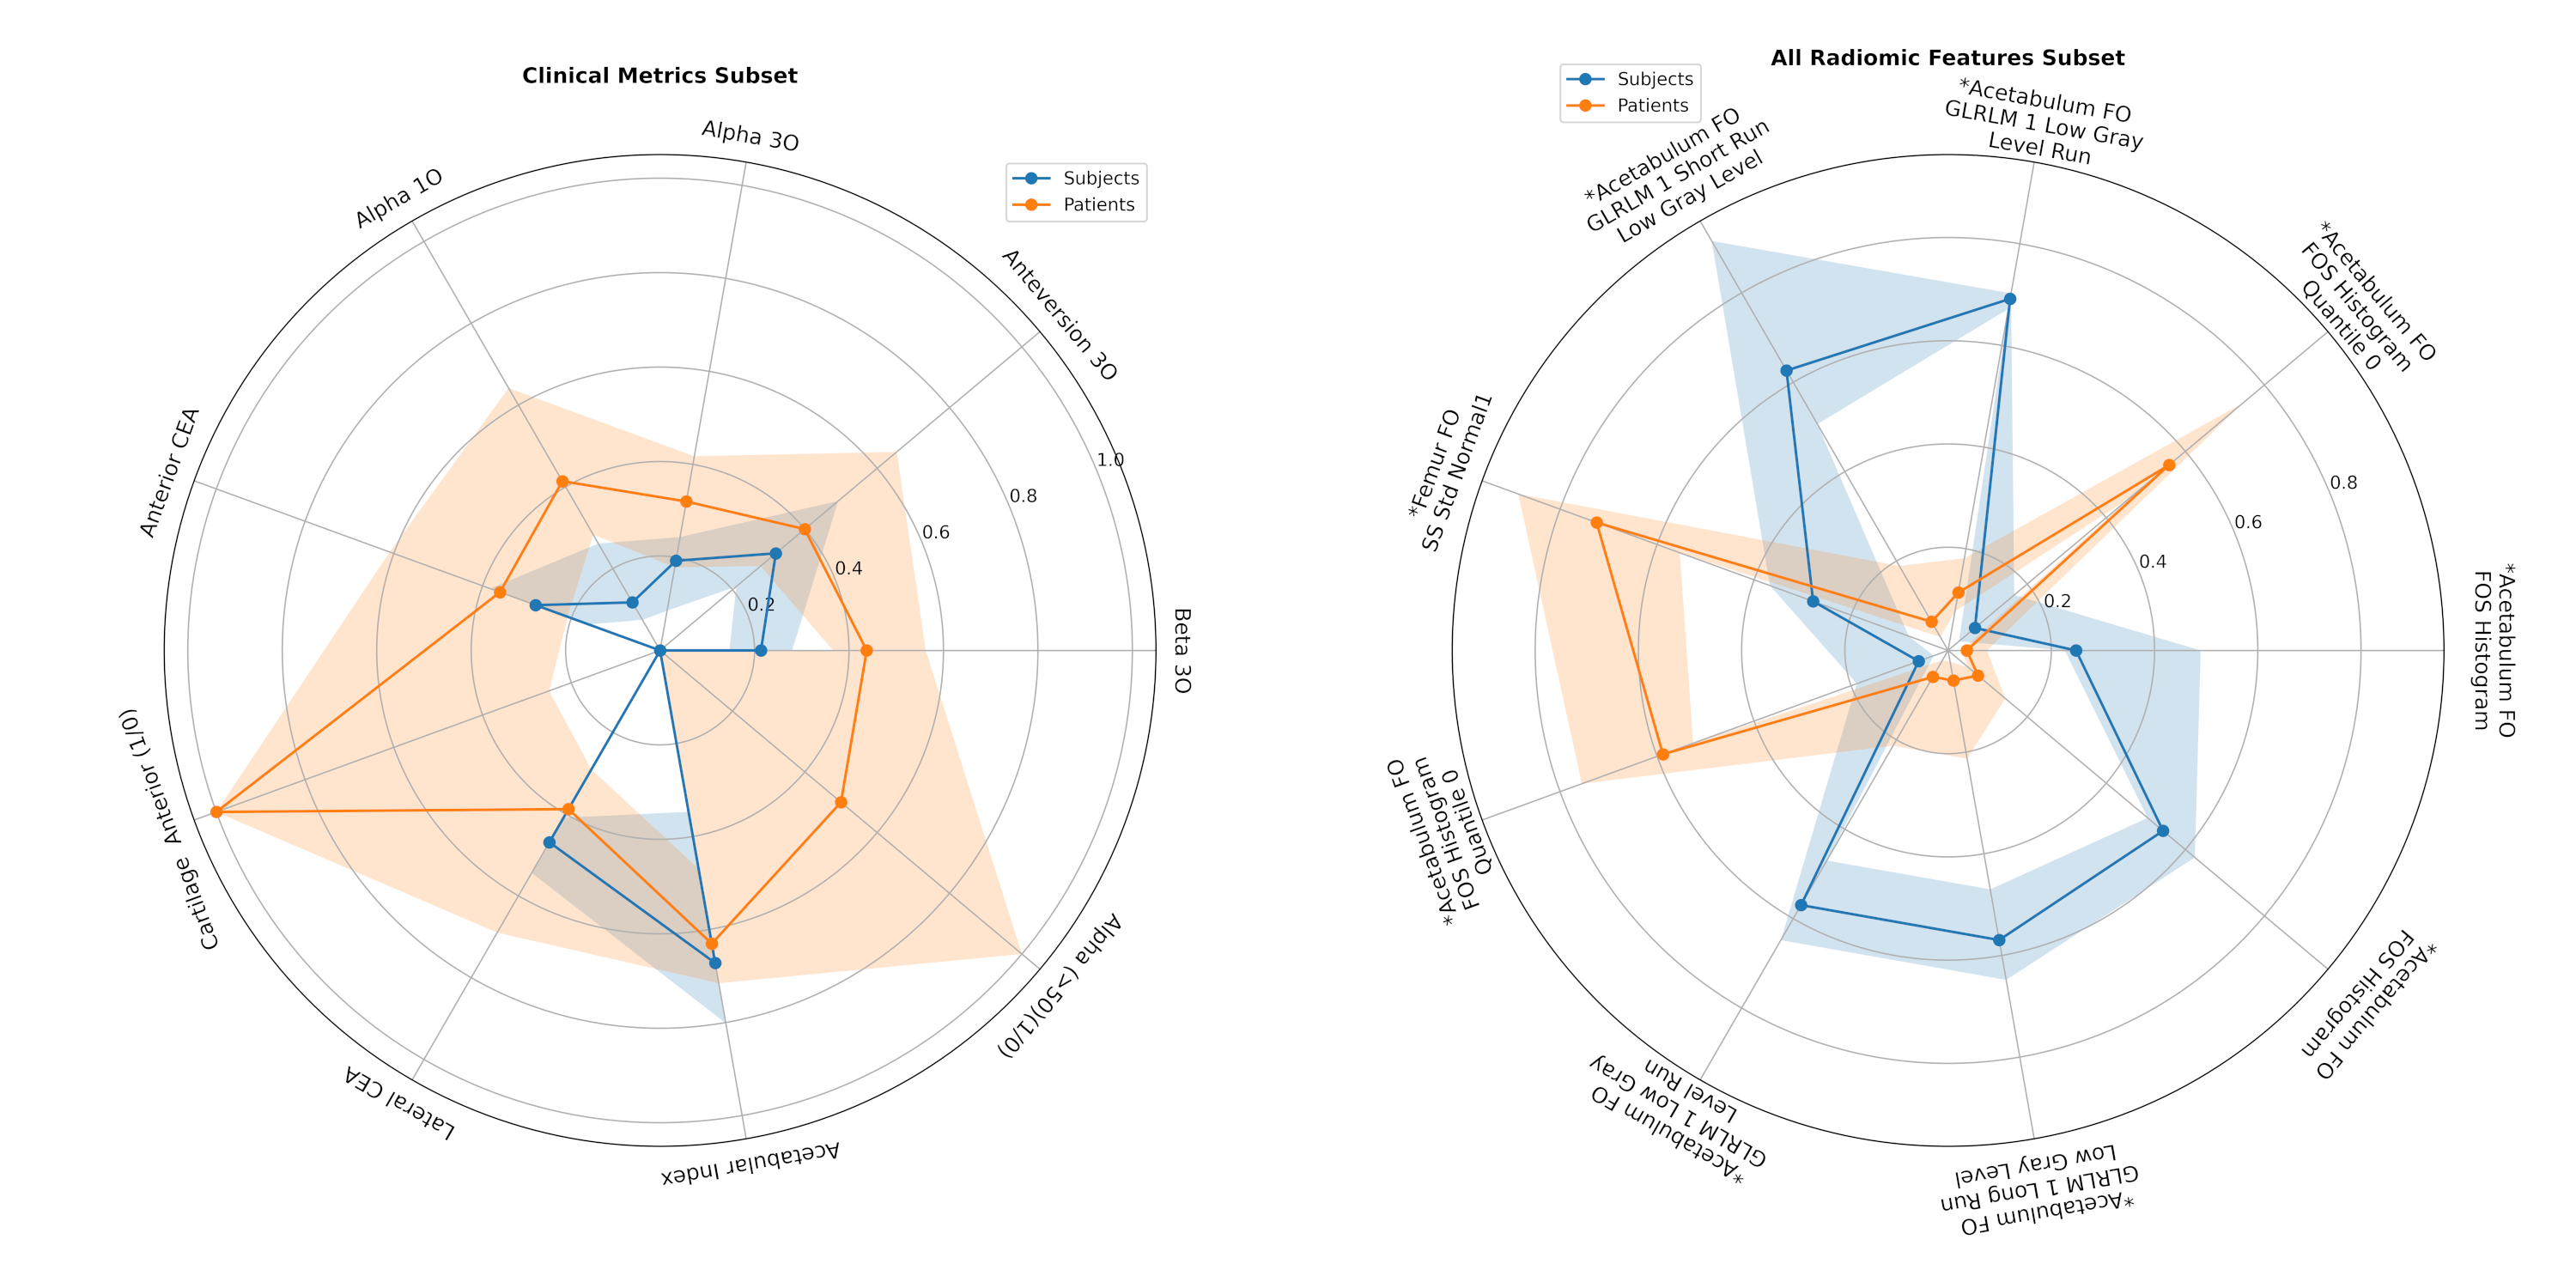
The low diagnostic performance found in this study for the clinical metrics is in agreement with previous work11. Here we show that models trained on radiomic features could instead identify FAI patients with no errors in classification. This is reflected also in the statistical difference in the value of certain radiomic features between FAI patients and healthy controls (Figure 5). Although the study was limited by a relatively small sample size, the results are encouraging for the development of a fully automated radiomics pipeline for FAI diagnosis.Acknowledgements
This work was supported by NIH R01 AR070297 and performed under the Rubric of the Center for Advanced Imaging Innovation and Research (CAI2R, www.cai2r.net), an NIBIB National Center for Biomedical Imaging and Bioengineering (NIH P41 EB017183).
References
- Griffin, D. R., Dickenson, E. J., O’Donnell, J., Agricola, R., Awan, T., Beck, M., Clohisy, J. C., Dijkstra, H. P., Falvey, E., Gimpel, M., Hinman, R. S., Hölmich, P., Kassarjian, A., Martin, H. D., Martin, R., Mather, R. C., Philippon, M. J., Reiman, M. P., Takla, A., … Bennell, K. L. (2016). The Warwick Agreement on femoroacetabular impingement syndrome (FAI syndrome): An international consensus statement. British Journal of Sports Medicine, 50(19), 1169–1176. https://doi.org/10.1136/bjsports-2016-096743
- Naili, J. E., Stålman, A., Valentin, A., Skorpil, M., & Weidenhielm, L. (2021). Hip joint range of motion is restricted by pain rather than mechanical impingement in individuals with femoroacetabular impingement syndrome. Archives of Orthopaedic and Trauma Surgery. https://doi.org/10.1007/s00402-021-04185-4
- Saied, A. M., Redant, C., El-Batouty, M., El-Lakkany, M. R., El-Adl, W. A., Anthonissen, J., Verdonk, R., & Audenaert, E. A. (2017). Accuracy of magnetic resonance studies in the detection of chondral and labral lesions in femoroacetabular impingement:
- Montin E, Kijowski R, Youm T, Lattanzi R. A radiomics approach to the diagnosis of femoroacetabular impingement. Front Radiol. 2023 Mar 20;3:1151258. doi: 10.3389/fradi.2023.1151258. PMID: 37492381; PMCID: PMC10365279.
- Banerjee P, McLean CR. Femoroacetabular impingement: a review of diagnosis and management. Curr Rev Musculoskelet Med. 2011 Mar 16;4(1):23-32. doi: 10.1007/s12178-011-9073-z. Erratum in: Curr Rev Musculoskelet Med. 2012 Dec;5(4):315. PMID: 21475562; PMCID: PMC3070009.
- Bologna, M., Corino, V. D. A., Montin, E., Messina, A., Calareso, G., Greco, F. G., Sdao, S., & Mainardi, L. T. (2018). Assessment of Stability and Discrimination Capacity of Radiomic Features on Apparent Diffusion Coefficient Images. Journal of Digital Imaging.
- Corino, V. D. A., Montin, E., Messina, A., Casali, P. G., Gronchi, A., Marchianò, A., & Mainardi, L. T. (2018). Radiomic analysis of soft tissue sarcomas can distinguish intermediate from high-grade lesions. Journal of Magnetic Resonance Imaging, 4(3), 829–840.
- Menze, B.H., Kelm, B.M., Masuch, R. et al. A comparison of random forest and its Gini importance with standard chemometric methods for the feature selection and classification of spectral data. BMC Bioinformatics 10, 213 (2009)
- Ho, T. K. (1995). Random decision forests. In Proceedings of 3rd international conference on document analysis and recognition (Vol. 1, pp. 278–282).
- An C, Park YW, Ahn SS, Han K, Kim H, Lee SK. Radiomics machine learning study with a small sample size: Single random training-test set split may lead to unreliable results. PLoS One. 2021 Aug 12;16(8):
- Barrientos C, Barahona M, Diaz J, Branes J, Chaparro F, Hinzpeter J. Is there a pathological alpha angle for hip impingement? A diagnostic test study. J Hip Preserv Surg. (2016) 3(3):223–8. 10.1093/jhps/hnw014
Figures